
|
|||||
|
 | |
| |
| |
| |
| |
| |
|
Gene: GMEB1 |
Gene summary for GMEB1 |
| Gene information | Species | Human | Gene symbol | GMEB1 | Gene ID | 10691 |
| Gene name | glucocorticoid modulatory element binding protein 1 | |
| Gene Alias | P96PIF | |
| Cytomap | 1p35.3 | |
| Gene Type | protein-coding | GO ID | GO:0006139 | UniProtAcc | B1AT47 |
Top |
Malignant transformation analysis |
| Identification of the aberrant gene expression in precancerous and cancerous lesions by comparing the gene expression of stem-like cells in diseased tissues with normal stem cells |
| Entrez ID | Symbol | Replicates | Species | Organ | Tissue | Adj P-value | Log2FC | Malignancy |
| 10691 | GMEB1 | LZE20T | Human | Esophagus | ESCC | 3.06e-02 | 9.82e-02 | 0.0662 |
| 10691 | GMEB1 | LZE24T | Human | Esophagus | ESCC | 1.30e-05 | 1.75e-01 | 0.0596 |
| 10691 | GMEB1 | P2T-E | Human | Esophagus | ESCC | 6.07e-25 | 4.62e-01 | 0.1177 |
| 10691 | GMEB1 | P4T-E | Human | Esophagus | ESCC | 3.07e-05 | 1.53e-01 | 0.1323 |
| 10691 | GMEB1 | P5T-E | Human | Esophagus | ESCC | 1.05e-06 | 9.60e-02 | 0.1327 |
| 10691 | GMEB1 | P8T-E | Human | Esophagus | ESCC | 2.81e-11 | 1.65e-01 | 0.0889 |
| 10691 | GMEB1 | P9T-E | Human | Esophagus | ESCC | 3.14e-02 | 1.12e-01 | 0.1131 |
| 10691 | GMEB1 | P10T-E | Human | Esophagus | ESCC | 1.09e-16 | 1.85e-01 | 0.116 |
| 10691 | GMEB1 | P11T-E | Human | Esophagus | ESCC | 8.32e-11 | 3.58e-01 | 0.1426 |
| 10691 | GMEB1 | P12T-E | Human | Esophagus | ESCC | 1.56e-09 | 1.48e-01 | 0.1122 |
| 10691 | GMEB1 | P15T-E | Human | Esophagus | ESCC | 3.05e-11 | 1.65e-01 | 0.1149 |
| 10691 | GMEB1 | P16T-E | Human | Esophagus | ESCC | 1.28e-08 | 1.62e-01 | 0.1153 |
| 10691 | GMEB1 | P17T-E | Human | Esophagus | ESCC | 2.56e-02 | 1.30e-01 | 0.1278 |
| 10691 | GMEB1 | P20T-E | Human | Esophagus | ESCC | 5.80e-09 | 2.41e-01 | 0.1124 |
| 10691 | GMEB1 | P21T-E | Human | Esophagus | ESCC | 4.18e-14 | 2.51e-01 | 0.1617 |
| 10691 | GMEB1 | P22T-E | Human | Esophagus | ESCC | 2.55e-12 | 9.67e-02 | 0.1236 |
| 10691 | GMEB1 | P23T-E | Human | Esophagus | ESCC | 7.94e-08 | 2.73e-01 | 0.108 |
| 10691 | GMEB1 | P24T-E | Human | Esophagus | ESCC | 2.55e-06 | 1.86e-01 | 0.1287 |
| 10691 | GMEB1 | P26T-E | Human | Esophagus | ESCC | 2.15e-16 | 2.47e-01 | 0.1276 |
| 10691 | GMEB1 | P27T-E | Human | Esophagus | ESCC | 1.12e-08 | 2.06e-01 | 0.1055 |
| Page: 1 2 3 |
| Tissue | Expression Dynamics | Abbreviation |
| Esophagus | 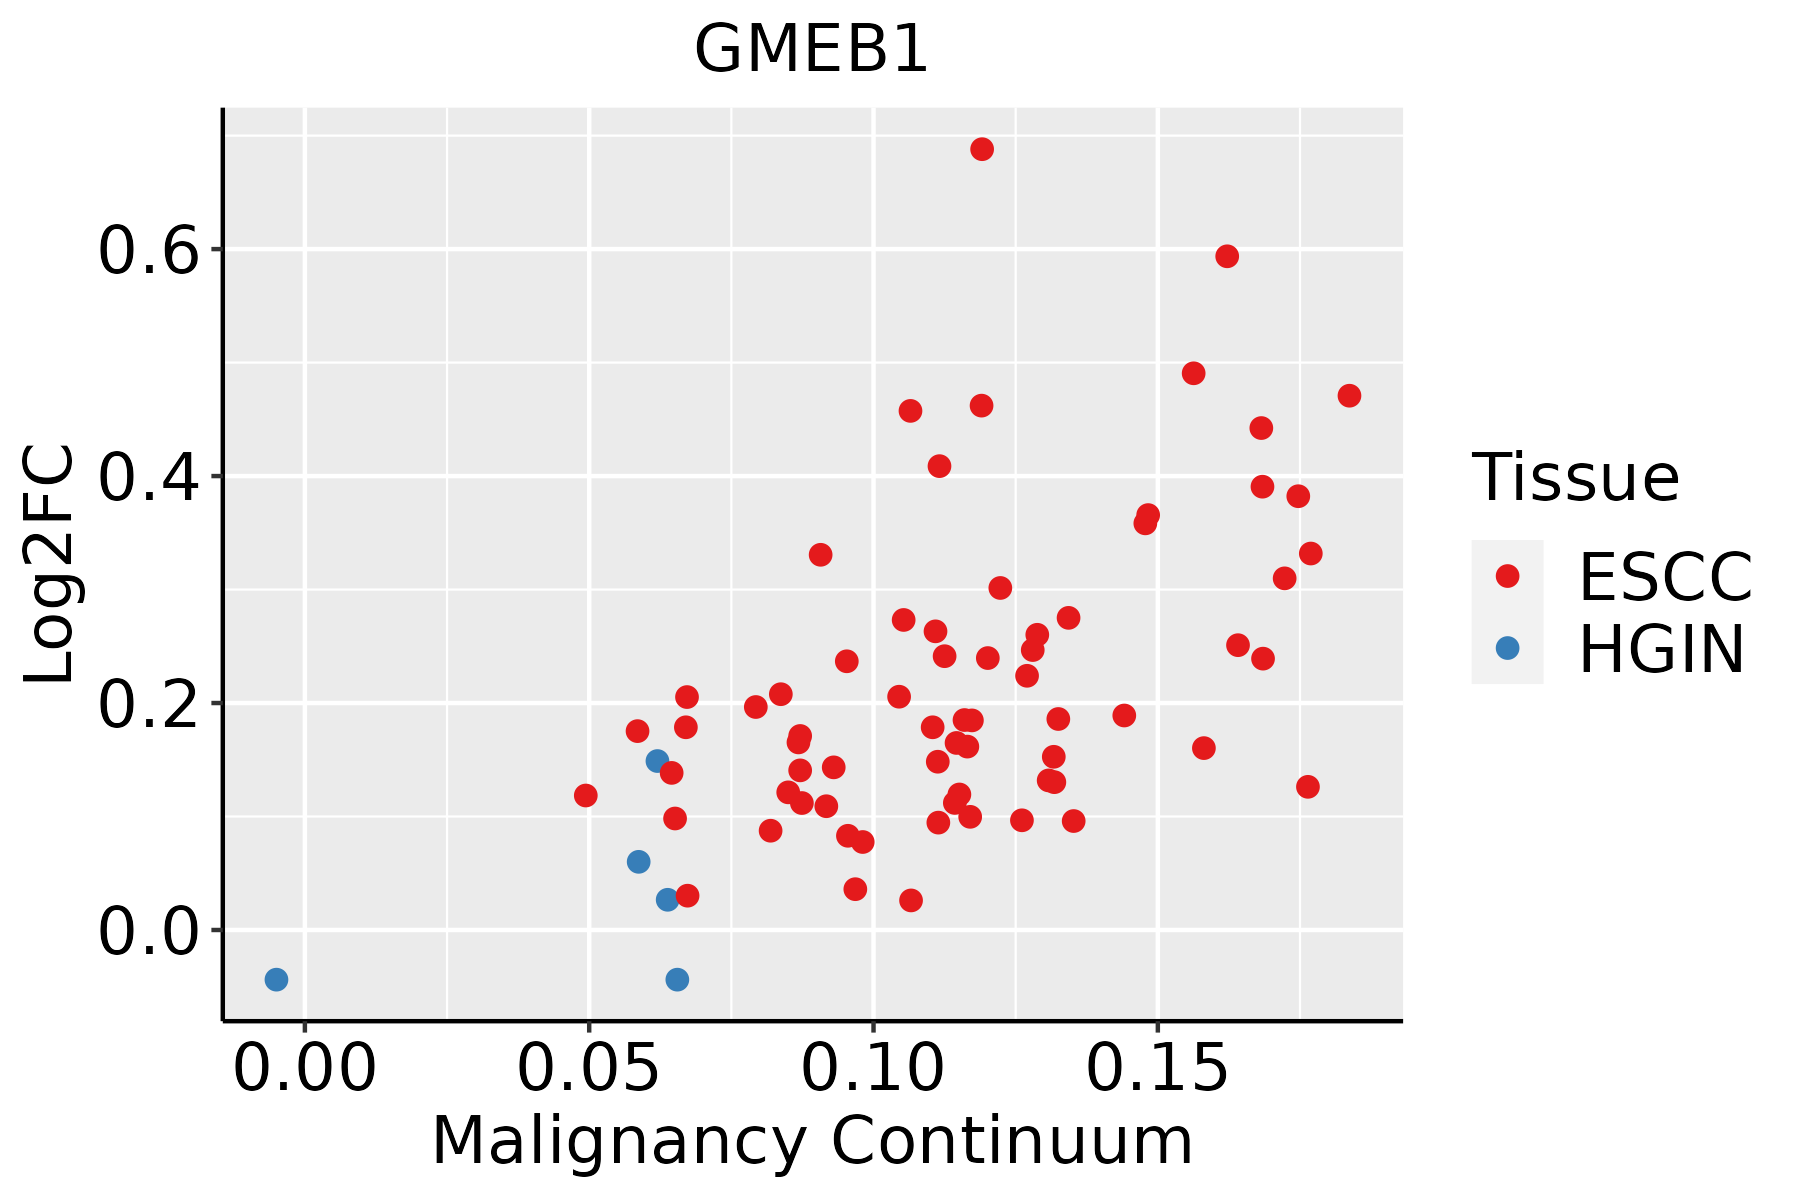 | ESCC: Esophageal squamous cell carcinoma |
| HGIN: High-grade intraepithelial neoplasias | ||
| LGIN: Low-grade intraepithelial neoplasias | ||
| Liver |  | HCC: Hepatocellular carcinoma |
| NAFLD: Non-alcoholic fatty liver disease |
| ∗log2FC in expression of this searched gene in stem-like cells from each diseased tissue sample relative to stem-like cells in normal samples in each tissue plotted against the malignancy continuum. Samples are colored based on if they are from different disease stage. |
Top |
Malignant transformation related pathway analysis |
| Find out the enriched GO biological processes and KEGG pathways involved in transition from healthy to precancer to cancer |
| Tissue | Disease Stage | Enriched GO biological Processes |
| Colorectum | AD |  |
| Colorectum | SER |  |
| Colorectum | MSS |  |
| Colorectum | MSI-H |  |
| Colorectum | FAP |  |
| ∗Top 15 enriched GO BP terms are showed in the bar plot of each disease state in each tissue. Each row represents a significant GO biological process which is colored according to the -log10(p.adjust). |
| Page: 1 2 3 4 5 6 7 8 9 |
| GO ID | Tissue | Disease Stage | Description | Gene Ratio | Bg Ratio | pvalue | p.adjust | Count |
| Page: 1 |
| Pathway ID | Tissue | Disease Stage | Description | Gene Ratio | Bg Ratio | pvalue | p.adjust | qvalue | Count |
| Page: 1 |
Top |
Cell-cell communication analysis |
| Identification of potential cell-cell interactions between two cell types and their ligand-receptor pairs for different disease states |
| Ligand | Receptor | LRpair | Pathway | Tissue | Disease Stage |
| Page: 1 |
Top |
Single-cell gene regulatory network inference analysis |
| Find out the significant the regulons (TFs) and the target genes of each regulon across cell types for different disease states |
| TF | Cell Type | Tissue | Disease Stage | Target Gene | RSS | Regulon Activity |
| GMEB1 | ICAF | Breast | DCIS | AASDHPPT,DDX28,MIS12, etc. | 7.74e-03 |  |
| GMEB1 | END | Colorectum | MSI-H | TARID,TCF7L1,GPC4, etc. | 5.15e-01 |  |
| GMEB1 | NK | Endometrium | Healthy | MAGI1,RHNO1,ST7-AS2, etc. | 2.42e-02 |  |
| GMEB1 | PLA | Oral cavity | ADJ | ZNF230,IGFBP5,EOMES, etc. | 1.11e-01 |  |
| GMEB1 | GDT | Oral cavity | EOLP | ZNF230,IGFBP5,EOMES, etc. | 1.29e-01 |  |
| GMEB1 | MSC.MVA | Thyroid | PTC | AP002387.2,CTLA4,MTRR, etc. | 3.69e-01 |  |
| GMEB1 | END | Thyroid | PTC | AP002387.2,CTLA4,MTRR, etc. | 6.57e-02 | |
| ∗The dot plots of a searched regulon are shown for all cell subpopulations in each disease state of each tissue based on the regulon specific score inferred using pySCENIC and by calculating the average expression. |
| Page: 1 |
Top |
Somatic mutation of malignant transformation related genes |
| Annotation of somatic variants for genes involved in malignant transformation |
| Hugo Symbol | Variant Class | Variant Classification | dbSNP RS | HGVSc | HGVSp | HGVSp Short | SWISSPROT | BIOTYPE | SIFT | PolyPhen | Tumor Sample Barcode | Tissue | Histology | Sex | Age | Stage | Therapy Types | Drugs | Outcome |
| GMEB1 | SNV | Missense_Mutation | novel | c.164N>G | p.Tyr55Cys | p.Y55C | Q9Y692 | protein_coding | tolerated(0.19) | probably_damaging(0.99) | TCGA-3C-AALJ-01 | Breast | breast invasive carcinoma | Female | <65 | I/II | Chemotherapy | doxorubicin | SD |
| GMEB1 | SNV | Missense_Mutation | c.206A>T | p.Glu69Val | p.E69V | Q9Y692 | protein_coding | deleterious(0.01) | probably_damaging(0.981) | TCGA-A1-A0SK-01 | Breast | breast invasive carcinoma | Female | <65 | I/II | Unknown | Unknown | PD | |
| GMEB1 | SNV | Missense_Mutation | c.1517C>T | p.Ser506Leu | p.S506L | Q9Y692 | protein_coding | tolerated(0.2) | benign(0.013) | TCGA-A8-A07W-01 | Breast | breast invasive carcinoma | Female | >=65 | III/IV | Hormone Therapy | exemestane | SD | |
| GMEB1 | SNV | Missense_Mutation | novel | c.1718N>T | p.Asp573Val | p.D573V | Q9Y692 | protein_coding | deleterious_low_confidence(0) | probably_damaging(0.987) | TCGA-AR-A2LN-01 | Breast | breast invasive carcinoma | Female | >=65 | I/II | Hormone Therapy | letrozole | SD |
| GMEB1 | SNV | Missense_Mutation | novel | c.1330N>G | p.Gln444Glu | p.Q444E | Q9Y692 | protein_coding | deleterious(0.02) | possibly_damaging(0.857) | TCGA-BH-A0E7-01 | Breast | breast invasive carcinoma | Female | >=65 | I/II | Hormone Therapy | arimidex | SD |
| GMEB1 | SNV | Missense_Mutation | c.347T>A | p.Ile116Lys | p.I116K | Q9Y692 | protein_coding | deleterious(0.01) | probably_damaging(0.995) | TCGA-D8-A1JK-01 | Breast | breast invasive carcinoma | Female | >=65 | I/II | Unknown | Unknown | SD | |
| GMEB1 | SNV | Missense_Mutation | c.477N>A | p.Met159Ile | p.M159I | Q9Y692 | protein_coding | tolerated(0.59) | probably_damaging(0.932) | TCGA-E2-A14Z-01 | Breast | breast invasive carcinoma | Female | <65 | I/II | Hormone Therapy | arimidex | PD | |
| GMEB1 | SNV | Missense_Mutation | novel | c.1398N>G | p.His466Gln | p.H466Q | Q9Y692 | protein_coding | tolerated(0.09) | probably_damaging(0.969) | TCGA-E2-A1B6-01 | Breast | breast invasive carcinoma | Female | <65 | I/II | Unspecific | Adriamycin | SD |
| GMEB1 | insertion | Frame_Shift_Ins | novel | c.82_83insTC | p.Asp28ValfsTer7 | p.D28Vfs*7 | Q9Y692 | protein_coding | TCGA-A2-A0D1-01 | Breast | breast invasive carcinoma | Female | >=65 | I/II | Chemotherapy | taxotere | SD | ||
| GMEB1 | insertion | Frame_Shift_Ins | novel | c.83_84insTCTTCCCCTTCCCATGCAGCTCAGTTCAGTCTCCCTC | p.Thr29LeufsTer14 | p.T29Lfs*14 | Q9Y692 | protein_coding | TCGA-A2-A0D1-01 | Breast | breast invasive carcinoma | Female | >=65 | I/II | Chemotherapy | taxotere | SD |
| Page: 1 2 3 4 5 |
Top |
Related drugs of malignant transformation related genes |
| Identification of chemicals and drugs interact with genes involved in malignant transfromation |
| (DGIdb 4.0) |
| Entrez ID | Symbol | Category | Interaction Types | Drug Claim Name | Drug Name | PMIDs |
| Page: 1 |

Copyright 2023-Present -The University of Texas Health Science Center at Houston |