| Tissue | Expression Dynamics | Abbreviation |
| Cervix | 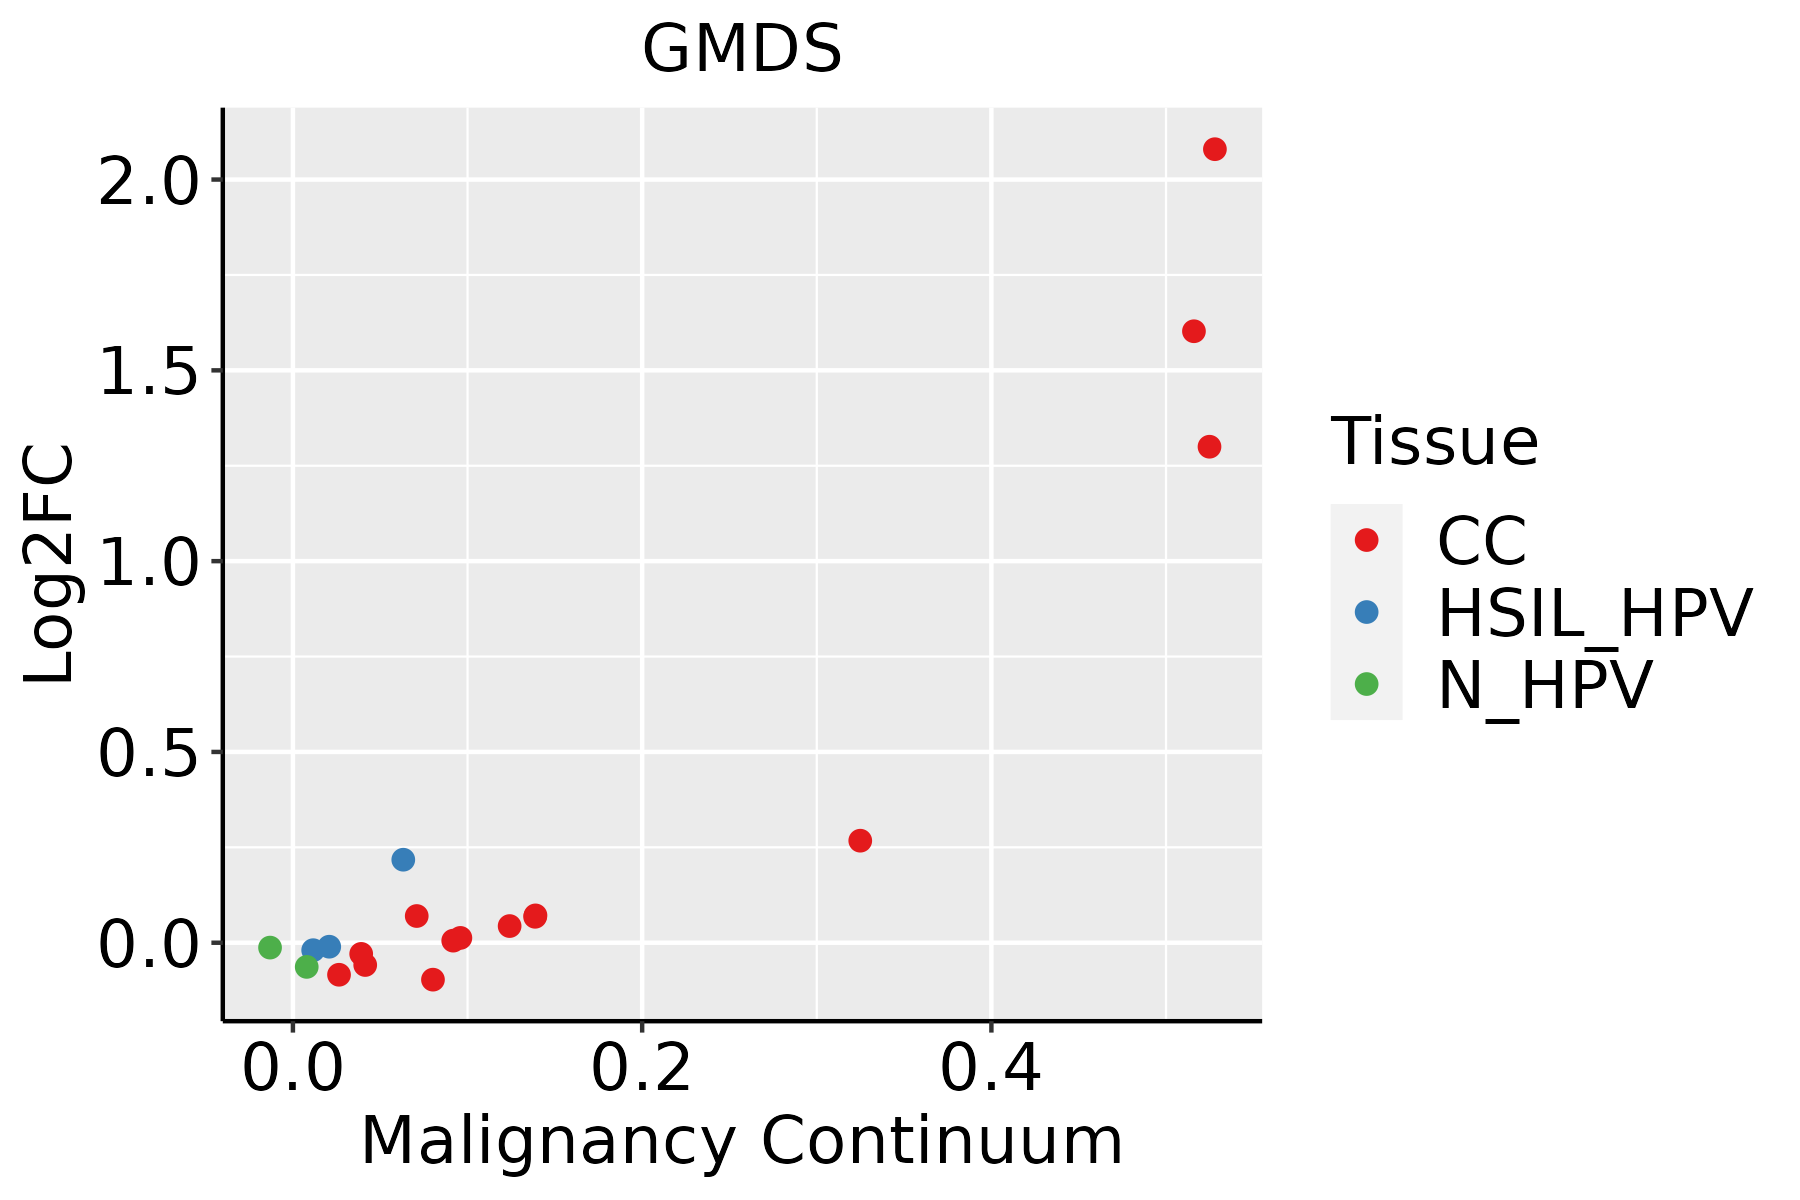 | CC: Cervix cancer |
| HSIL_HPV: HPV-infected high-grade squamous intraepithelial lesions |
| N_HPV: HPV-infected normal cervix |
| Colorectum (GSE201348) |  | FAP: Familial adenomatous polyposis |
| CRC: Colorectal cancer |
| Colorectum (HTA11) |  | AD: Adenomas |
| SER: Sessile serrated lesions |
| MSI-H: Microsatellite-high colorectal cancer |
| MSS: Microsatellite stable colorectal cancer |
| Endometrium | 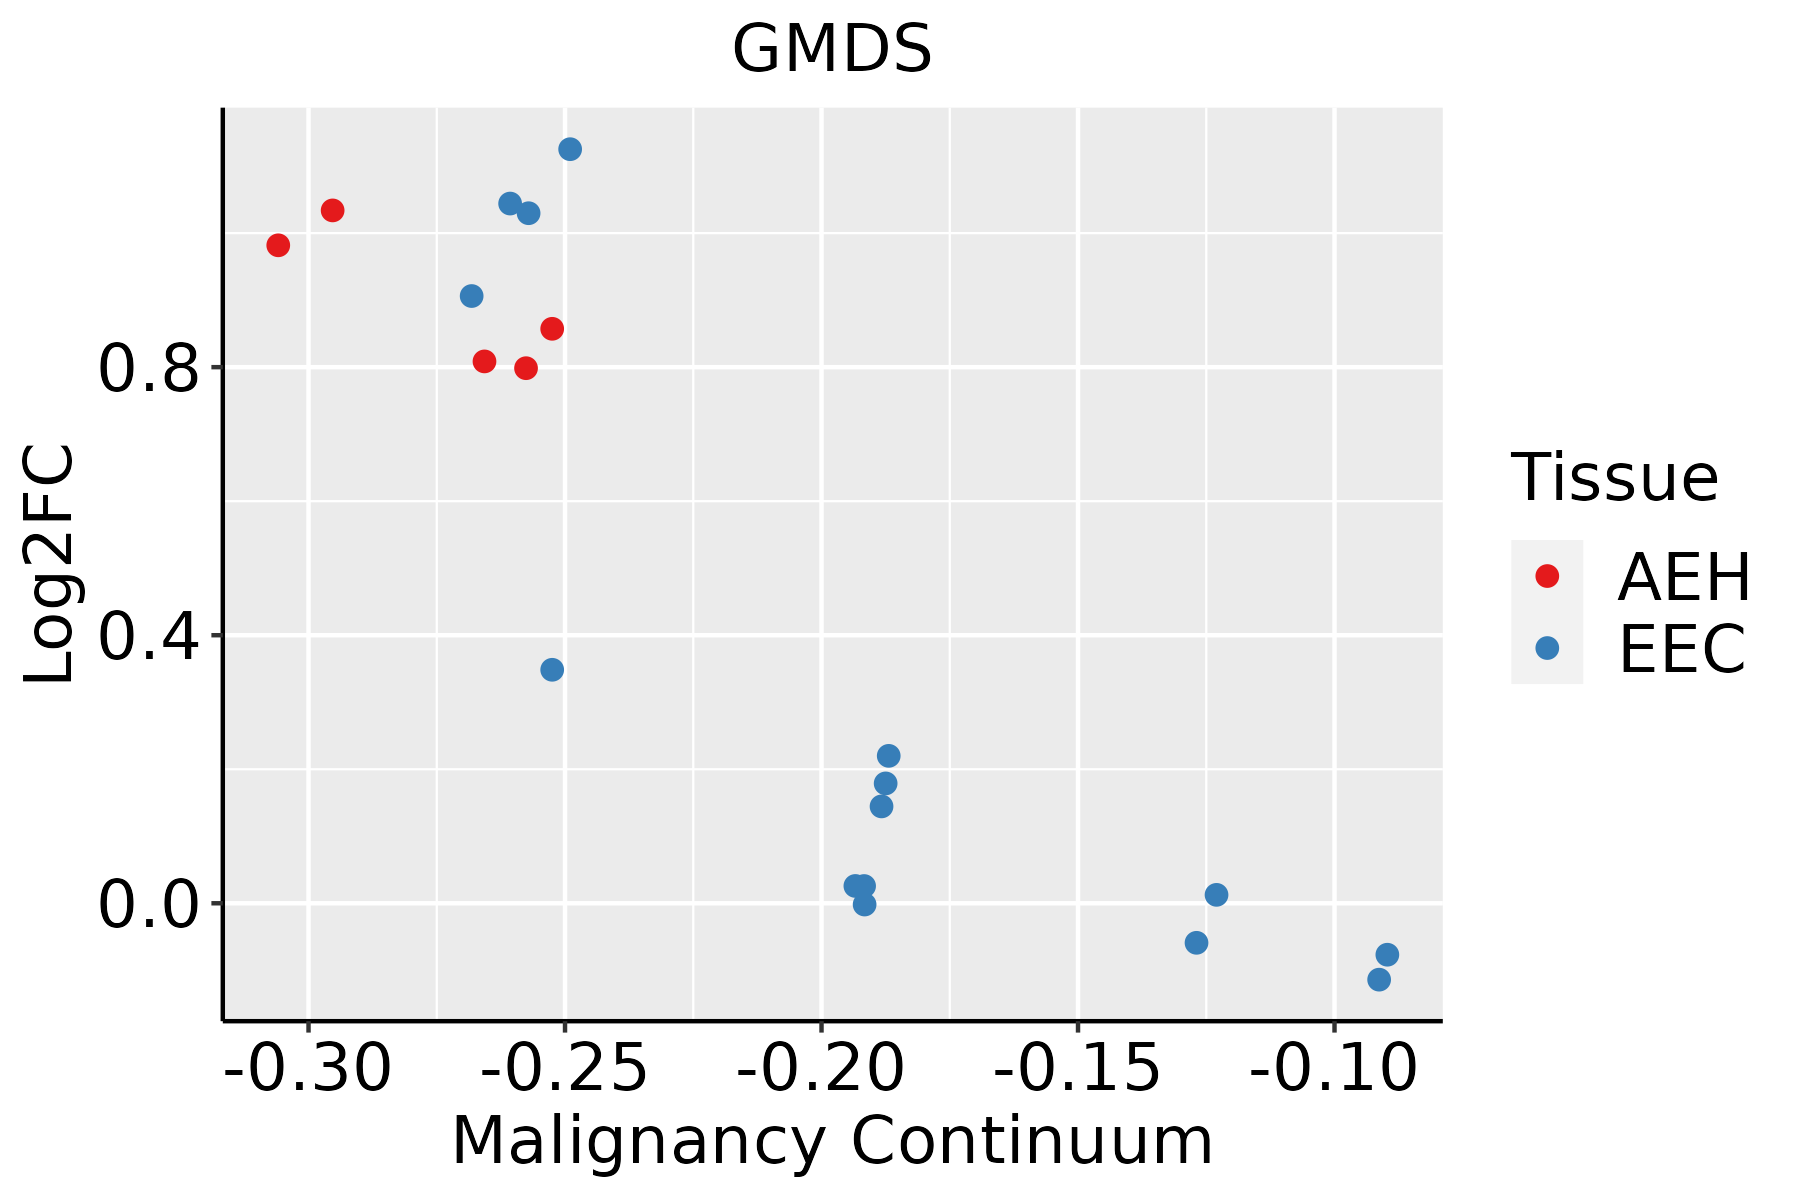 | AEH: Atypical endometrial hyperplasia |
| EEC: Endometrioid Cancer |
| Esophagus | 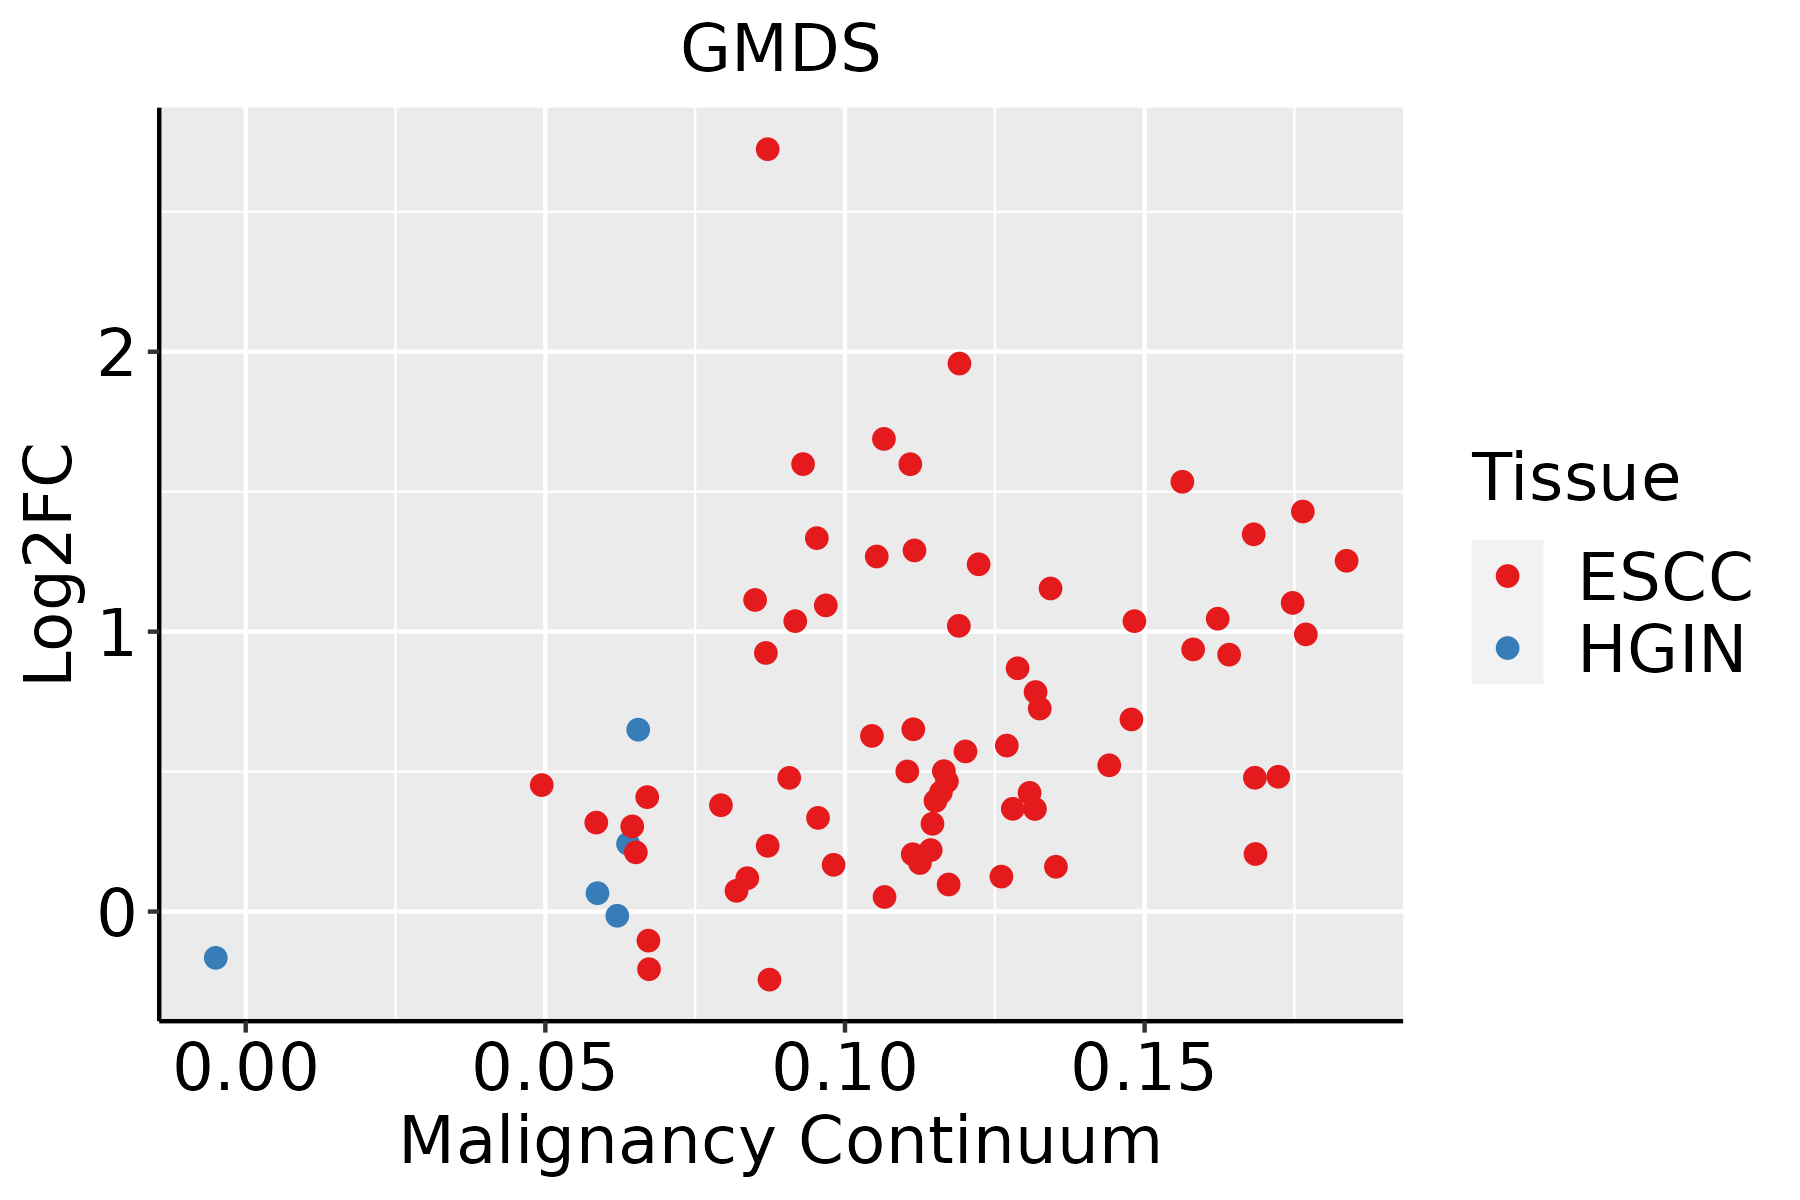 | ESCC: Esophageal squamous cell carcinoma |
| HGIN: High-grade intraepithelial neoplasias |
| LGIN: Low-grade intraepithelial neoplasias |
| GC | 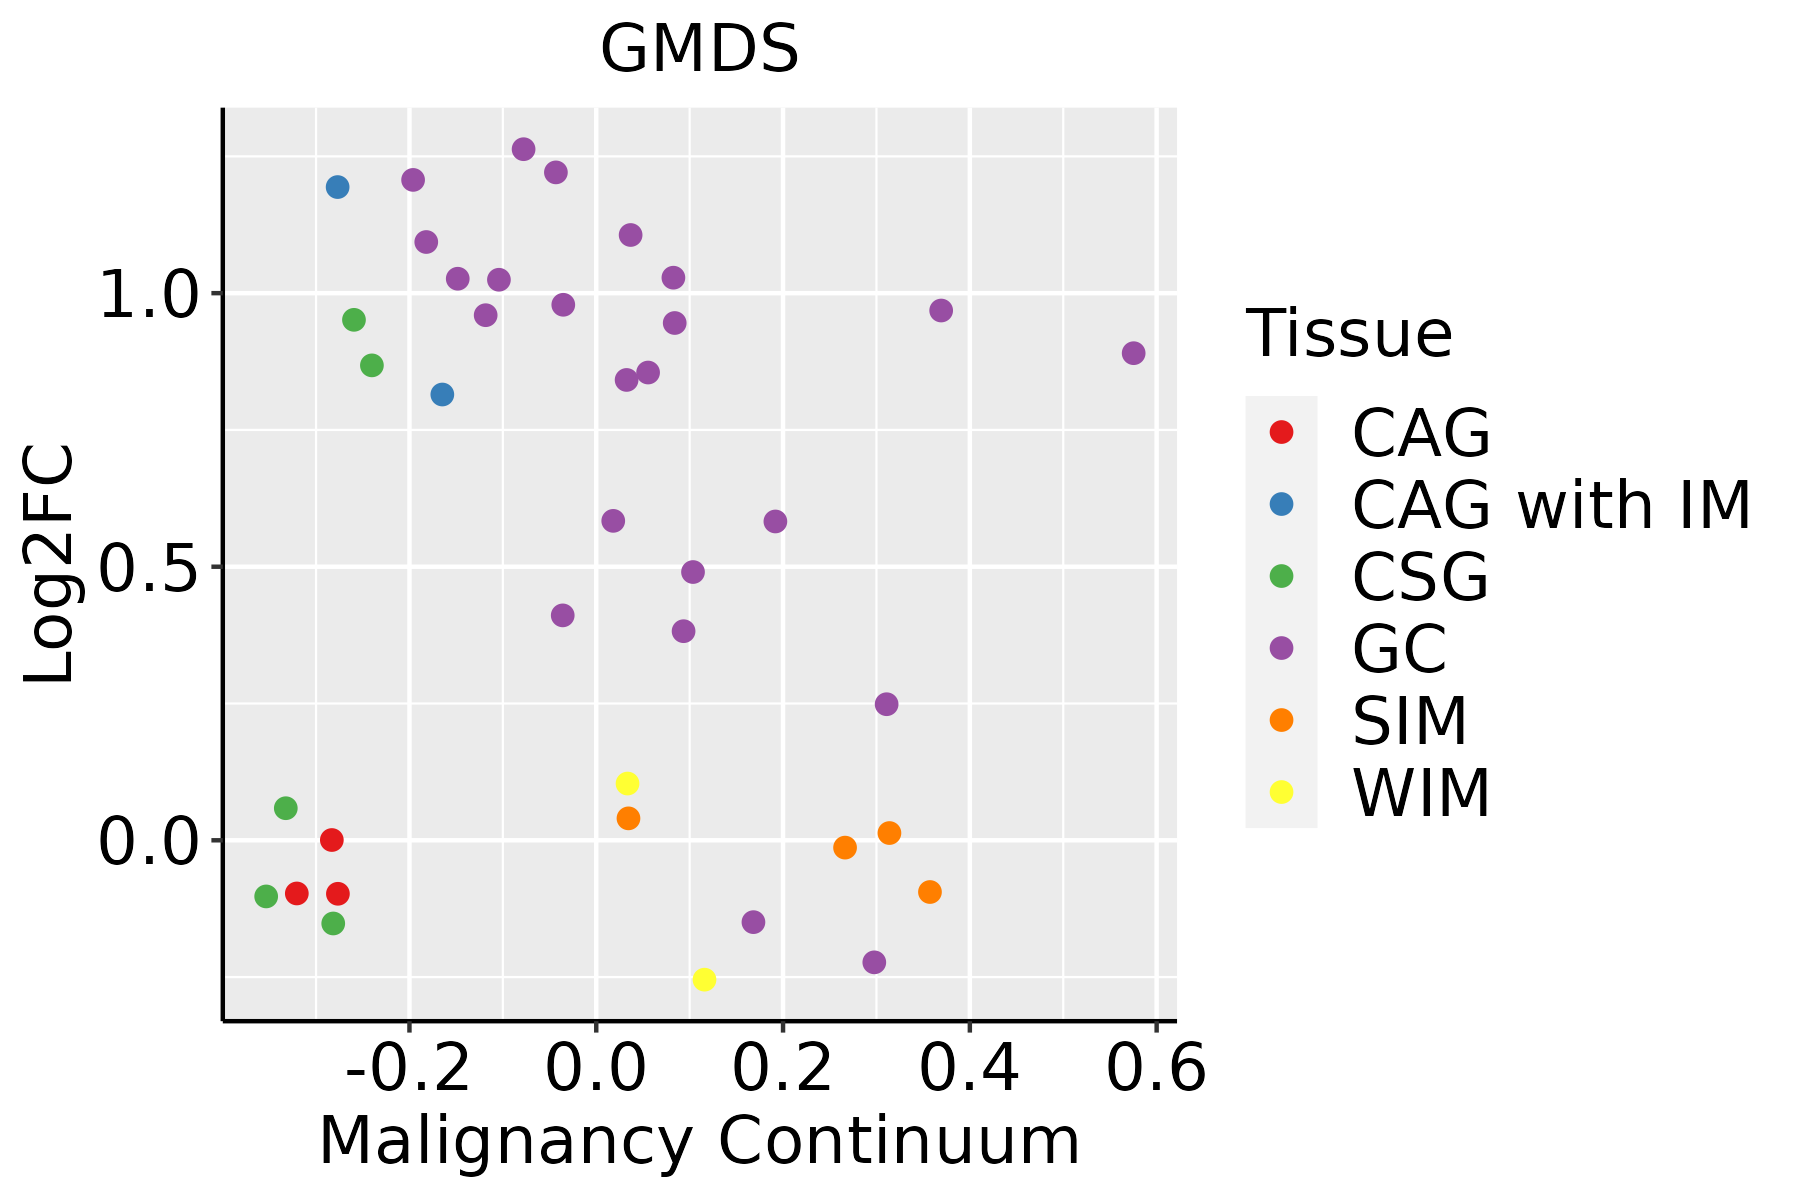 | CAG: Chronic atrophic gastritis |
| CAG with IM: Chronic atrophic gastritis with intestinal metaplasia |
| CSG: Chronic superficial gastritis |
| GC: Gastric cancer |
| SIM: Severe intestinal metaplasia |
| WIM: Wild intestinal metaplasia |
| Liver |  | HCC: Hepatocellular carcinoma |
| NAFLD: Non-alcoholic fatty liver disease |
| Lung | 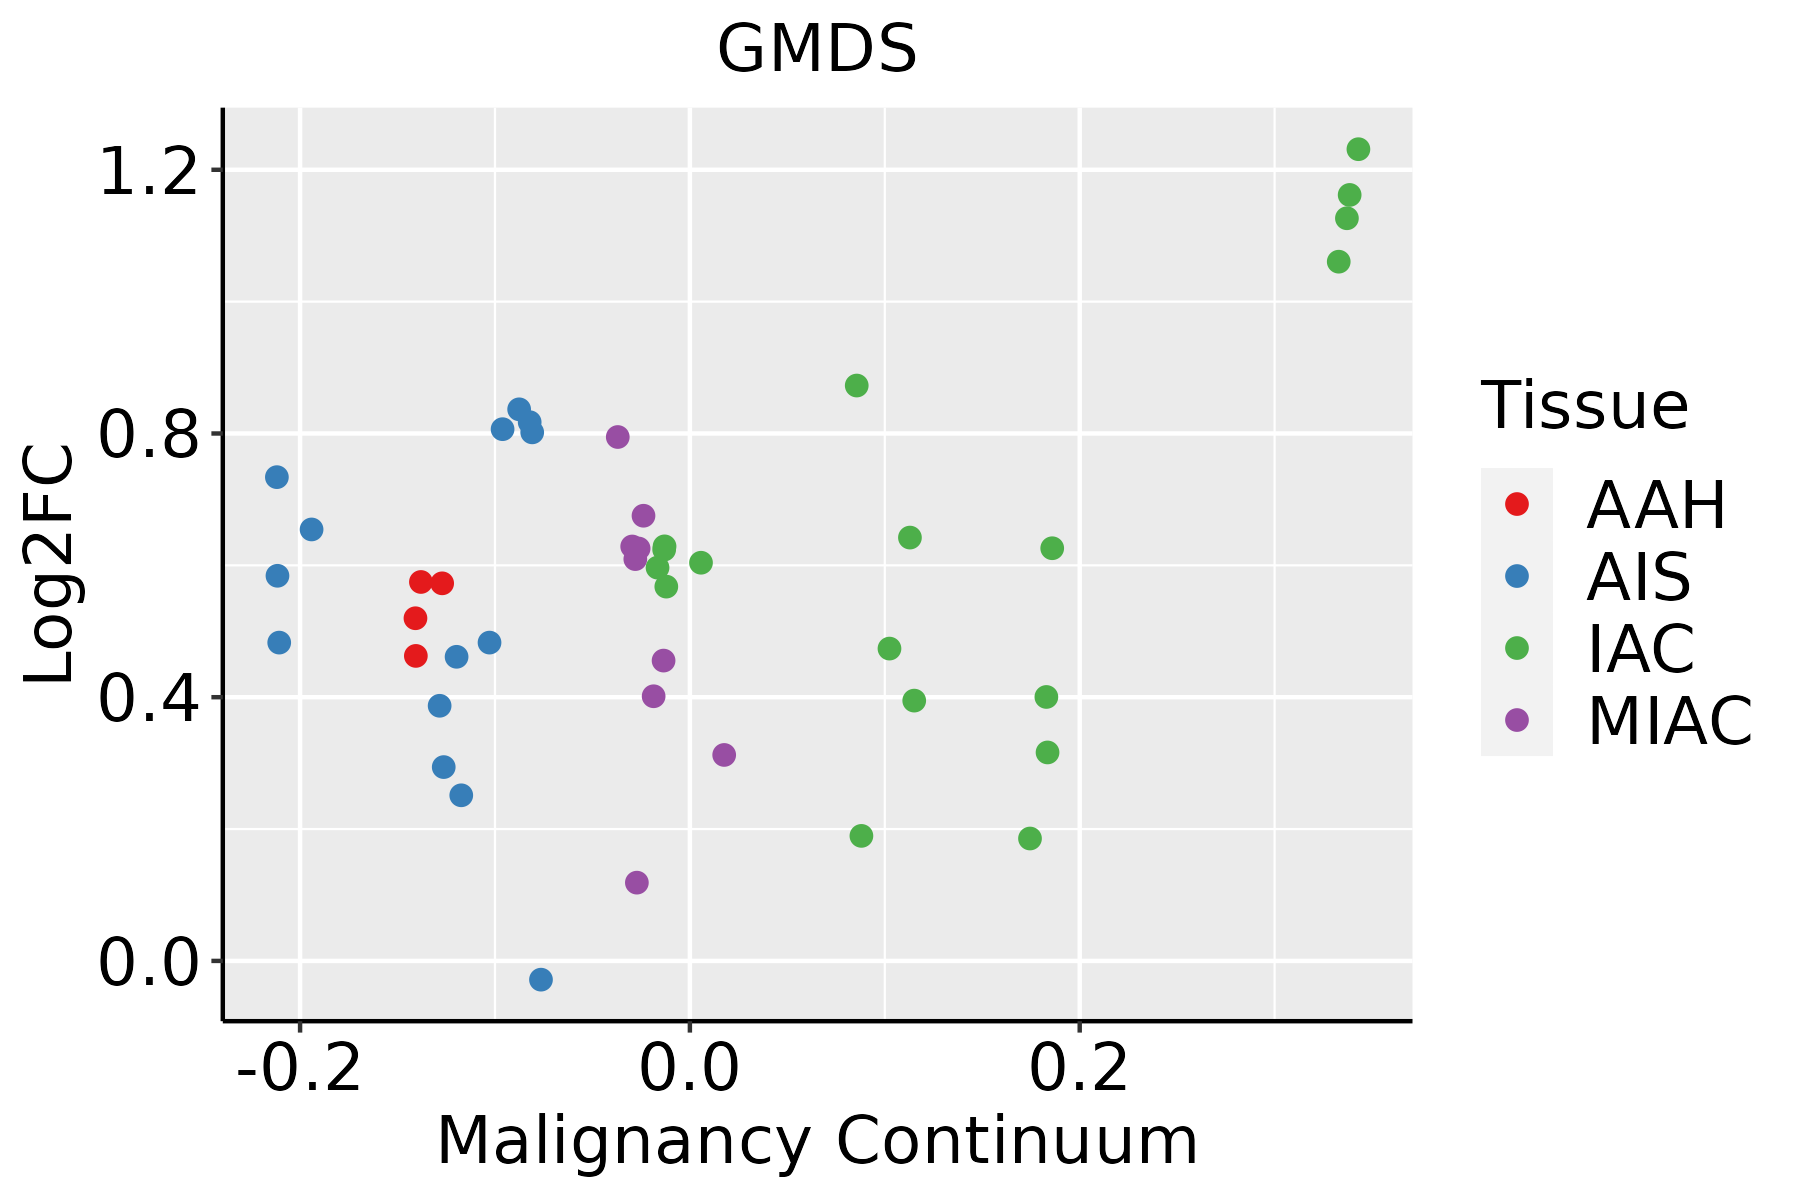 | AAH: Atypical adenomatous hyperplasia |
| AIS: Adenocarcinoma in situ |
| IAC: Invasive lung adenocarcinoma |
| MIA: Minimally invasive adenocarcinoma |
| Oral Cavity | 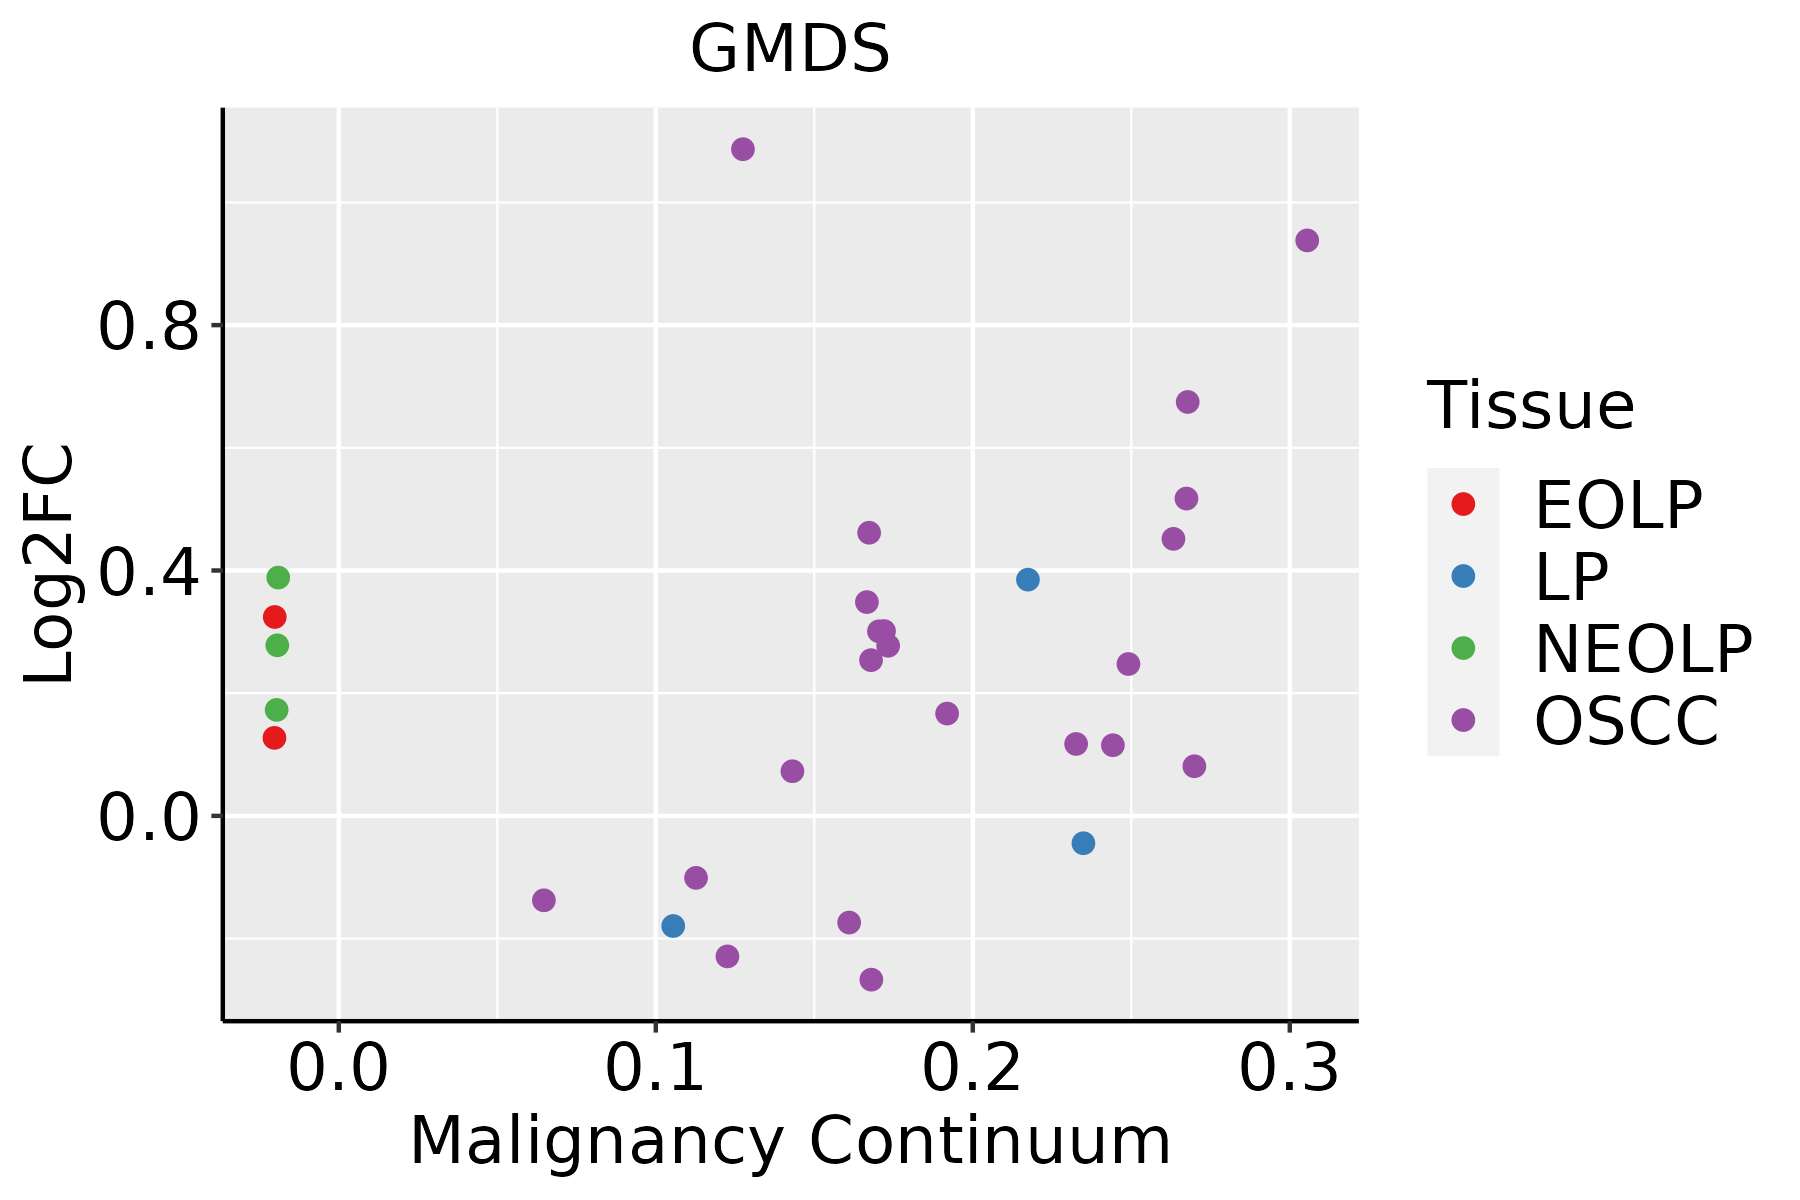 | EOLP: Erosive Oral lichen planus |
| LP: leukoplakia |
| NEOLP: Non-erosive oral lichen planus |
| OSCC: Oral squamous cell carcinoma |
| Prostate | 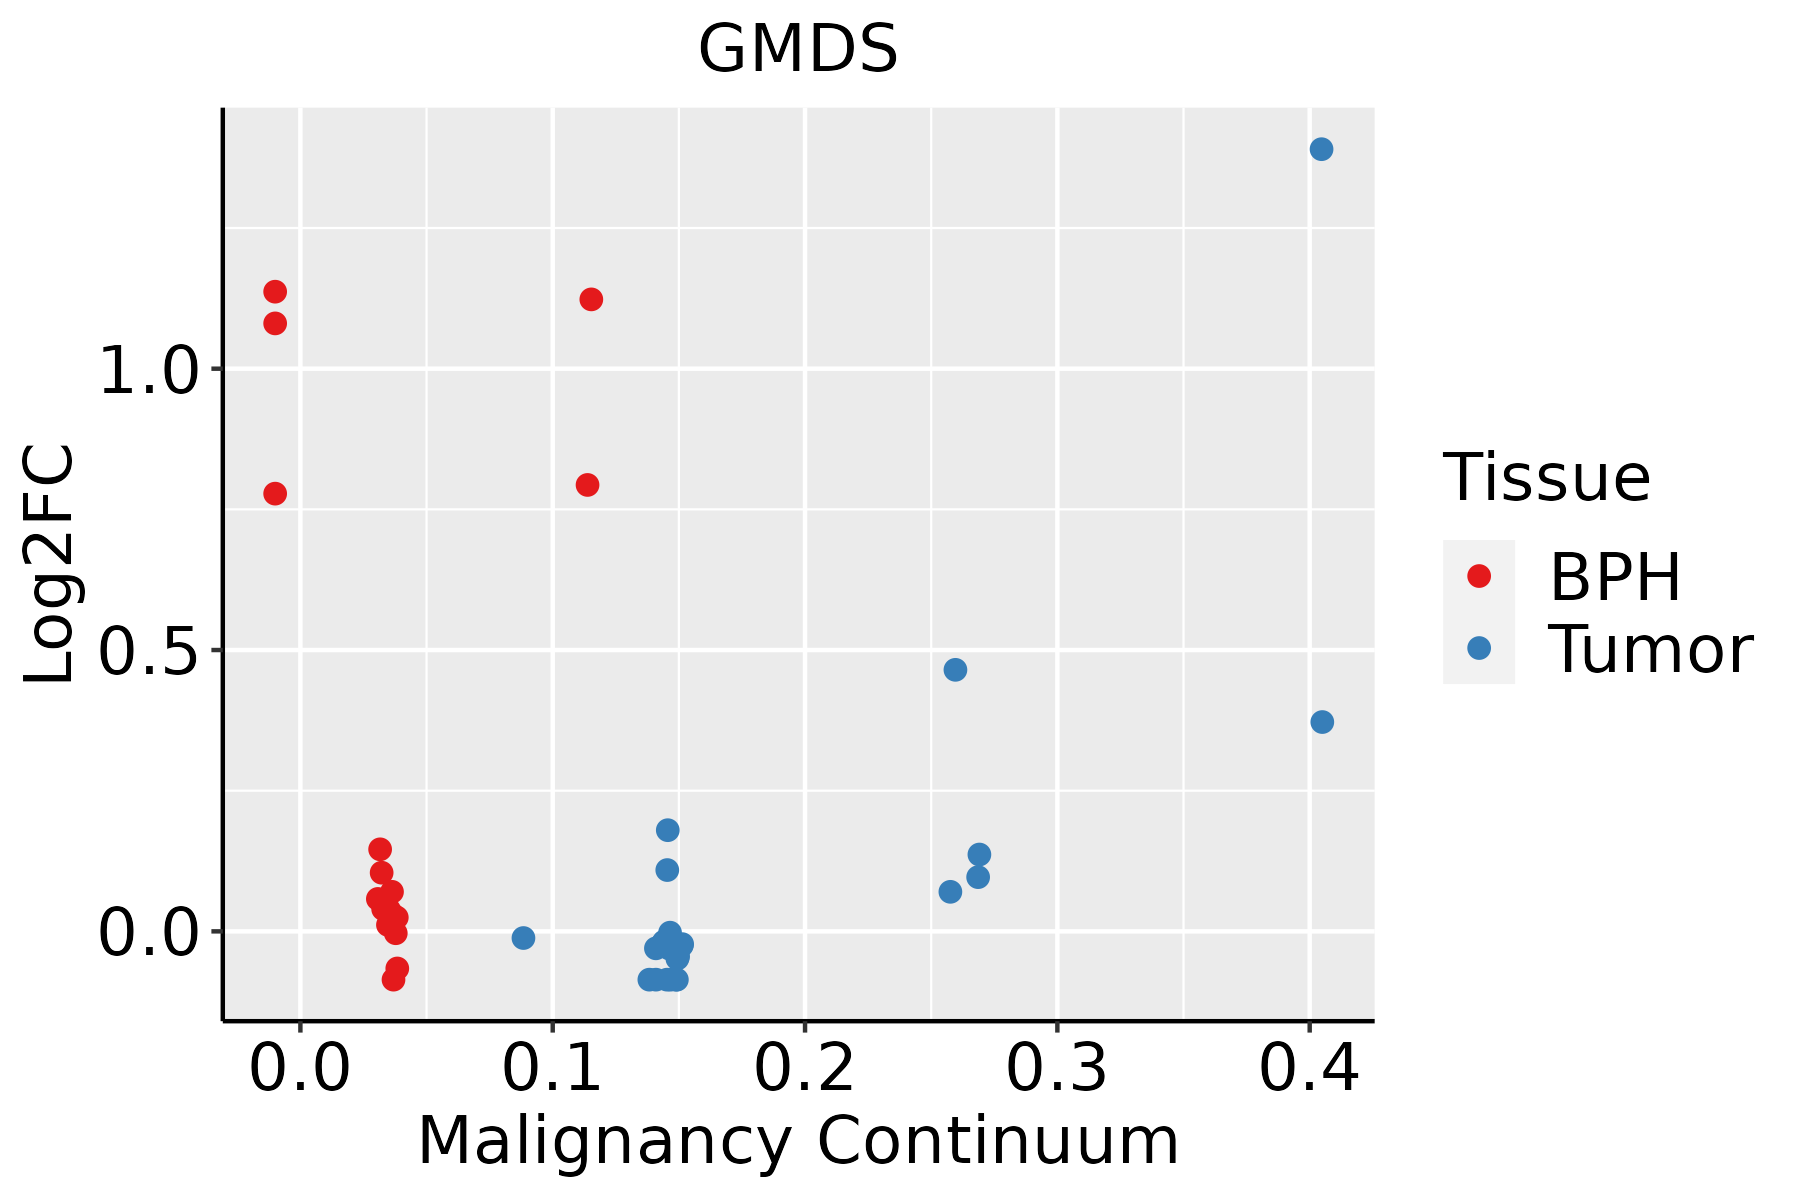 | BPH: Benign Prostatic Hyperplasia |
| Skin | 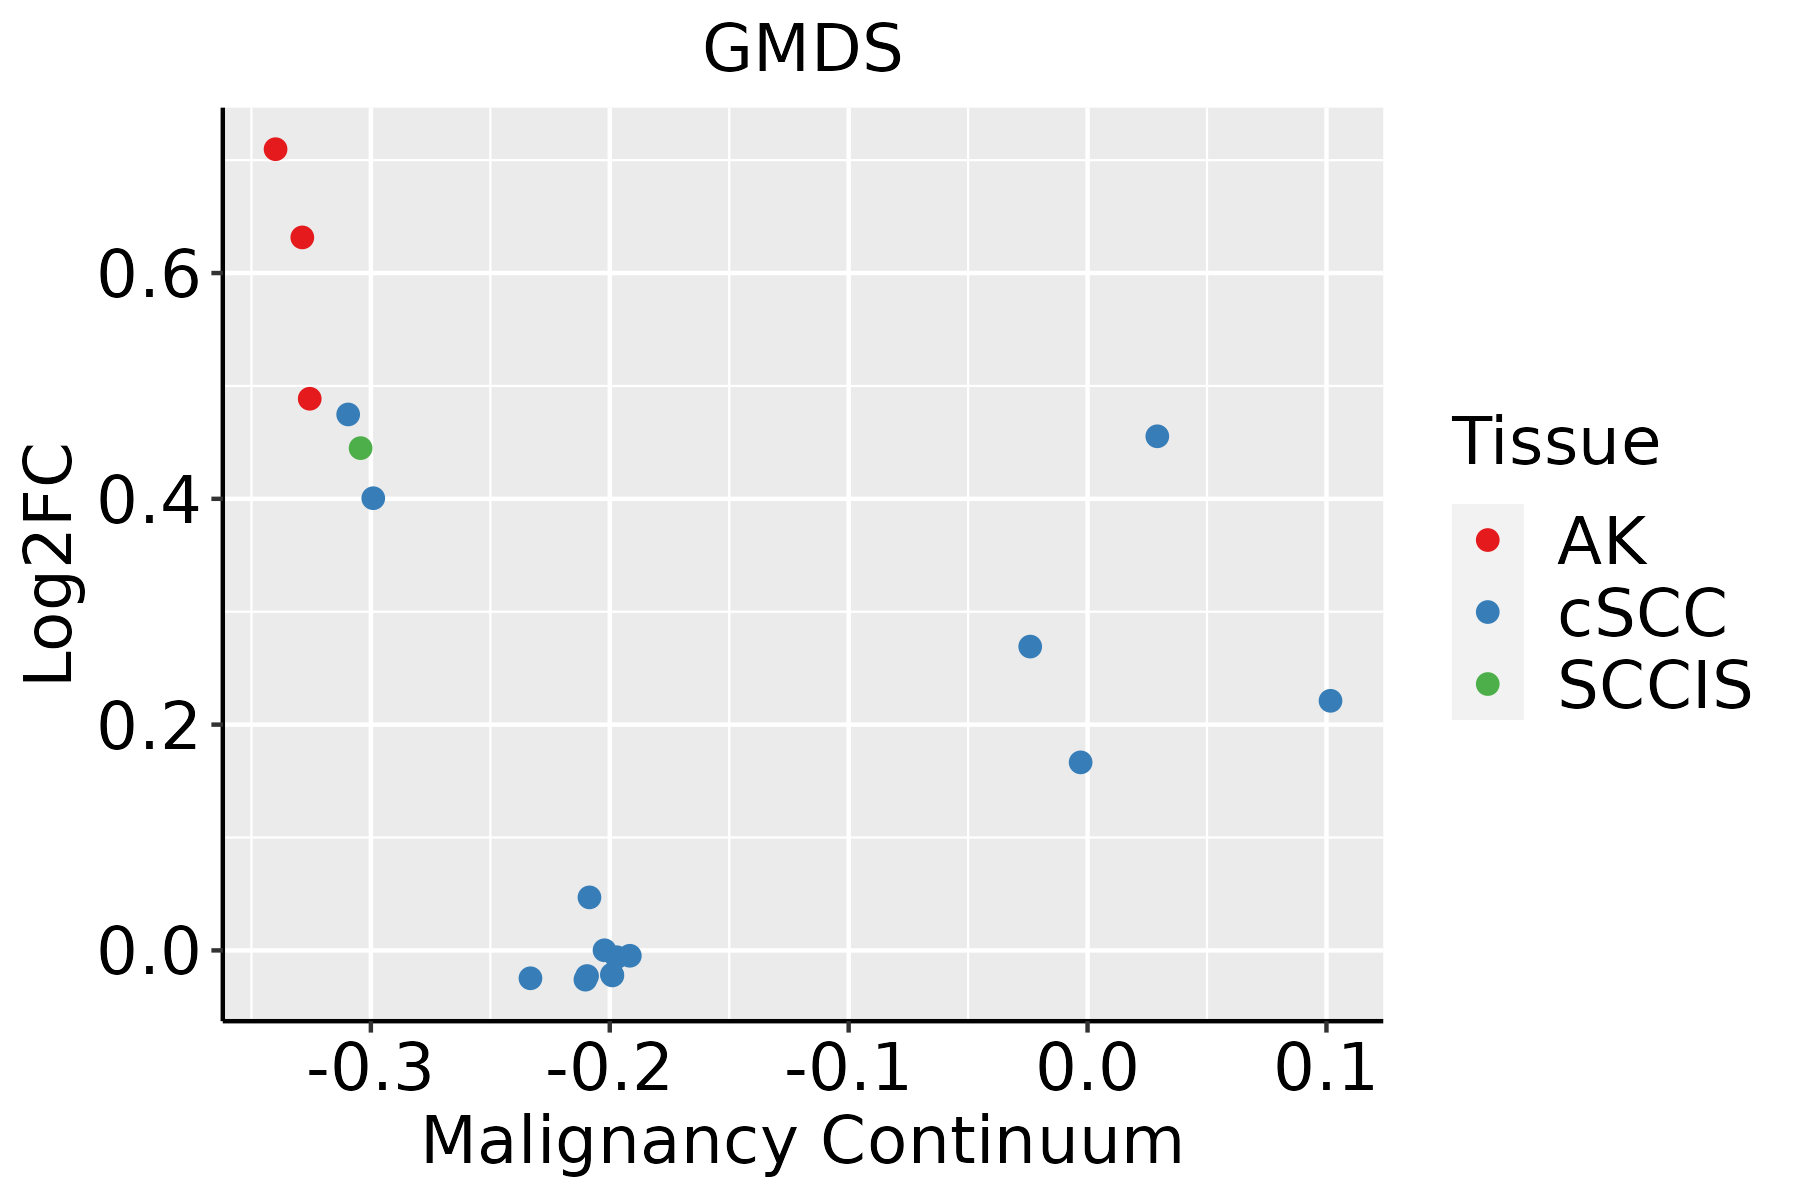 | AK: Actinic keratosis |
| cSCC: Cutaneous squamous cell carcinoma |
| SCCIS:squamous cell carcinoma in situ |
| GO ID | Tissue | Disease Stage | Description | Gene Ratio | Bg Ratio | pvalue | p.adjust | Count |
| GO:00072194 | Cervix | CC | Notch signaling pathway | 39/2311 | 172/18723 | 1.08e-04 | 1.38e-03 | 39 |
| GO:0009225 | Colorectum | AD | nucleotide-sugar metabolic process | 16/3918 | 36/18723 | 1.27e-03 | 1.12e-02 | 16 |
| GO:0007219 | Colorectum | AD | Notch signaling pathway | 50/3918 | 172/18723 | 6.92e-03 | 4.26e-02 | 50 |
| GO:00092251 | Colorectum | SER | nucleotide-sugar metabolic process | 12/2897 | 36/18723 | 6.11e-03 | 4.42e-02 | 12 |
| GO:00092252 | Colorectum | MSS | nucleotide-sugar metabolic process | 14/3467 | 36/18723 | 3.40e-03 | 2.56e-02 | 14 |
| GO:00072191 | Colorectum | FAP | Notch signaling pathway | 38/2622 | 172/18723 | 2.56e-03 | 2.01e-02 | 38 |
| GO:00072192 | Colorectum | CRC | Notch signaling pathway | 36/2078 | 172/18723 | 1.26e-04 | 2.42e-03 | 36 |
| GO:00092253 | Colorectum | CRC | nucleotide-sugar metabolic process | 10/2078 | 36/18723 | 4.68e-03 | 3.62e-02 | 10 |
| GO:00072197 | Esophagus | ESCC | Notch signaling pathway | 106/8552 | 172/18723 | 1.74e-05 | 1.55e-04 | 106 |
| GO:00092256 | Esophagus | ESCC | nucleotide-sugar metabolic process | 29/8552 | 36/18723 | 1.91e-05 | 1.67e-04 | 29 |
| GO:00092262 | Esophagus | ESCC | nucleotide-sugar biosynthetic process | 14/8552 | 19/18723 | 1.27e-02 | 4.21e-02 | 14 |
| GO:00092254 | Liver | HCC | nucleotide-sugar metabolic process | 25/7958 | 36/18723 | 9.87e-04 | 5.71e-03 | 25 |
| GO:00072193 | Lung | AIS | Notch signaling pathway | 29/1849 | 172/18723 | 2.93e-03 | 2.92e-02 | 29 |
| GO:00092255 | Oral cavity | OSCC | nucleotide-sugar metabolic process | 26/7305 | 36/18723 | 5.44e-05 | 4.51e-04 | 26 |
| GO:00072196 | Oral cavity | OSCC | Notch signaling pathway | 92/7305 | 172/18723 | 7.84e-05 | 6.08e-04 | 92 |
| GO:00092261 | Oral cavity | OSCC | nucleotide-sugar biosynthetic process | 14/7305 | 19/18723 | 2.31e-03 | 1.02e-02 | 14 |
| GO:000721921 | Oral cavity | NEOLP | Notch signaling pathway | 32/2005 | 172/18723 | 1.31e-03 | 9.48e-03 | 32 |
| GO:00072195 | Prostate | BPH | Notch signaling pathway | 41/3107 | 172/18723 | 8.95e-03 | 3.83e-02 | 41 |
| GO:000721912 | Prostate | Tumor | Notch signaling pathway | 44/3246 | 172/18723 | 4.02e-03 | 2.04e-02 | 44 |
| GO:0009226 | Prostate | Tumor | nucleotide-sugar biosynthetic process | 8/3246 | 19/18723 | 1.00e-02 | 4.20e-02 | 8 |
| Pathway ID | Tissue | Disease Stage | Description | Gene Ratio | Bg Ratio | pvalue | p.adjust | qvalue | Count |
| hsa00051 | Colorectum | AD | Fructose and mannose metabolism | 17/2092 | 34/8465 | 1.25e-03 | 8.02e-03 | 5.12e-03 | 17 |
| hsa000511 | Colorectum | AD | Fructose and mannose metabolism | 17/2092 | 34/8465 | 1.25e-03 | 8.02e-03 | 5.12e-03 | 17 |
| hsa01250 | Colorectum | FAP | Biosynthesis of nucleotide sugars | 13/1404 | 37/8465 | 4.79e-03 | 1.91e-02 | 1.16e-02 | 13 |
| hsa012501 | Colorectum | FAP | Biosynthesis of nucleotide sugars | 13/1404 | 37/8465 | 4.79e-03 | 1.91e-02 | 1.16e-02 | 13 |
| hsa012502 | Colorectum | CRC | Biosynthesis of nucleotide sugars | 12/1091 | 37/8465 | 1.66e-03 | 1.20e-02 | 8.16e-03 | 12 |
| hsa012503 | Colorectum | CRC | Biosynthesis of nucleotide sugars | 12/1091 | 37/8465 | 1.66e-03 | 1.20e-02 | 8.16e-03 | 12 |
| hsa012505 | Esophagus | ESCC | Biosynthesis of nucleotide sugars | 28/4205 | 37/8465 | 1.10e-03 | 3.42e-03 | 1.75e-03 | 28 |
| hsa005202 | Esophagus | ESCC | Amino sugar and nucleotide sugar metabolism | 35/4205 | 49/8465 | 1.60e-03 | 4.88e-03 | 2.50e-03 | 35 |
| hsa000512 | Esophagus | ESCC | Fructose and mannose metabolism | 24/4205 | 34/8465 | 1.09e-02 | 2.51e-02 | 1.29e-02 | 24 |
| hsa0125012 | Esophagus | ESCC | Biosynthesis of nucleotide sugars | 28/4205 | 37/8465 | 1.10e-03 | 3.42e-03 | 1.75e-03 | 28 |
| hsa0052011 | Esophagus | ESCC | Amino sugar and nucleotide sugar metabolism | 35/4205 | 49/8465 | 1.60e-03 | 4.88e-03 | 2.50e-03 | 35 |
| hsa0005111 | Esophagus | ESCC | Fructose and mannose metabolism | 24/4205 | 34/8465 | 1.09e-02 | 2.51e-02 | 1.29e-02 | 24 |
| hsa00520 | Oral cavity | OSCC | Amino sugar and nucleotide sugar metabolism | 34/3704 | 49/8465 | 2.48e-04 | 8.08e-04 | 4.11e-04 | 34 |
| hsa012504 | Oral cavity | OSCC | Biosynthesis of nucleotide sugars | 25/3704 | 37/8465 | 2.93e-03 | 7.49e-03 | 3.81e-03 | 25 |
| hsa005201 | Oral cavity | OSCC | Amino sugar and nucleotide sugar metabolism | 34/3704 | 49/8465 | 2.48e-04 | 8.08e-04 | 4.11e-04 | 34 |
| hsa0125011 | Oral cavity | OSCC | Biosynthesis of nucleotide sugars | 25/3704 | 37/8465 | 2.93e-03 | 7.49e-03 | 3.81e-03 | 25 |
| Hugo Symbol | Variant Class | Variant Classification | dbSNP RS | HGVSc | HGVSp | HGVSp Short | SWISSPROT | BIOTYPE | SIFT | PolyPhen | Tumor Sample Barcode | Tissue | Histology | Sex | Age | Stage | Therapy Types | Drugs | Outcome |
| GMDS | SNV | Missense_Mutation | | c.107G>C | p.Gly36Ala | p.G36A | O60547 | protein_coding | deleterious_low_confidence(0) | probably_damaging(1) | TCGA-AN-A0XV-01 | Breast | breast invasive carcinoma | Female | >=65 | III/IV | Unknown | Unknown | SD |
| GMDS | SNV | Missense_Mutation | | c.121N>C | p.Glu41Gln | p.E41Q | O60547 | protein_coding | deleterious_low_confidence(0.02) | probably_damaging(0.992) | TCGA-B6-A0RV-01 | Breast | breast invasive carcinoma | Female | <65 | III/IV | Unknown | Unknown | SD |
| GMDS | SNV | Missense_Mutation | | c.655G>C | p.Val219Leu | p.V219L | O60547 | protein_coding | deleterious_low_confidence(0) | probably_damaging(0.997) | TCGA-D8-A142-01 | Breast | breast invasive carcinoma | Female | >=65 | I/II | Chemotherapy | cyclophosphamid | SD |
| GMDS | deletion | Frame_Shift_Del | | c.166_194delNNNNNNNNNNNNNNNNNNNNNNNNNNNNN | p.Arg56Ter | p.R56* | O60547 | protein_coding | | | TCGA-AN-A0AL-01 | Breast | breast invasive carcinoma | Female | <65 | III/IV | Unknown | Unknown | SD |
| GMDS | insertion | Nonsense_Mutation | novel | c.494_495insTCAATCAATTCGATTGTCAAATAATGCACTGTTGGCATTACAAAAGTA | p.Ile165_Pro166insGlnSerIleArgLeuSerAsnAsnAlaLeuLeuAlaLeuGlnLysTer | p.I165_P166insQSIRLSNNALLALQK* | O60547 | protein_coding | | | TCGA-AN-A0FW-01 | Breast | breast invasive carcinoma | Female | >=65 | III/IV | Unknown | Unknown | SD |
| GMDS | SNV | Missense_Mutation | | c.1098G>C | p.Met366Ile | p.M366I | O60547 | protein_coding | tolerated_low_confidence(0.14) | benign(0.034) | TCGA-DR-A0ZM-01 | Cervix | cervical & endocervical cancer | Female | <65 | III/IV | Unspecific | Cisplatin | SD |
| GMDS | SNV | Missense_Mutation | rs759353627 | c.191N>A | p.Arg64Gln | p.R64Q | O60547 | protein_coding | deleterious_low_confidence(0) | probably_damaging(0.997) | TCGA-AA-A010-01 | Colorectum | colon adenocarcinoma | Female | <65 | I/II | Chemotherapy | folinic | CR |
| GMDS | SNV | Missense_Mutation | rs771650335 | c.166N>T | p.Arg56Trp | p.R56W | O60547 | protein_coding | deleterious_low_confidence(0) | probably_damaging(1) | TCGA-CM-6162-01 | Colorectum | colon adenocarcinoma | Female | <65 | III/IV | Chemotherapy | oxaliplatin | SD |
| GMDS | SNV | Missense_Mutation | rs748622436 | c.401G>A | p.Arg134Gln | p.R134Q | O60547 | protein_coding | deleterious_low_confidence(0) | probably_damaging(0.949) | TCGA-F5-6814-01 | Colorectum | rectum adenocarcinoma | Male | <65 | I/II | Unknown | Unknown | SD |
| GMDS | insertion | Nonsense_Mutation | novel | c.401_402insTTGACGGAGTTGGCACTCTACG | p.Leu135Ter | p.L135* | O60547 | protein_coding | | | TCGA-F4-6570-01 | Colorectum | colon adenocarcinoma | Female | >=65 | I/II | Unknown | Unknown | SD |


