
|
|||||
|
 | |
| |
| |
| |
| |
| |
|
Gene: GM2A |
Gene summary for GM2A |
| Gene information | Species | Human | Gene symbol | GM2A | Gene ID | 2760 |
| Gene name | GM2 ganglioside activator | |
| Gene Alias | GM2-AP | |
| Cytomap | 5q33.1 | |
| Gene Type | protein-coding | GO ID | GO:0001573 | UniProtAcc | P17900 |
Top |
Malignant transformation analysis |
| Identification of the aberrant gene expression in precancerous and cancerous lesions by comparing the gene expression of stem-like cells in diseased tissues with normal stem cells |
| Entrez ID | Symbol | Replicates | Species | Organ | Tissue | Adj P-value | Log2FC | Malignancy |
| 2760 | GM2A | LZE2T | Human | Esophagus | ESCC | 2.46e-08 | 7.90e-01 | 0.082 |
| 2760 | GM2A | LZE4T | Human | Esophagus | ESCC | 1.40e-10 | 3.10e-01 | 0.0811 |
| 2760 | GM2A | LZE8T | Human | Esophagus | ESCC | 2.42e-07 | 2.66e-01 | 0.067 |
| 2760 | GM2A | LZE24T | Human | Esophagus | ESCC | 5.21e-17 | 7.59e-01 | 0.0596 |
| 2760 | GM2A | LZE21T | Human | Esophagus | ESCC | 3.99e-08 | 5.00e-01 | 0.0655 |
| 2760 | GM2A | P2T-E | Human | Esophagus | ESCC | 2.16e-18 | 4.71e-01 | 0.1177 |
| 2760 | GM2A | P4T-E | Human | Esophagus | ESCC | 7.55e-28 | 7.76e-01 | 0.1323 |
| 2760 | GM2A | P5T-E | Human | Esophagus | ESCC | 5.80e-27 | 5.66e-01 | 0.1327 |
| 2760 | GM2A | P8T-E | Human | Esophagus | ESCC | 1.03e-06 | 9.71e-02 | 0.0889 |
| 2760 | GM2A | P9T-E | Human | Esophagus | ESCC | 2.15e-14 | 1.87e-01 | 0.1131 |
| 2760 | GM2A | P10T-E | Human | Esophagus | ESCC | 2.75e-11 | 7.55e-02 | 0.116 |
| 2760 | GM2A | P11T-E | Human | Esophagus | ESCC | 7.45e-17 | 1.23e+00 | 0.1426 |
| 2760 | GM2A | P12T-E | Human | Esophagus | ESCC | 9.78e-18 | 6.12e-01 | 0.1122 |
| 2760 | GM2A | P15T-E | Human | Esophagus | ESCC | 1.23e-28 | 8.86e-01 | 0.1149 |
| 2760 | GM2A | P16T-E | Human | Esophagus | ESCC | 1.03e-14 | 1.22e-01 | 0.1153 |
| 2760 | GM2A | P17T-E | Human | Esophagus | ESCC | 1.77e-08 | 5.98e-01 | 0.1278 |
| 2760 | GM2A | P20T-E | Human | Esophagus | ESCC | 1.59e-28 | 8.43e-01 | 0.1124 |
| 2760 | GM2A | P21T-E | Human | Esophagus | ESCC | 2.72e-43 | 9.31e-01 | 0.1617 |
| 2760 | GM2A | P22T-E | Human | Esophagus | ESCC | 2.03e-36 | 6.15e-01 | 0.1236 |
| 2760 | GM2A | P23T-E | Human | Esophagus | ESCC | 1.28e-19 | 6.76e-01 | 0.108 |
| Page: 1 2 3 4 5 |
| Tissue | Expression Dynamics | Abbreviation |
| Esophagus |  | ESCC: Esophageal squamous cell carcinoma |
| HGIN: High-grade intraepithelial neoplasias | ||
| LGIN: Low-grade intraepithelial neoplasias | ||
| Liver | 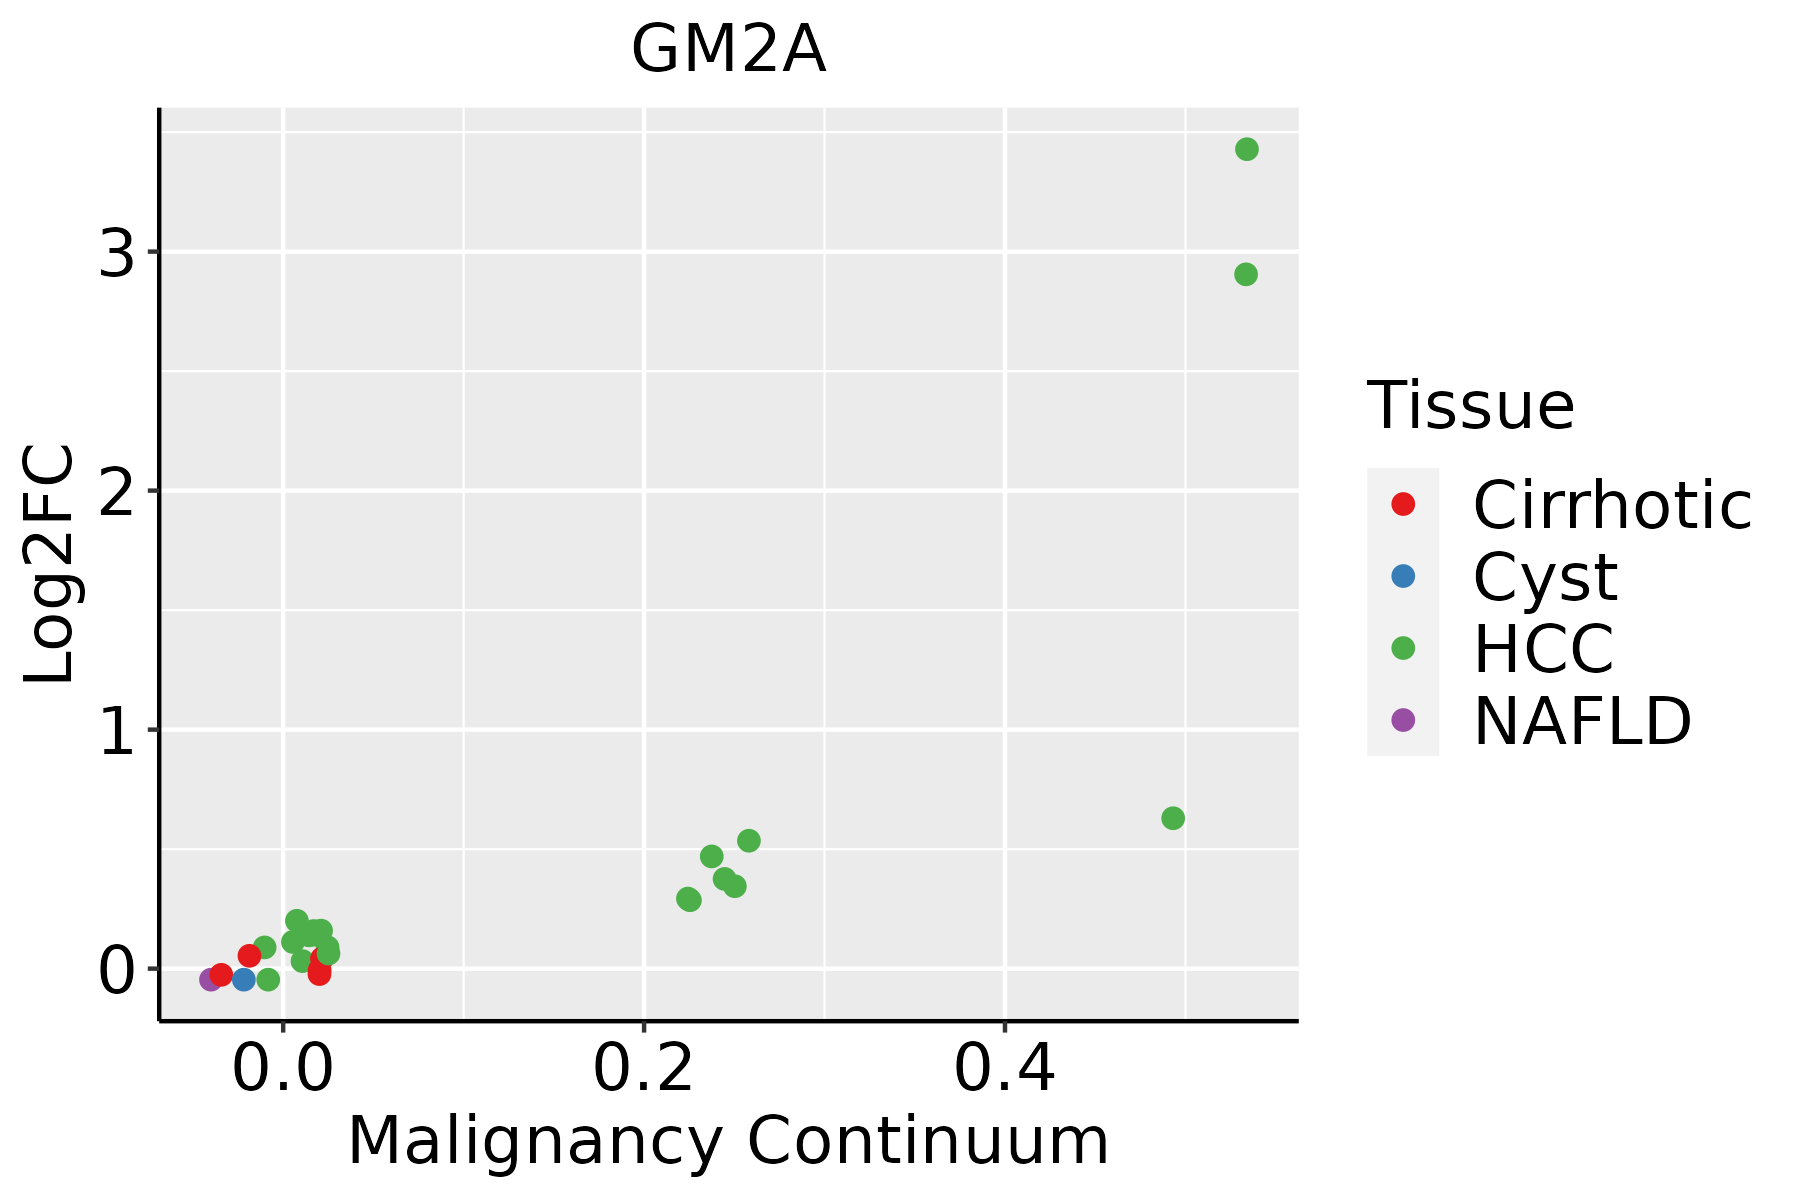 | HCC: Hepatocellular carcinoma |
| NAFLD: Non-alcoholic fatty liver disease | ||
| Oral Cavity | 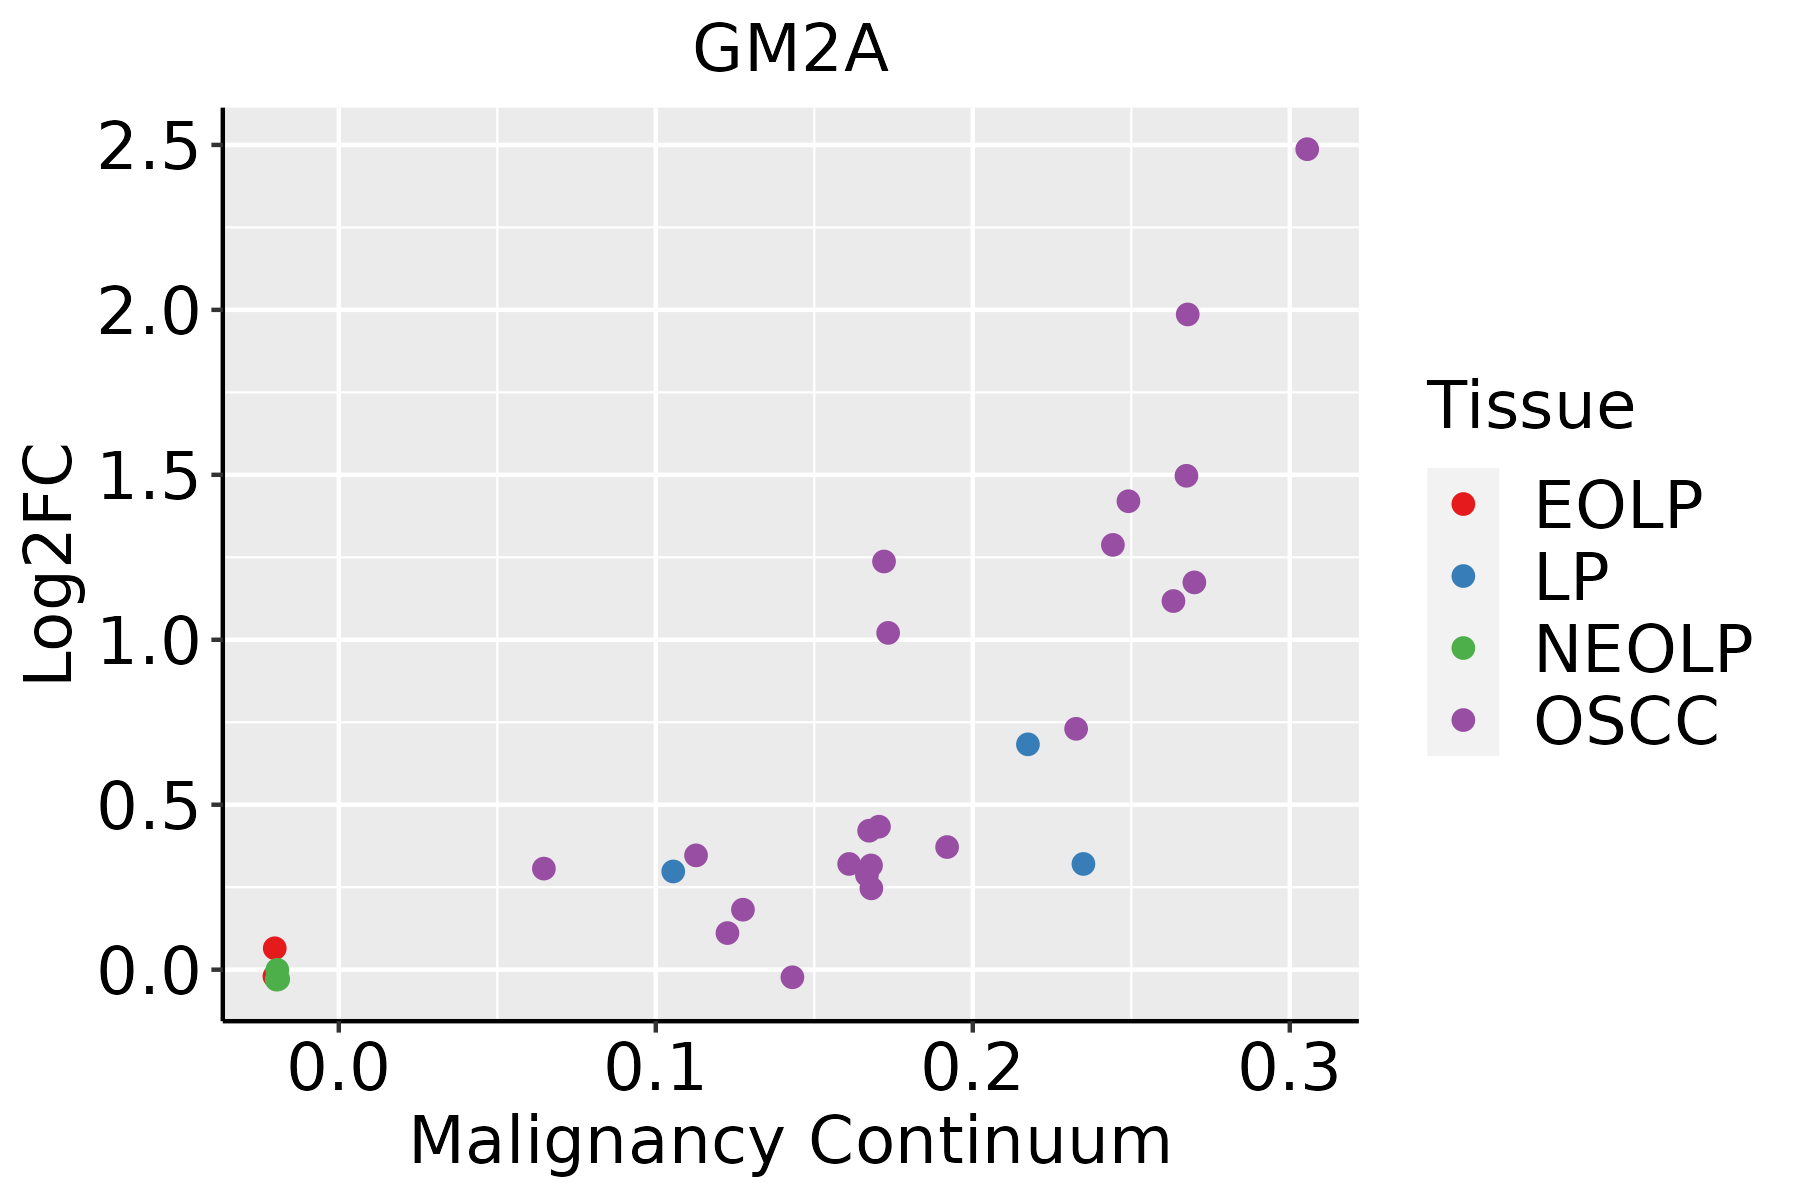 | EOLP: Erosive Oral lichen planus |
| LP: leukoplakia | ||
| NEOLP: Non-erosive oral lichen planus | ||
| OSCC: Oral squamous cell carcinoma | ||
| Skin |  | AK: Actinic keratosis |
| cSCC: Cutaneous squamous cell carcinoma | ||
| SCCIS:squamous cell carcinoma in situ |
| ∗log2FC in expression of this searched gene in stem-like cells from each diseased tissue sample relative to stem-like cells in normal samples in each tissue plotted against the malignancy continuum. Samples are colored based on if they are from different disease stage. |
Top |
Malignant transformation related pathway analysis |
| Find out the enriched GO biological processes and KEGG pathways involved in transition from healthy to precancer to cancer |
| Tissue | Disease Stage | Enriched GO biological Processes |
| Colorectum | AD |  |
| Colorectum | SER |  |
| Colorectum | MSS |  |
| Colorectum | MSI-H |  |
| Colorectum | FAP |  |
| ∗Top 15 enriched GO BP terms are showed in the bar plot of each disease state in each tissue. Each row represents a significant GO biological process which is colored according to the -log10(p.adjust). |
| Page: 1 2 3 4 5 6 7 8 9 |
| GO ID | Tissue | Disease Stage | Description | Gene Ratio | Bg Ratio | pvalue | p.adjust | Count |
| GO:0051235110 | Esophagus | ESCC | maintenance of location | 200/8552 | 327/18723 | 1.01e-08 | 2.02e-07 | 200 |
| GO:00066433 | Esophagus | ESCC | membrane lipid metabolic process | 130/8552 | 203/18723 | 9.29e-08 | 1.54e-06 | 130 |
| GO:00066652 | Esophagus | ESCC | sphingolipid metabolic process | 96/8552 | 155/18723 | 3.21e-05 | 2.66e-04 | 96 |
| GO:00199155 | Esophagus | ESCC | lipid storage | 58/8552 | 87/18723 | 6.15e-05 | 4.72e-04 | 58 |
| GO:00066642 | Esophagus | ESCC | glycolipid metabolic process | 63/8552 | 100/18723 | 3.55e-04 | 2.06e-03 | 63 |
| GO:19035092 | Esophagus | ESCC | liposaccharide metabolic process | 63/8552 | 101/18723 | 5.25e-04 | 2.90e-03 | 63 |
| GO:001605216 | Esophagus | ESCC | carbohydrate catabolic process | 91/8552 | 154/18723 | 5.39e-04 | 2.97e-03 | 91 |
| GO:00442427 | Esophagus | ESCC | cellular lipid catabolic process | 121/8552 | 214/18723 | 8.63e-04 | 4.43e-03 | 121 |
| GO:19011362 | Esophagus | ESCC | carbohydrate derivative catabolic process | 99/8552 | 172/18723 | 1.11e-03 | 5.54e-03 | 99 |
| GO:00066721 | Esophagus | ESCC | ceramide metabolic process | 61/8552 | 102/18723 | 2.82e-03 | 1.19e-02 | 61 |
| GO:00160427 | Esophagus | ESCC | lipid catabolic process | 168/8552 | 320/18723 | 7.97e-03 | 2.84e-02 | 168 |
| GO:004424222 | Liver | HCC | cellular lipid catabolic process | 134/7958 | 214/18723 | 2.07e-09 | 5.79e-08 | 134 |
| GO:001605222 | Liver | HCC | carbohydrate catabolic process | 99/7958 | 154/18723 | 3.79e-08 | 8.30e-07 | 99 |
| GO:005123521 | Liver | HCC | maintenance of location | 185/7958 | 327/18723 | 1.70e-07 | 3.12e-06 | 185 |
| GO:001604221 | Liver | HCC | lipid catabolic process | 175/7958 | 320/18723 | 6.50e-06 | 7.88e-05 | 175 |
| GO:00066431 | Liver | HCC | membrane lipid metabolic process | 115/7958 | 203/18723 | 3.17e-05 | 3.22e-04 | 115 |
| GO:1901136 | Liver | HCC | carbohydrate derivative catabolic process | 98/7958 | 172/18723 | 8.71e-05 | 7.62e-04 | 98 |
| GO:001087621 | Liver | HCC | lipid localization | 228/7958 | 448/18723 | 1.80e-04 | 1.41e-03 | 228 |
| GO:00199152 | Liver | HCC | lipid storage | 53/7958 | 87/18723 | 4.01e-04 | 2.71e-03 | 53 |
| GO:0006665 | Liver | HCC | sphingolipid metabolic process | 85/7958 | 155/18723 | 1.27e-03 | 6.92e-03 | 85 |
| Page: 1 2 |
| Pathway ID | Tissue | Disease Stage | Description | Gene Ratio | Bg Ratio | pvalue | p.adjust | qvalue | Count |
| hsa0414222 | Esophagus | ESCC | Lysosome | 102/4205 | 132/8465 | 5.11e-11 | 7.13e-10 | 3.65e-10 | 102 |
| hsa0414232 | Esophagus | ESCC | Lysosome | 102/4205 | 132/8465 | 5.11e-11 | 7.13e-10 | 3.65e-10 | 102 |
| hsa041422 | Liver | HCC | Lysosome | 100/4020 | 132/8465 | 2.32e-11 | 4.31e-10 | 2.40e-10 | 100 |
| hsa041423 | Liver | HCC | Lysosome | 100/4020 | 132/8465 | 2.32e-11 | 4.31e-10 | 2.40e-10 | 100 |
| hsa041425 | Oral cavity | OSCC | Lysosome | 87/3704 | 132/8465 | 1.97e-07 | 1.35e-06 | 6.86e-07 | 87 |
| hsa0414212 | Oral cavity | OSCC | Lysosome | 87/3704 | 132/8465 | 1.97e-07 | 1.35e-06 | 6.86e-07 | 87 |
| hsa0414221 | Oral cavity | LP | Lysosome | 67/2418 | 132/8465 | 5.13e-08 | 7.77e-07 | 5.01e-07 | 67 |
| hsa0414231 | Oral cavity | LP | Lysosome | 67/2418 | 132/8465 | 5.13e-08 | 7.77e-07 | 5.01e-07 | 67 |
| Page: 1 |
Top |
Cell-cell communication analysis |
| Identification of potential cell-cell interactions between two cell types and their ligand-receptor pairs for different disease states |
| Ligand | Receptor | LRpair | Pathway | Tissue | Disease Stage |
| Page: 1 |
Top |
Single-cell gene regulatory network inference analysis |
| Find out the significant the regulons (TFs) and the target genes of each regulon across cell types for different disease states |
| TF | Cell Type | Tissue | Disease Stage | Target Gene | RSS | Regulon Activity |
| ∗The dot plots of a searched regulon are shown for all cell subpopulations in each disease state of each tissue based on the regulon specific score inferred using pySCENIC and by calculating the average expression. |
| Page: 1 |
Top |
Somatic mutation of malignant transformation related genes |
| Annotation of somatic variants for genes involved in malignant transformation |
| Hugo Symbol | Variant Class | Variant Classification | dbSNP RS | HGVSc | HGVSp | HGVSp Short | SWISSPROT | BIOTYPE | SIFT | PolyPhen | Tumor Sample Barcode | Tissue | Histology | Sex | Age | Stage | Therapy Types | Drugs | Outcome |
| GM2A | SNV | Missense_Mutation | c.472N>A | p.Glu158Lys | p.E158K | P17900 | protein_coding | tolerated(0.07) | benign(0.079) | TCGA-D8-A1J8-01 | Breast | breast invasive carcinoma | Female | >=65 | I/II | Hormone Therapy | nolvadex | SD | |
| GM2A | SNV | Missense_Mutation | novel | c.545G>A | p.Gly182Asp | p.G182D | P17900 | protein_coding | deleterious(0) | probably_damaging(0.94) | TCGA-2W-A8YY-01 | Cervix | cervical & endocervical cancer | Female | <65 | I/II | Chemotherapy | cisplatin | CR |
| GM2A | SNV | Missense_Mutation | c.37C>A | p.Leu13Met | p.L13M | P17900 | protein_coding | deleterious(0.02) | probably_damaging(0.98) | TCGA-AA-3864-01 | Colorectum | colon adenocarcinoma | Male | >=65 | I/II | Unknown | Unknown | SD | |
| GM2A | SNV | Missense_Mutation | c.23C>A | p.Pro8His | p.P8H | P17900 | protein_coding | deleterious(0.02) | possibly_damaging(0.726) | TCGA-AD-A5EJ-01 | Colorectum | colon adenocarcinoma | Female | >=65 | I/II | Unknown | Unknown | SD | |
| GM2A | SNV | Missense_Mutation | rs761084552 | c.388N>T | p.Arg130Cys | p.R130C | P17900 | protein_coding | deleterious(0.03) | possibly_damaging(0.603) | TCGA-AG-A015-01 | Colorectum | rectum adenocarcinoma | Female | <65 | I/II | Unknown | Unknown | PD |
| GM2A | SNV | Missense_Mutation | novel | c.76N>G | p.Lys26Glu | p.K26E | P17900 | protein_coding | tolerated(0.76) | benign(0.003) | TCGA-A5-A2K5-01 | Endometrium | uterine corpus endometrioid carcinoma | Female | >=65 | I/II | Unknown | Unknown | SD |
| GM2A | SNV | Missense_Mutation | rs751291017 | c.575N>A | p.Gly192Asp | p.G192D | P17900 | protein_coding | deleterious(0) | probably_damaging(0.965) | TCGA-AJ-A3BH-01 | Endometrium | uterine corpus endometrioid carcinoma | Female | Unknown | I/II | Unknown | Unknown | SD |
| GM2A | SNV | Missense_Mutation | novel | c.316N>C | p.Cys106Arg | p.C106R | P17900 | protein_coding | deleterious(0) | probably_damaging(1) | TCGA-AP-A054-01 | Endometrium | uterine corpus endometrioid carcinoma | Female | <65 | III/IV | Chemotherapy | carboplatin | PD |
| GM2A | SNV | Missense_Mutation | rs761268810 | c.137N>T | p.Ala46Val | p.A46V | P17900 | protein_coding | tolerated(0.7) | benign(0.022) | TCGA-AX-A0IZ-01 | Endometrium | uterine corpus endometrioid carcinoma | Female | <65 | I/II | Unknown | Unknown | SD |
| GM2A | SNV | Missense_Mutation | c.220N>A | p.Val74Ile | p.V74I | P17900 | protein_coding | tolerated(0.17) | benign(0.009) | TCGA-AX-A0J1-01 | Endometrium | uterine corpus endometrioid carcinoma | Female | >=65 | I/II | Unknown | Unknown | SD |
| Page: 1 2 |
Top |
Related drugs of malignant transformation related genes |
| Identification of chemicals and drugs interact with genes involved in malignant transfromation |
| (DGIdb 4.0) |
| Entrez ID | Symbol | Category | Interaction Types | Drug Claim Name | Drug Name | PMIDs |
| 2760 | GM2A | ENZYME | BIW-8962 | BIW-8962 |
| Page: 1 |

Copyright 2023-Present -The University of Texas Health Science Center at Houston |