
|
|||||
|
 | |
| |
| |
| |
| |
| |
|
Gene: GLTSCR2 |
Gene summary for GLTSCR2 |
| Gene information | Species | Human | Gene symbol | GLTSCR2 | Gene ID | 29997 |
| Gene name | NOP53 ribosome biogenesis factor | |
| Gene Alias | GLTSCR2 | |
| Cytomap | 19q13.33 | |
| Gene Type | protein-coding | GO ID | GO:0000027 | UniProtAcc | Q9NZM5 |
Top |
Malignant transformation analysis |
| Identification of the aberrant gene expression in precancerous and cancerous lesions by comparing the gene expression of stem-like cells in diseased tissues with normal stem cells |
| Entrez ID | Symbol | Replicates | Species | Organ | Tissue | Adj P-value | Log2FC | Malignancy |
| 29997 | GLTSCR2 | GSM4909280 | Human | Breast | Precancer | 6.23e-04 | -5.85e-01 | 0.0305 |
| 29997 | GLTSCR2 | GSM4909281 | Human | Breast | IDC | 2.34e-26 | -5.85e-01 | 0.21 |
| 29997 | GLTSCR2 | GSM4909282 | Human | Breast | IDC | 5.65e-26 | -5.85e-01 | -0.0288 |
| 29997 | GLTSCR2 | GSM4909285 | Human | Breast | IDC | 2.34e-26 | -5.85e-01 | 0.21 |
| 29997 | GLTSCR2 | GSM4909286 | Human | Breast | IDC | 9.66e-27 | -5.85e-01 | 0.1081 |
| 29997 | GLTSCR2 | GSM4909287 | Human | Breast | IDC | 7.49e-30 | -5.85e-01 | 0.2057 |
| 29997 | GLTSCR2 | GSM4909288 | Human | Breast | IDC | 6.35e-08 | -5.85e-01 | 0.0988 |
| 29997 | GLTSCR2 | GSM4909289 | Human | Breast | IDC | 7.79e-06 | -5.85e-01 | 0.1064 |
| 29997 | GLTSCR2 | GSM4909290 | Human | Breast | IDC | 8.84e-22 | -5.85e-01 | 0.2096 |
| 29997 | GLTSCR2 | GSM4909291 | Human | Breast | IDC | 6.75e-18 | -5.85e-01 | 0.1753 |
| 29997 | GLTSCR2 | GSM4909292 | Human | Breast | IDC | 7.22e-03 | -5.85e-01 | 0.1236 |
| 29997 | GLTSCR2 | GSM4909293 | Human | Breast | IDC | 5.65e-26 | -5.85e-01 | 0.1581 |
| 29997 | GLTSCR2 | GSM4909294 | Human | Breast | IDC | 3.98e-27 | -5.85e-01 | 0.2022 |
| 29997 | GLTSCR2 | GSM4909295 | Human | Breast | IDC | 2.51e-14 | -5.85e-01 | 0.0898 |
| 29997 | GLTSCR2 | GSM4909296 | Human | Breast | IDC | 9.66e-27 | -5.85e-01 | 0.1524 |
| 29997 | GLTSCR2 | GSM4909297 | Human | Breast | IDC | 4.52e-29 | -5.85e-01 | 0.1517 |
| 29997 | GLTSCR2 | GSM4909298 | Human | Breast | IDC | 9.66e-27 | -5.85e-01 | 0.1551 |
| 29997 | GLTSCR2 | GSM4909299 | Human | Breast | IDC | 5.65e-26 | -5.85e-01 | 0.035 |
| 29997 | GLTSCR2 | GSM4909300 | Human | Breast | IDC | 8.73e-13 | -5.85e-01 | 0.0334 |
| 29997 | GLTSCR2 | GSM4909301 | Human | Breast | IDC | 1.63e-27 | -5.85e-01 | 0.1577 |
| Page: 1 2 3 4 5 6 7 8 9 10 11 12 13 14 |
| Tissue | Expression Dynamics | Abbreviation |
| Breast | 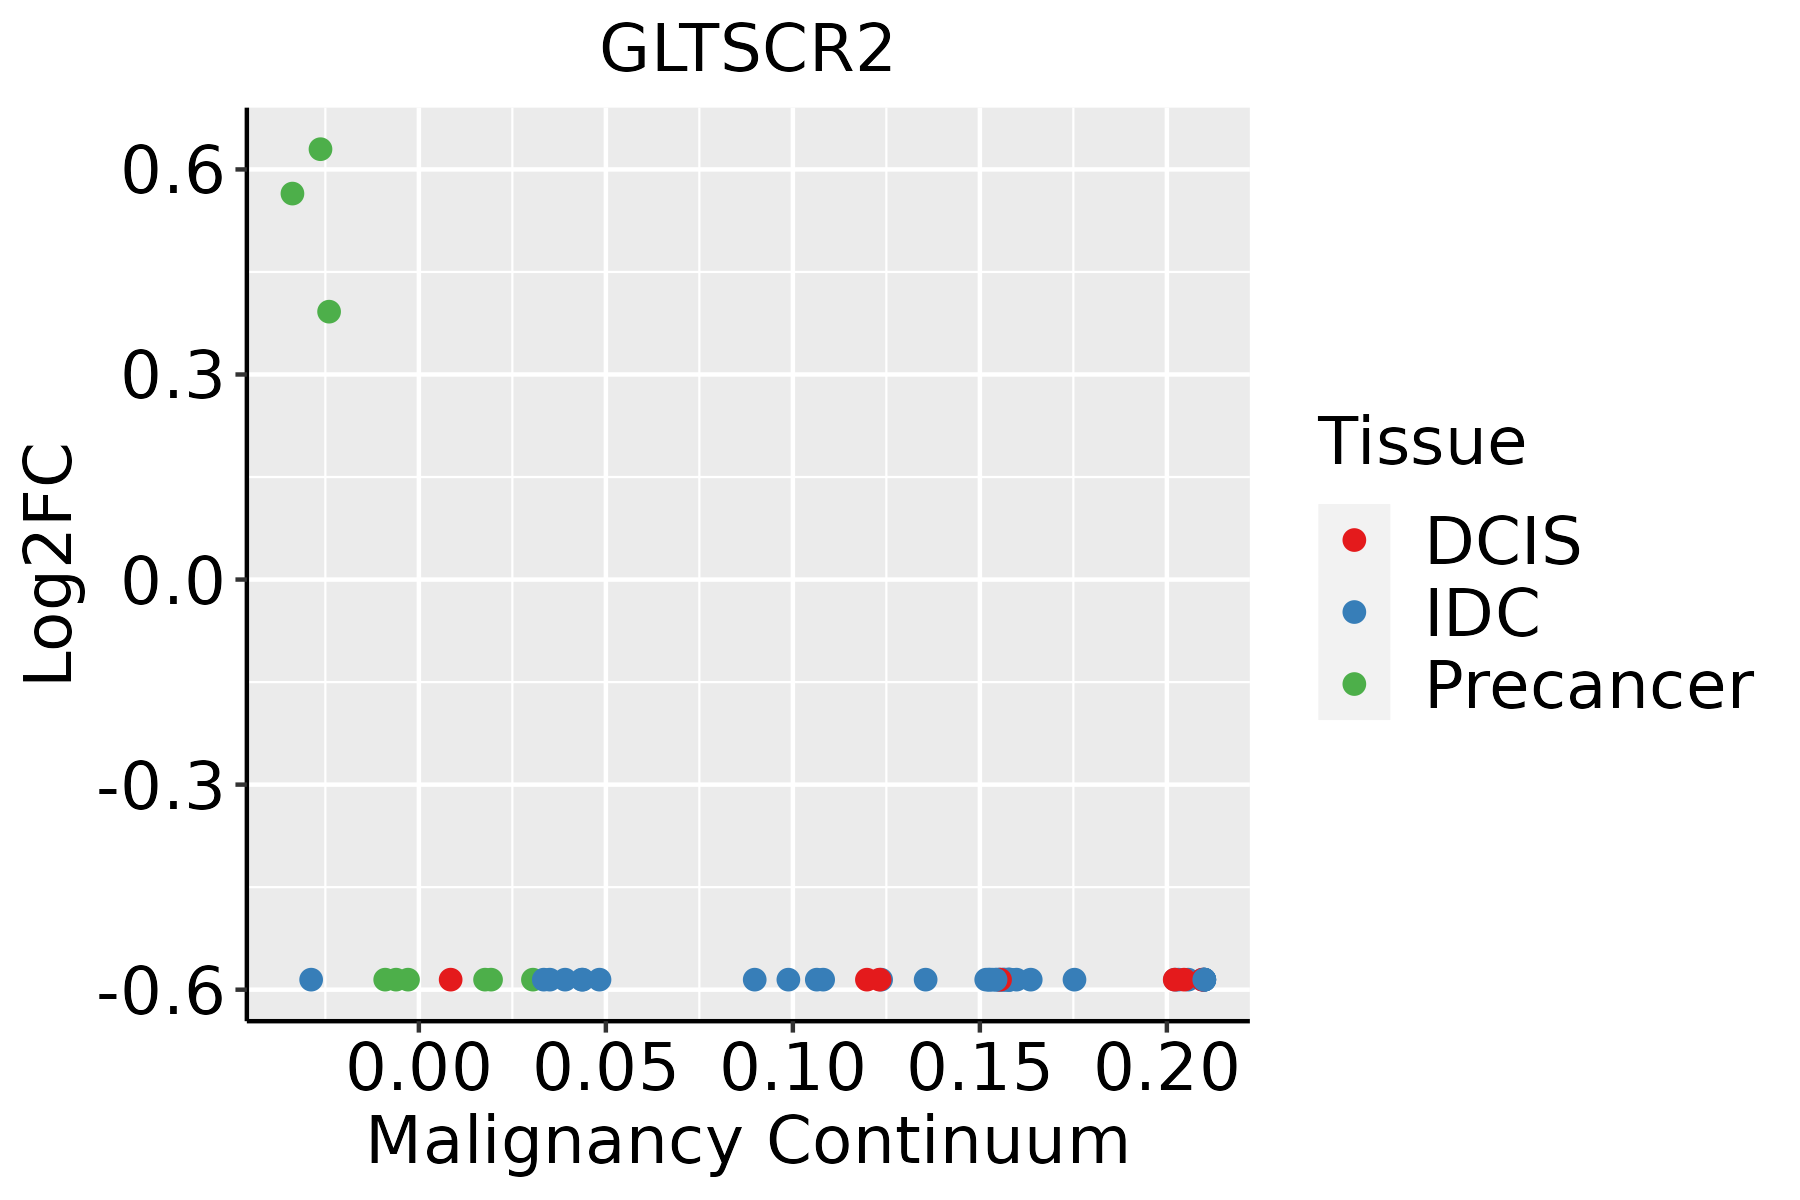 | IDC: Invasive ductal carcinoma |
| DCIS: Ductal carcinoma in situ | ||
| Precancer(BRCA1-mut): Precancerous lesion from BRCA1 mutation carriers | ||
| Colorectum (GSE201348) |  | FAP: Familial adenomatous polyposis |
| CRC: Colorectal cancer | ||
| Colorectum (HTA11) |  | AD: Adenomas |
| SER: Sessile serrated lesions | ||
| MSI-H: Microsatellite-high colorectal cancer | ||
| MSS: Microsatellite stable colorectal cancer | ||
| Endometrium | 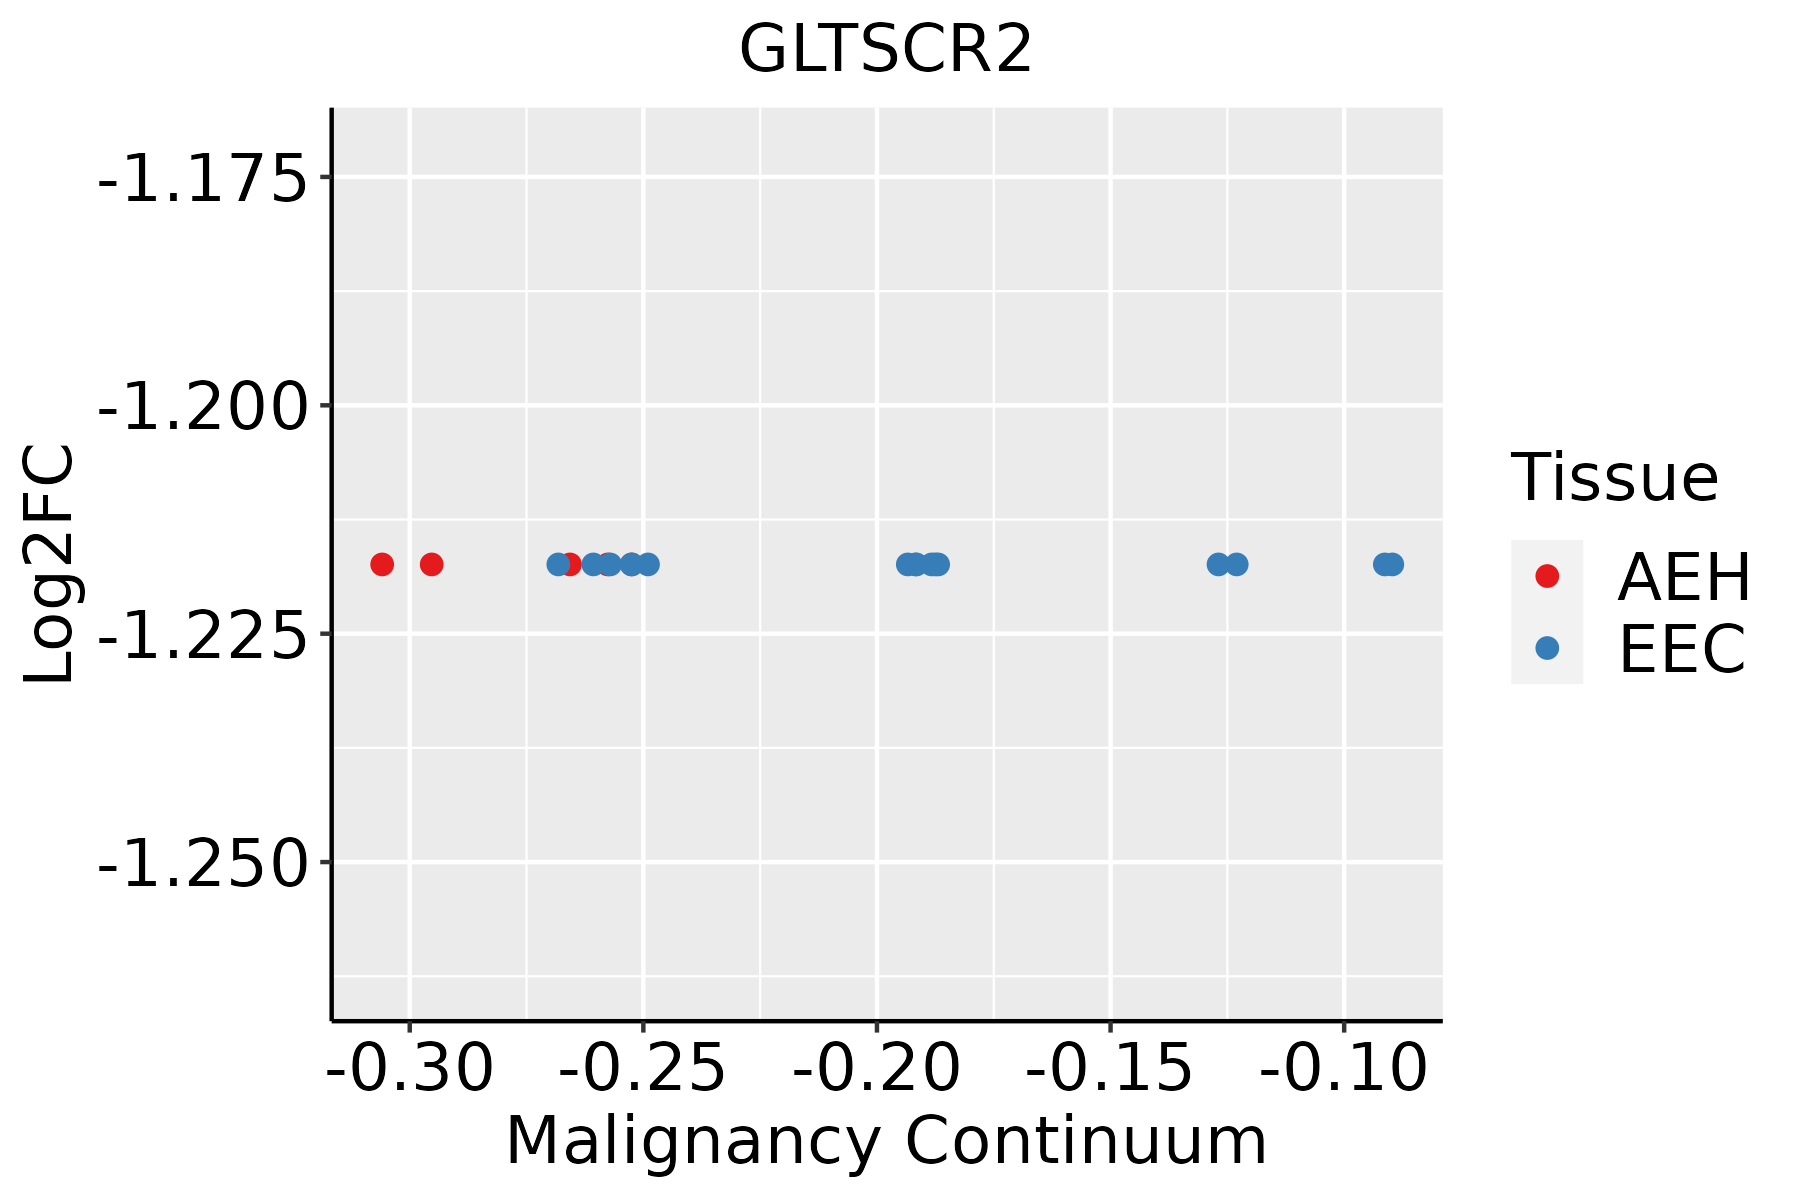 | AEH: Atypical endometrial hyperplasia |
| EEC: Endometrioid Cancer | ||
| Esophagus | 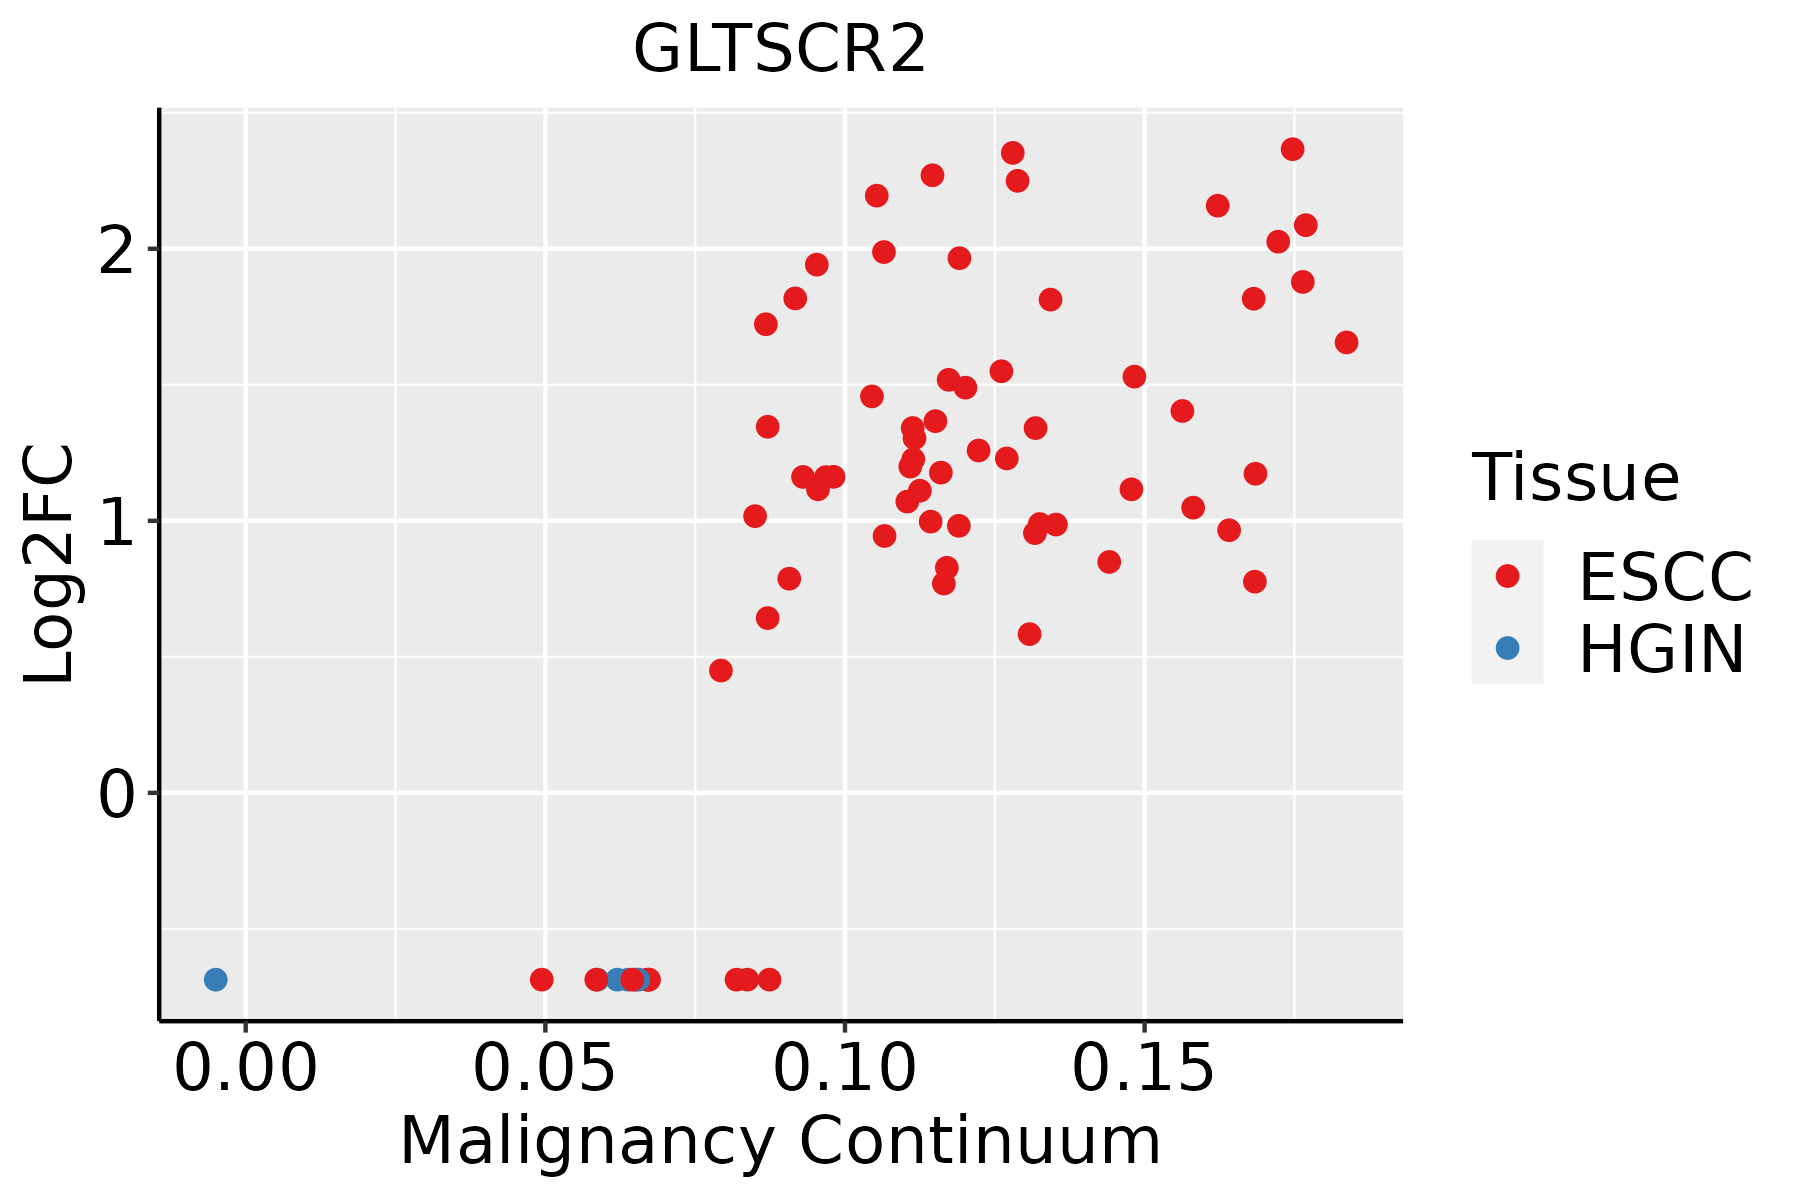 | ESCC: Esophageal squamous cell carcinoma |
| HGIN: High-grade intraepithelial neoplasias | ||
| LGIN: Low-grade intraepithelial neoplasias | ||
| GC | 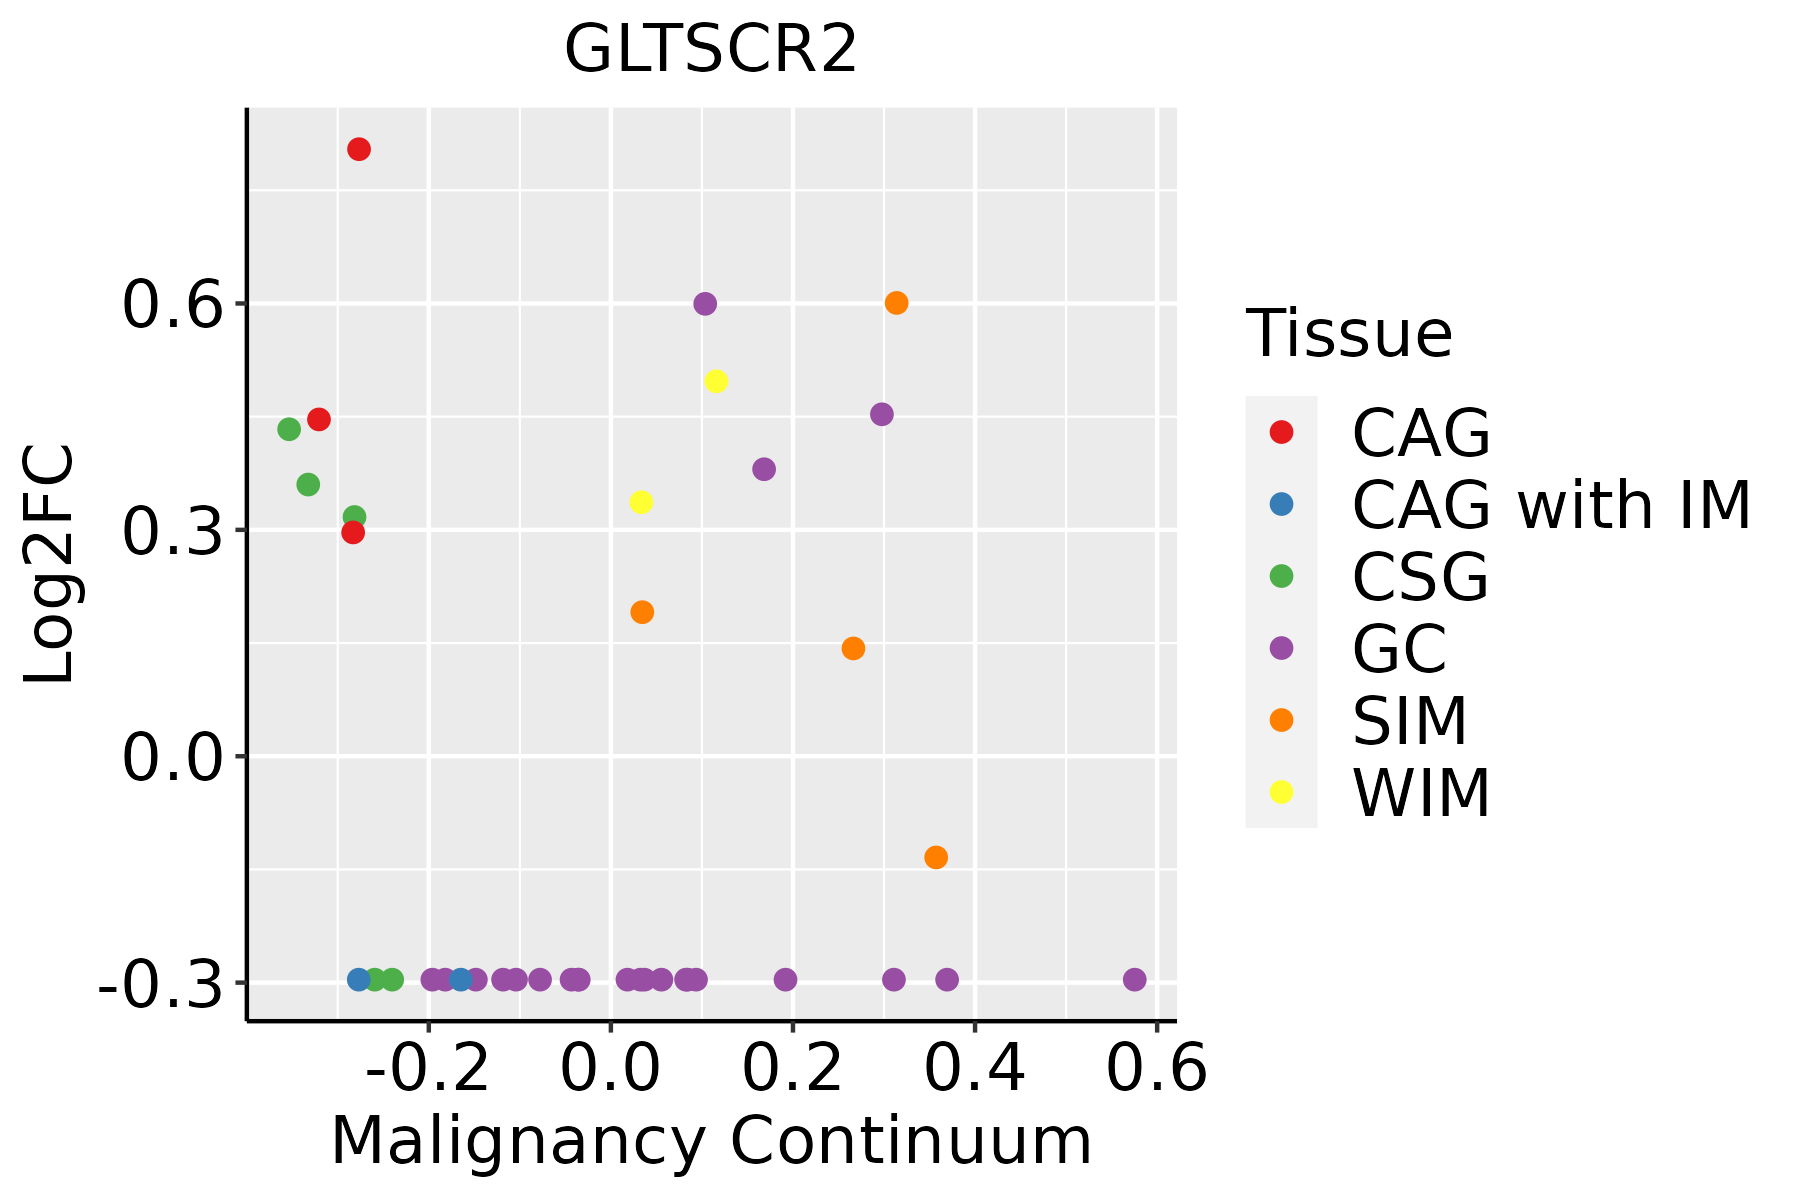 | CAG: Chronic atrophic gastritis |
| CAG with IM: Chronic atrophic gastritis with intestinal metaplasia | ||
| CSG: Chronic superficial gastritis | ||
| GC: Gastric cancer | ||
| SIM: Severe intestinal metaplasia | ||
| WIM: Wild intestinal metaplasia | ||
| Liver |  | HCC: Hepatocellular carcinoma |
| NAFLD: Non-alcoholic fatty liver disease | ||
| Oral Cavity | 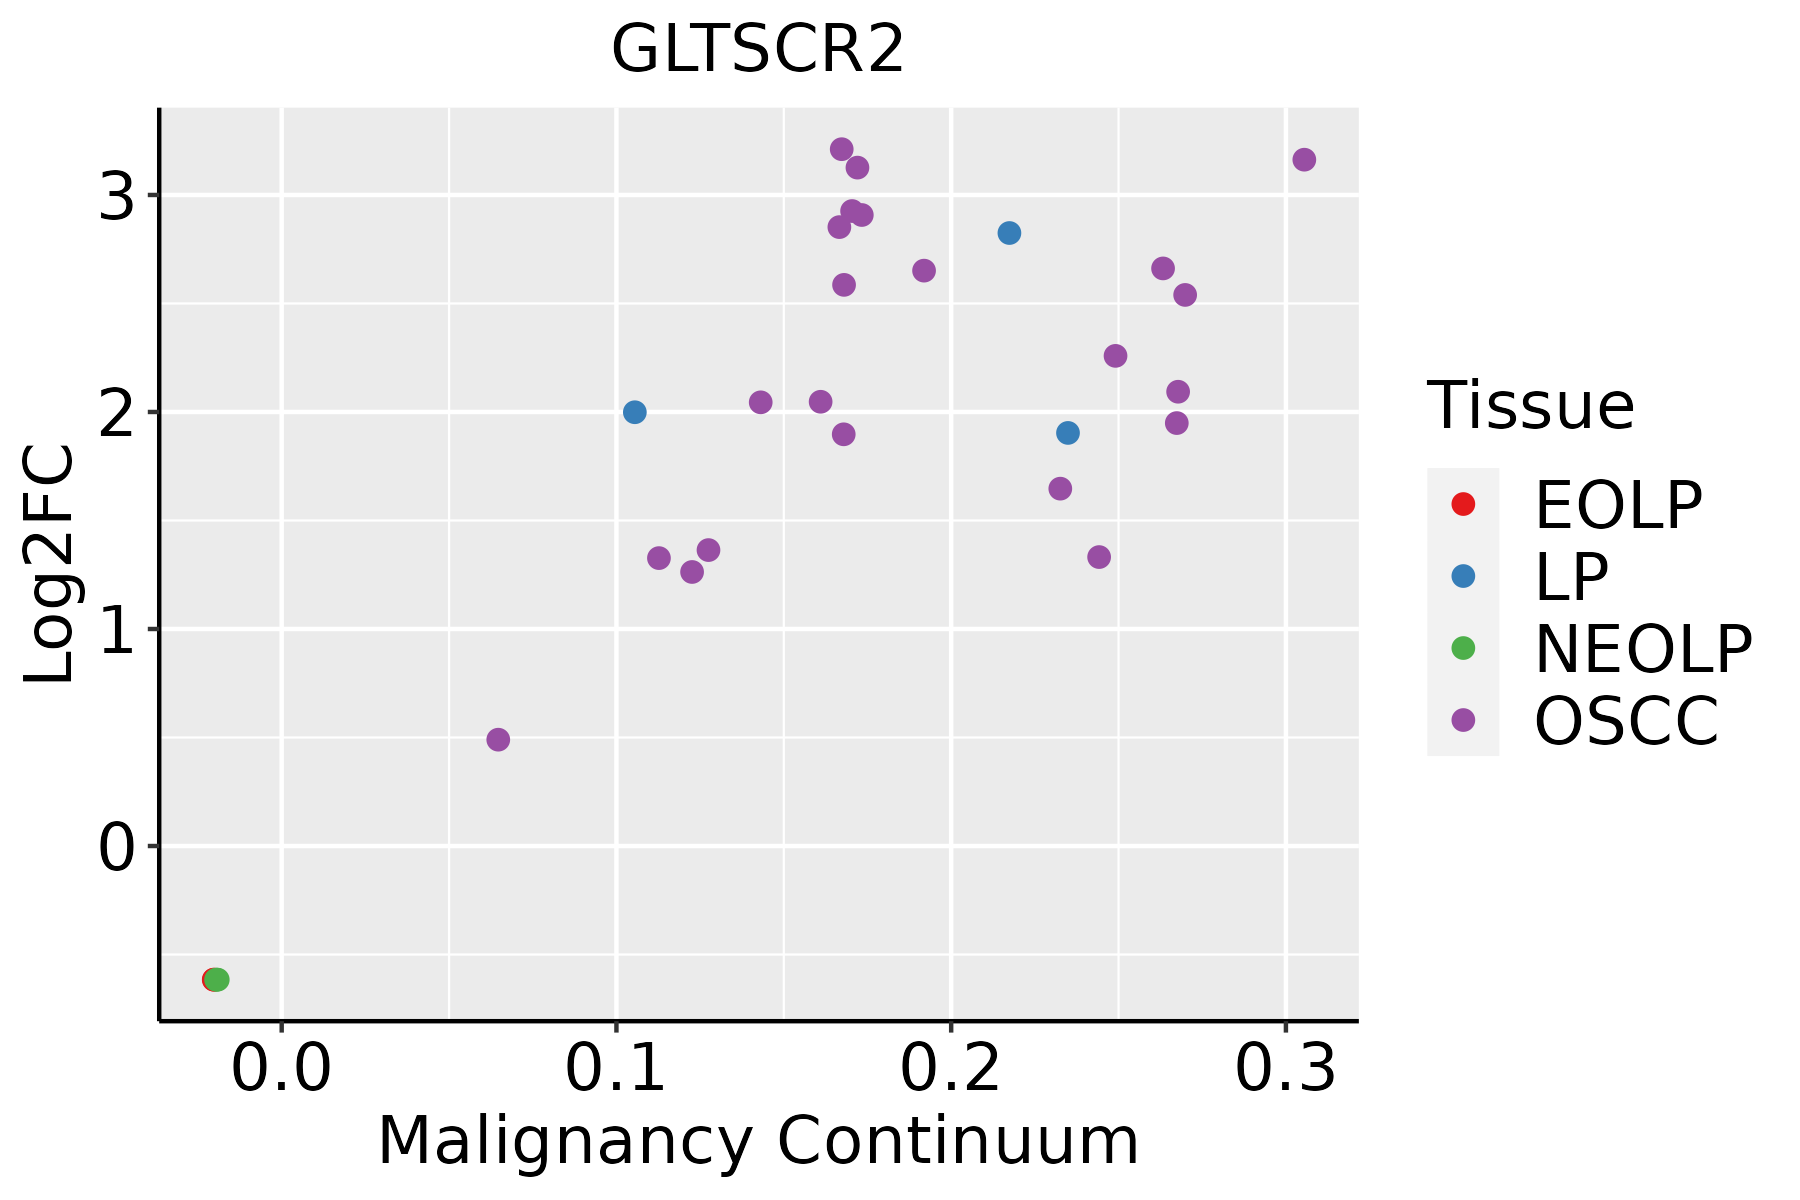 | EOLP: Erosive Oral lichen planus |
| LP: leukoplakia | ||
| NEOLP: Non-erosive oral lichen planus | ||
| OSCC: Oral squamous cell carcinoma | ||
| Prostate |  | BPH: Benign Prostatic Hyperplasia |
| Skin | 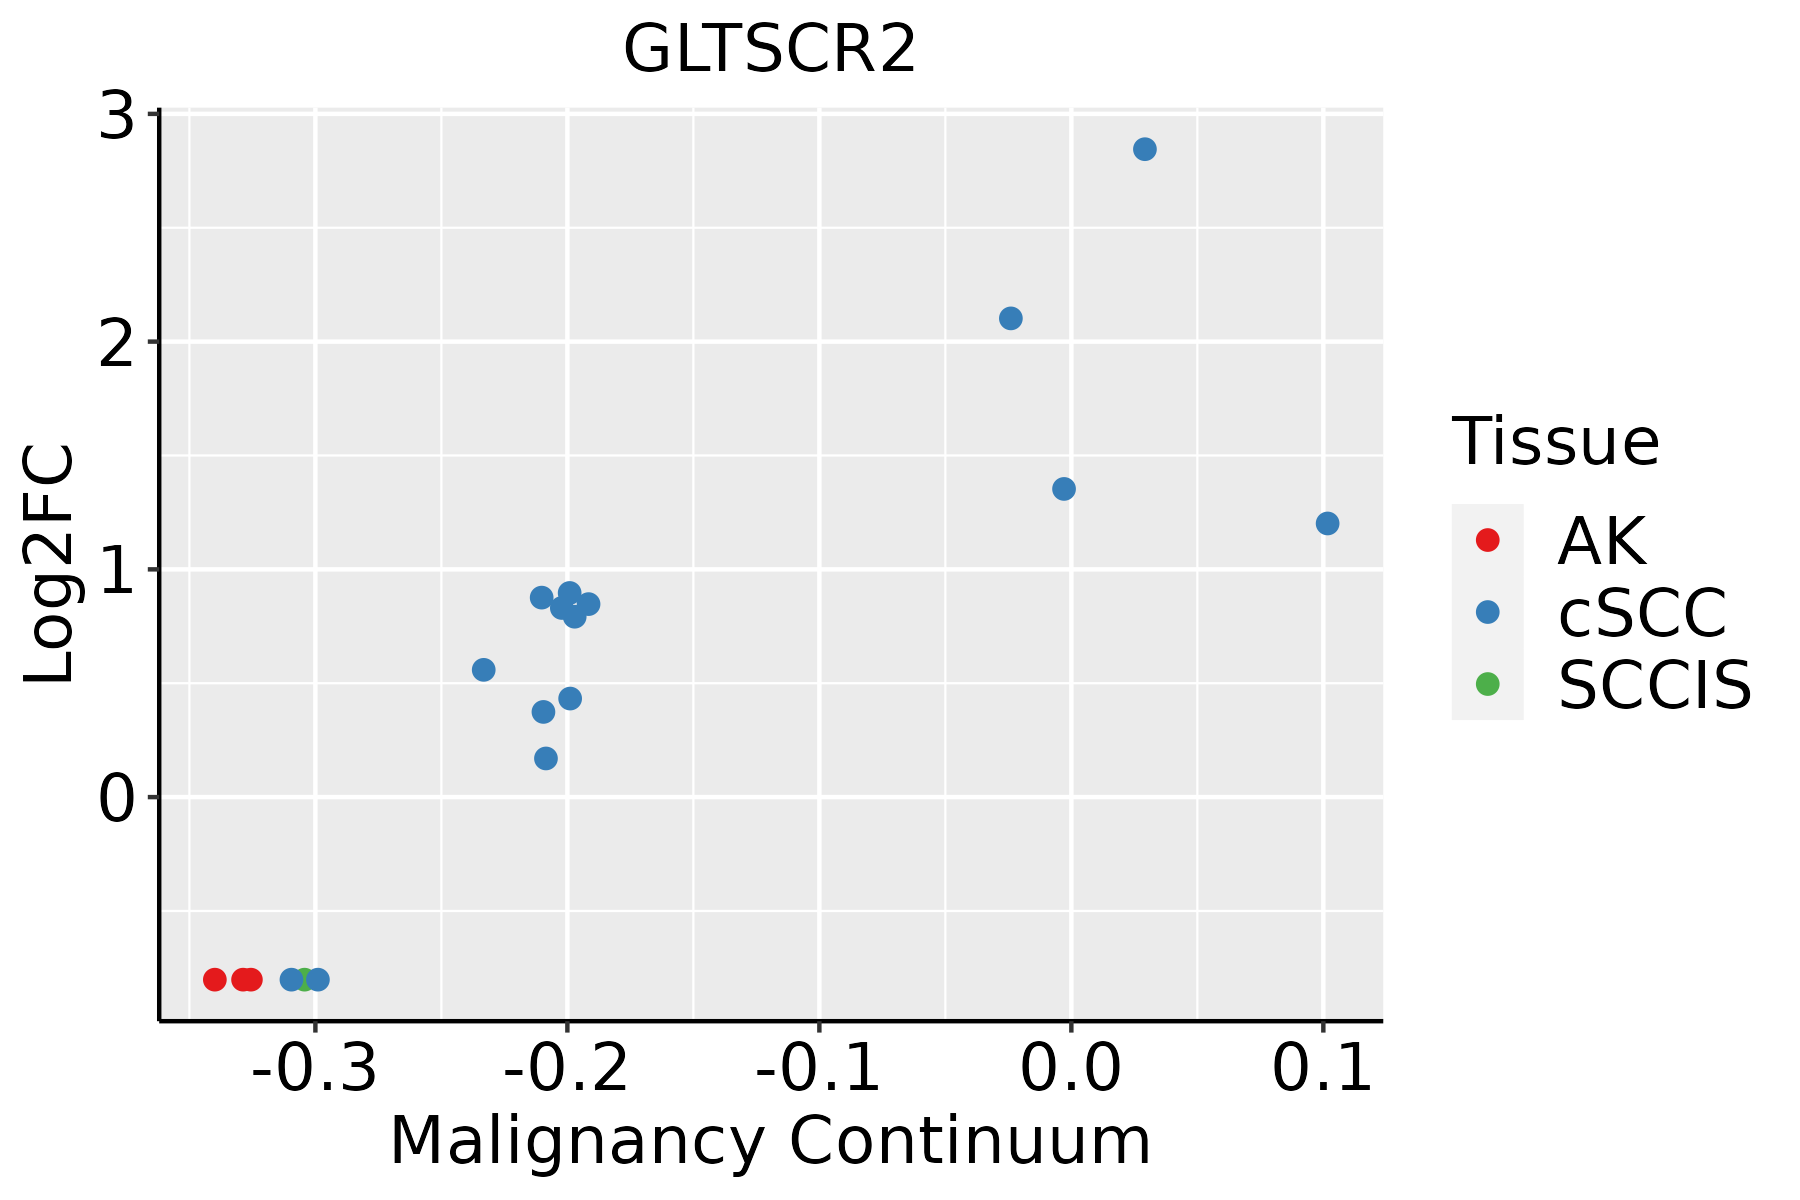 | AK: Actinic keratosis |
| cSCC: Cutaneous squamous cell carcinoma | ||
| SCCIS:squamous cell carcinoma in situ |
| ∗log2FC in expression of this searched gene in stem-like cells from each diseased tissue sample relative to stem-like cells in normal samples in each tissue plotted against the malignancy continuum. Samples are colored based on if they are from different disease stage. |
Top |
Malignant transformation related pathway analysis |
| Find out the enriched GO biological processes and KEGG pathways involved in transition from healthy to precancer to cancer |
| Tissue | Disease Stage | Enriched GO biological Processes |
| Colorectum | AD |  |
| Colorectum | SER |  |
| Colorectum | MSS |  |
| Colorectum | MSI-H |  |
| Colorectum | FAP |  |
| ∗Top 15 enriched GO BP terms are showed in the bar plot of each disease state in each tissue. Each row represents a significant GO biological process which is colored according to the -log10(p.adjust). |
| Page: 1 2 3 4 5 6 7 8 9 |
| GO ID | Tissue | Disease Stage | Description | Gene Ratio | Bg Ratio | pvalue | p.adjust | Count |
| Page: 1 |
| Pathway ID | Tissue | Disease Stage | Description | Gene Ratio | Bg Ratio | pvalue | p.adjust | qvalue | Count |
| Page: 1 |
Top |
Cell-cell communication analysis |
| Identification of potential cell-cell interactions between two cell types and their ligand-receptor pairs for different disease states |
| Ligand | Receptor | LRpair | Pathway | Tissue | Disease Stage |
| Page: 1 |
Top |
Single-cell gene regulatory network inference analysis |
| Find out the significant the regulons (TFs) and the target genes of each regulon across cell types for different disease states |
| TF | Cell Type | Tissue | Disease Stage | Target Gene | RSS | Regulon Activity |
| ∗The dot plots of a searched regulon are shown for all cell subpopulations in each disease state of each tissue based on the regulon specific score inferred using pySCENIC and by calculating the average expression. |
| Page: 1 |
Top |
Somatic mutation of malignant transformation related genes |
| Annotation of somatic variants for genes involved in malignant transformation |
| Hugo Symbol | Variant Class | Variant Classification | dbSNP RS | HGVSc | HGVSp | HGVSp Short | SWISSPROT | BIOTYPE | SIFT | PolyPhen | Tumor Sample Barcode | Tissue | Histology | Sex | Age | Stage | Therapy Types | Drugs | Outcome |
| GLTSCR2 | SNV | Missense_Mutation | rs377217052 | c.1300N>A | p.Glu434Lys | p.E434K | Q9NZM5 | protein_coding | deleterious(0) | probably_damaging(0.997) | TCGA-BH-A0B6-01 | Breast | breast invasive carcinoma | Female | <65 | I/II | Unknown | Unknown | SD |
| GLTSCR2 | insertion | Frame_Shift_Ins | novel | c.257_258insGATTACAGGTGTGAGCCAC | p.Phe87IlefsTer39 | p.F87Ifs*39 | Q9NZM5 | protein_coding | TCGA-BH-A0BM-01 | Breast | breast invasive carcinoma | Female | <65 | I/II | Chemotherapy | adriamycin | SD | ||
| GLTSCR2 | deletion | Frame_Shift_Del | novel | c.53delN | p.Asp19IlefsTer16 | p.D19Ifs*16 | Q9NZM5 | protein_coding | TCGA-D8-A27V-01 | Breast | breast invasive carcinoma | Female | <65 | I/II | Hormone Therapy | tamoxiphen | SD | ||
| GLTSCR2 | SNV | Missense_Mutation | rs375712695 | c.803N>A | p.Arg268Gln | p.R268Q | Q9NZM5 | protein_coding | deleterious(0.01) | possibly_damaging(0.784) | TCGA-2W-A8YY-01 | Cervix | cervical & endocervical cancer | Female | <65 | I/II | Chemotherapy | cisplatin | CR |
| GLTSCR2 | SNV | Missense_Mutation | rs761652099 | c.349N>T | p.Arg117Trp | p.R117W | Q9NZM5 | protein_coding | deleterious(0.02) | benign(0.062) | TCGA-C5-A1MH-01 | Cervix | cervical & endocervical cancer | Female | >=65 | III/IV | Chemotherapy | cisplatin | PD |
| GLTSCR2 | SNV | Missense_Mutation | c.282G>T | p.Lys94Asn | p.K94N | Q9NZM5 | protein_coding | tolerated(0.07) | possibly_damaging(0.711) | TCGA-AA-3663-01 | Colorectum | colon adenocarcinoma | Male | <65 | I/II | Unknown | Unknown | SD | |
| GLTSCR2 | SNV | Missense_Mutation | c.82A>G | p.Thr28Ala | p.T28A | Q9NZM5 | protein_coding | deleterious_low_confidence(0.02) | benign(0.04) | TCGA-AA-3864-01 | Colorectum | colon adenocarcinoma | Male | >=65 | I/II | Unknown | Unknown | SD | |
| GLTSCR2 | SNV | Missense_Mutation | c.11N>A | p.Gly4Glu | p.G4E | Q9NZM5 | protein_coding | deleterious_low_confidence(0.04) | benign(0.003) | TCGA-AA-A01R-01 | Colorectum | colon adenocarcinoma | Male | <65 | III/IV | Chemotherapy | 5-fluorouracil | PD | |
| GLTSCR2 | SNV | Missense_Mutation | rs758927975 | c.985N>A | p.Ala329Thr | p.A329T | Q9NZM5 | protein_coding | tolerated(0.25) | benign(0.207) | TCGA-AZ-6598-01 | Colorectum | colon adenocarcinoma | Female | >=65 | I/II | Unknown | Unknown | SD |
| GLTSCR2 | SNV | Missense_Mutation | novel | c.23T>G | p.Val8Gly | p.V8G | Q9NZM5 | protein_coding | tolerated_low_confidence(1) | benign(0) | TCGA-DM-A1D8-01 | Colorectum | colon adenocarcinoma | Female | <65 | III/IV | Unknown | Unknown | SD |
| Page: 1 2 3 4 |
Top |
Related drugs of malignant transformation related genes |
| Identification of chemicals and drugs interact with genes involved in malignant transfromation |
| (DGIdb 4.0) |
| Entrez ID | Symbol | Category | Interaction Types | Drug Claim Name | Drug Name | PMIDs |
| Page: 1 |

Copyright 2023-Present -The University of Texas Health Science Center at Houston |