
|
|||||
|
 | |
| |
| |
| |
| |
| |
|
Gene: GLTSCR1L |
Gene summary for GLTSCR1L |
| Gene information | Species | Human | Gene symbol | GLTSCR1L | Gene ID | 23506 |
| Gene name | BICRA like chromatin remodeling complex associated protein | |
| Gene Alias | GLTSCR1L | |
| Cytomap | 6p21.1 | |
| Gene Type | protein-coding | GO ID | GO:0006139 | UniProtAcc | Q6AI39 |
Top |
Malignant transformation analysis |
| Identification of the aberrant gene expression in precancerous and cancerous lesions by comparing the gene expression of stem-like cells in diseased tissues with normal stem cells |
| Entrez ID | Symbol | Replicates | Species | Organ | Tissue | Adj P-value | Log2FC | Malignancy |
| 23506 | GLTSCR1L | HTA11_99999970781_79442 | Human | Colorectum | MSS | 2.14e-33 | 6.00e-01 | 0.294 |
| 23506 | GLTSCR1L | HTA11_99999965062_69753 | Human | Colorectum | MSI-H | 1.89e-11 | 8.07e-01 | 0.3487 |
| 23506 | GLTSCR1L | HTA11_99999965104_69814 | Human | Colorectum | MSS | 1.17e-35 | 9.81e-01 | 0.281 |
| 23506 | GLTSCR1L | HTA11_99999971662_82457 | Human | Colorectum | MSS | 6.03e-38 | 7.58e-01 | 0.3859 |
| 23506 | GLTSCR1L | HTA11_99999973899_84307 | Human | Colorectum | MSS | 3.46e-22 | 6.90e-01 | 0.2585 |
| 23506 | GLTSCR1L | HTA11_99999974143_84620 | Human | Colorectum | MSS | 5.18e-24 | 4.46e-01 | 0.3005 |
| 23506 | GLTSCR1L | AEH-subject1 | Human | Endometrium | AEH | 3.29e-02 | -7.02e-02 | -0.3059 |
| 23506 | GLTSCR1L | AEH-subject2 | Human | Endometrium | AEH | 7.49e-03 | -7.02e-02 | -0.2525 |
| 23506 | GLTSCR1L | EEC-subject1 | Human | Endometrium | EEC | 3.29e-02 | -7.02e-02 | -0.2682 |
| 23506 | GLTSCR1L | EEC-subject2 | Human | Endometrium | EEC | 3.29e-02 | -7.02e-02 | -0.2607 |
| 23506 | GLTSCR1L | EEC-subject4 | Human | Endometrium | EEC | 3.29e-02 | -7.02e-02 | -0.2571 |
| 23506 | GLTSCR1L | GSM5276934 | Human | Endometrium | EEC | 3.29e-02 | -7.02e-02 | -0.0913 |
| 23506 | GLTSCR1L | GSM5276937 | Human | Endometrium | EEC | 1.68e-02 | -7.02e-02 | -0.0897 |
| 23506 | GLTSCR1L | GSM6177622_NYU_UCEC3_lib2_lib2 | Human | Endometrium | EEC | 2.08e-03 | -7.02e-02 | -0.1916 |
| Page: 1 |
| Tissue | Expression Dynamics | Abbreviation |
| Colorectum (GSE201348) |  | FAP: Familial adenomatous polyposis |
| CRC: Colorectal cancer | ||
| Colorectum (HTA11) |  | AD: Adenomas |
| SER: Sessile serrated lesions | ||
| MSI-H: Microsatellite-high colorectal cancer | ||
| MSS: Microsatellite stable colorectal cancer | ||
| Endometrium | 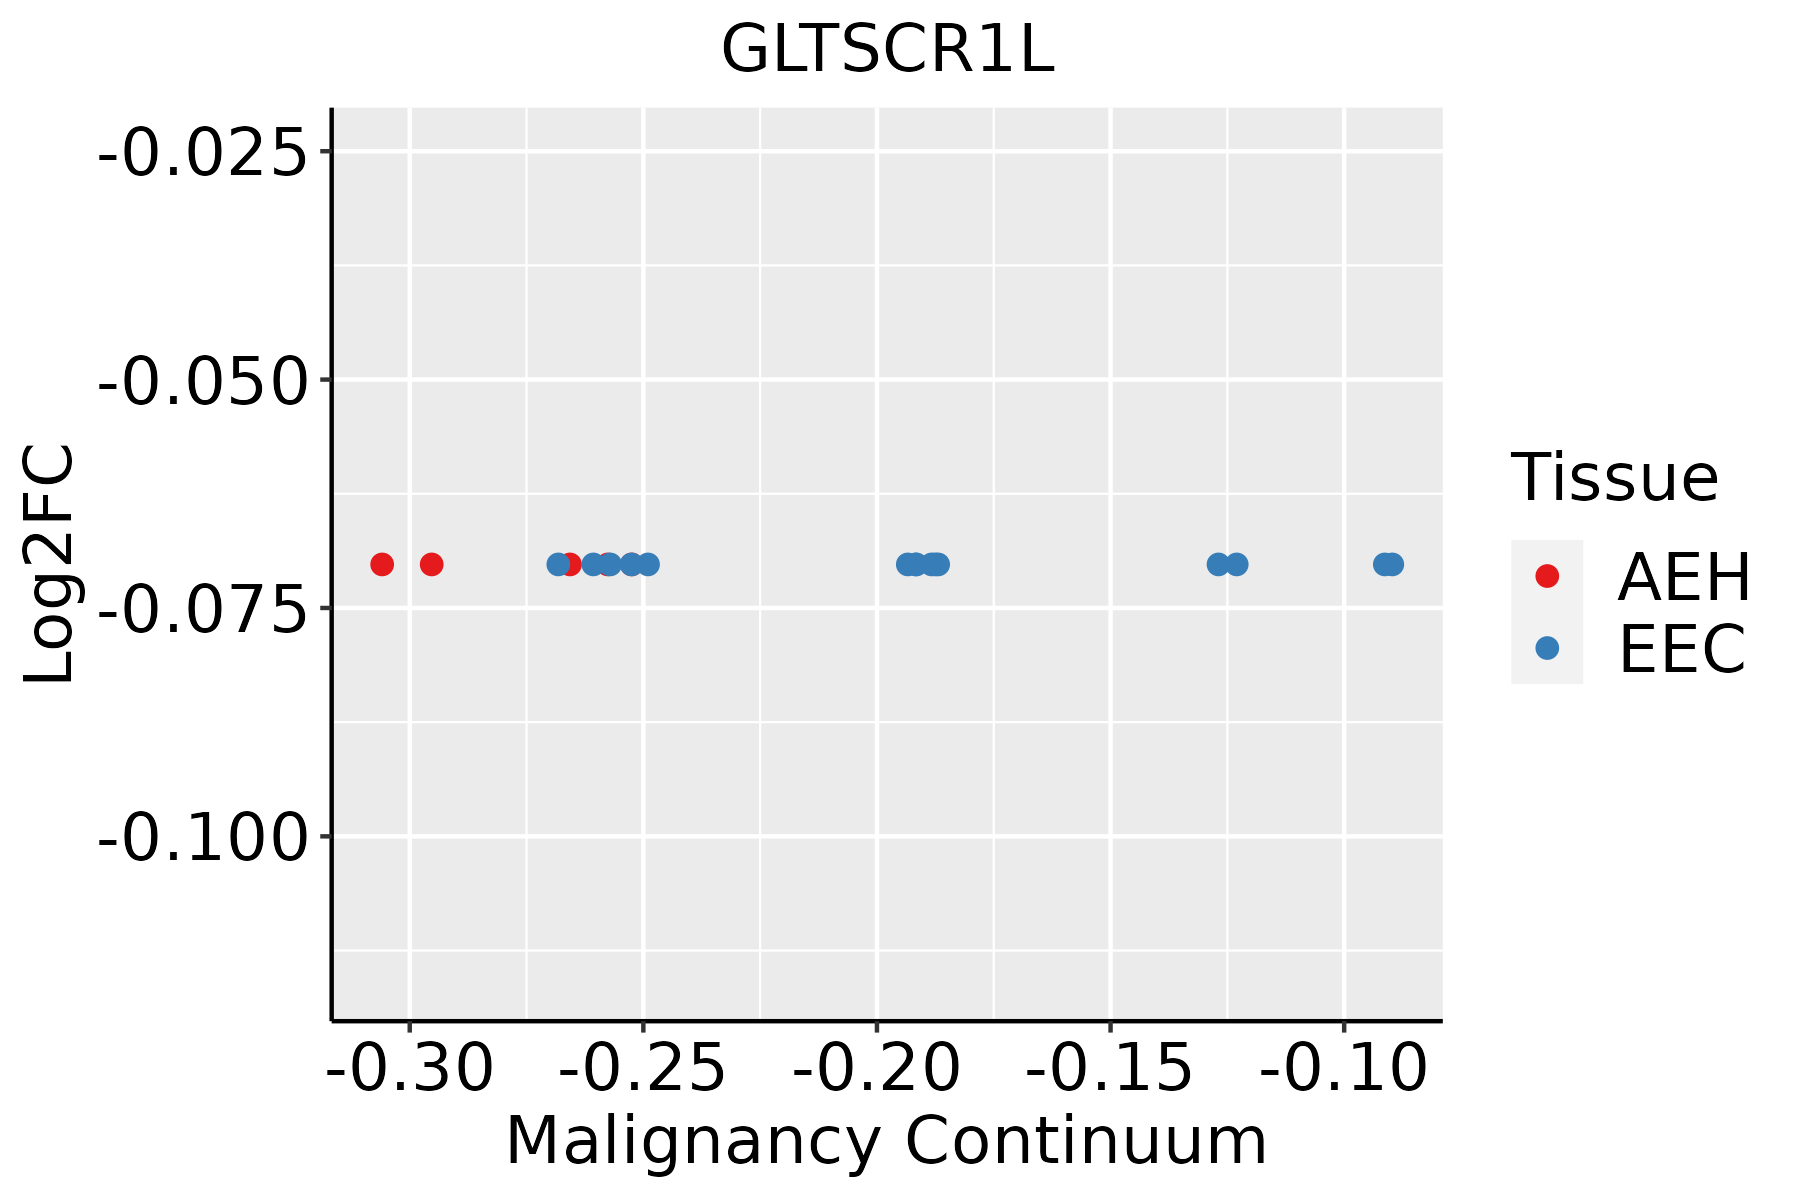 | AEH: Atypical endometrial hyperplasia |
| EEC: Endometrioid Cancer |
| ∗log2FC in expression of this searched gene in stem-like cells from each diseased tissue sample relative to stem-like cells in normal samples in each tissue plotted against the malignancy continuum. Samples are colored based on if they are from different disease stage. |
Top |
Malignant transformation related pathway analysis |
| Find out the enriched GO biological processes and KEGG pathways involved in transition from healthy to precancer to cancer |
| Tissue | Disease Stage | Enriched GO biological Processes |
| Colorectum | AD |  |
| Colorectum | SER |  |
| Colorectum | MSS |  |
| Colorectum | MSI-H |  |
| Colorectum | FAP |  |
| ∗Top 15 enriched GO BP terms are showed in the bar plot of each disease state in each tissue. Each row represents a significant GO biological process which is colored according to the -log10(p.adjust). |
| Page: 1 2 3 4 5 6 7 8 9 |
| GO ID | Tissue | Disease Stage | Description | Gene Ratio | Bg Ratio | pvalue | p.adjust | Count |
| Page: 1 |
| Pathway ID | Tissue | Disease Stage | Description | Gene Ratio | Bg Ratio | pvalue | p.adjust | qvalue | Count |
| Page: 1 |
Top |
Cell-cell communication analysis |
| Identification of potential cell-cell interactions between two cell types and their ligand-receptor pairs for different disease states |
| Ligand | Receptor | LRpair | Pathway | Tissue | Disease Stage |
| Page: 1 |
Top |
Single-cell gene regulatory network inference analysis |
| Find out the significant the regulons (TFs) and the target genes of each regulon across cell types for different disease states |
| TF | Cell Type | Tissue | Disease Stage | Target Gene | RSS | Regulon Activity |
| ∗The dot plots of a searched regulon are shown for all cell subpopulations in each disease state of each tissue based on the regulon specific score inferred using pySCENIC and by calculating the average expression. |
| Page: 1 |
Top |
Somatic mutation of malignant transformation related genes |
| Annotation of somatic variants for genes involved in malignant transformation |
| Hugo Symbol | Variant Class | Variant Classification | dbSNP RS | HGVSc | HGVSp | HGVSp Short | SWISSPROT | BIOTYPE | SIFT | PolyPhen | Tumor Sample Barcode | Tissue | Histology | Sex | Age | Stage | Therapy Types | Drugs | Outcome |
| GLTSCR1L | SNV | Missense_Mutation | c.2609N>T | p.Thr870Met | p.T870M | Q6AI39 | protein_coding | deleterious_low_confidence(0.01) | benign(0.413) | TCGA-AN-A0AK-01 | Breast | breast invasive carcinoma | Female | >=65 | I/II | Unknown | Unknown | SD | |
| GLTSCR1L | SNV | Missense_Mutation | c.1720C>T | p.Pro574Ser | p.P574S | Q6AI39 | protein_coding | tolerated(0.41) | benign(0.053) | TCGA-BH-A0HA-01 | Breast | breast invasive carcinoma | Female | <65 | I/II | Unknown | Unknown | SD | |
| GLTSCR1L | SNV | Missense_Mutation | novel | c.2300N>T | p.Thr767Ile | p.T767I | Q6AI39 | protein_coding | deleterious(0) | possibly_damaging(0.706) | TCGA-BH-A0HF-01 | Breast | breast invasive carcinoma | Female | >=65 | I/II | Hormone Therapy | arimidex | SD |
| GLTSCR1L | SNV | Missense_Mutation | c.2621N>C | p.Asn874Thr | p.N874T | Q6AI39 | protein_coding | tolerated_low_confidence(0.27) | benign(0.003) | TCGA-E2-A14S-01 | Breast | breast invasive carcinoma | Female | >=65 | I/II | Chemotherapy | cytoxan | SD | |
| GLTSCR1L | SNV | Missense_Mutation | c.1183C>A | p.His395Asn | p.H395N | Q6AI39 | protein_coding | tolerated(0.54) | benign(0.255) | TCGA-E9-A1R4-01 | Breast | breast invasive carcinoma | Female | >=65 | I/II | Chemotherapy | 5-fluorouracil | SD | |
| GLTSCR1L | insertion | Nonsense_Mutation | novel | c.314_315insCTCAAAAAAATGAAGCTAAGCTCCAAGTAG | p.Ile105_Leu106insSerLysLysTerSerTerAlaProSerSer | p.I105_L106insSKK*S*APSS | Q6AI39 | protein_coding | TCGA-A2-A0D1-01 | Breast | breast invasive carcinoma | Female | >=65 | I/II | Chemotherapy | taxotere | SD | ||
| GLTSCR1L | insertion | Frame_Shift_Ins | novel | c.3057_3058insAACATTA | p.Ala1020AsnfsTer10 | p.A1020Nfs*10 | Q6AI39 | protein_coding | TCGA-A8-A08C-01 | Breast | breast invasive carcinoma | Female | >=65 | I/II | Chemotherapy | 5-fluorouracil | CR | ||
| GLTSCR1L | insertion | In_Frame_Ins | novel | c.2971_2972insGCC | p.Met991delinsSerLeu | p.M991delinsSL | Q6AI39 | protein_coding | TCGA-AN-A03X-01 | Breast | breast invasive carcinoma | Female | >=65 | I/II | Unknown | Unknown | SD | ||
| GLTSCR1L | insertion | Frame_Shift_Ins | novel | c.916_917insATGC | p.Ser306TyrfsTer4 | p.S306Yfs*4 | Q6AI39 | protein_coding | TCGA-AO-A03R-01 | Breast | breast invasive carcinoma | Female | <65 | I/II | Chemotherapy | doxorubicin | SD | ||
| GLTSCR1L | insertion | Nonsense_Mutation | novel | c.918_919insTGTAACATACTGTTTATTTTTTTAGAATGCTGATCCT | p.Asn307CysfsTer11 | p.N307Cfs*11 | Q6AI39 | protein_coding | TCGA-AO-A03R-01 | Breast | breast invasive carcinoma | Female | <65 | I/II | Chemotherapy | doxorubicin | SD |
| Page: 1 2 3 4 5 6 7 8 9 10 |
Top |
Related drugs of malignant transformation related genes |
| Identification of chemicals and drugs interact with genes involved in malignant transfromation |
| (DGIdb 4.0) |
| Entrez ID | Symbol | Category | Interaction Types | Drug Claim Name | Drug Name | PMIDs |
| Page: 1 |

Copyright 2023-Present -The University of Texas Health Science Center at Houston |