
|
|||||
|
 | |
| |
| |
| |
| |
| |
|
Gene: GLTP |
Gene summary for GLTP |
| Gene information | Species | Human | Gene symbol | GLTP | Gene ID | 51228 |
| Gene name | glycolipid transfer protein | |
| Gene Alias | GLTP | |
| Cytomap | 12q24.11 | |
| Gene Type | protein-coding | GO ID | GO:0006629 | UniProtAcc | A0A024RBI7 |
Top |
Malignant transformation analysis |
| Identification of the aberrant gene expression in precancerous and cancerous lesions by comparing the gene expression of stem-like cells in diseased tissues with normal stem cells |
| Entrez ID | Symbol | Replicates | Species | Organ | Tissue | Adj P-value | Log2FC | Malignancy |
| 51228 | GLTP | CA_HPV_1 | Human | Cervix | CC | 3.33e-06 | -2.29e-01 | 0.0264 |
| 51228 | GLTP | CCII_1 | Human | Cervix | CC | 3.82e-03 | -3.36e-01 | 0.3249 |
| 51228 | GLTP | Tumor | Human | Cervix | CC | 3.49e-21 | 6.54e-01 | 0.1241 |
| 51228 | GLTP | sample3 | Human | Cervix | CC | 2.30e-26 | 7.29e-01 | 0.1387 |
| 51228 | GLTP | T1 | Human | Cervix | CC | 7.25e-03 | -2.59e-01 | 0.0918 |
| 51228 | GLTP | T3 | Human | Cervix | CC | 1.63e-29 | 7.61e-01 | 0.1389 |
| 51228 | GLTP | HTA11_2487_2000001011 | Human | Colorectum | SER | 2.94e-05 | 4.82e-01 | -0.1808 |
| 51228 | GLTP | HTA11_347_2000001011 | Human | Colorectum | AD | 2.31e-24 | 7.68e-01 | -0.1954 |
| 51228 | GLTP | HTA11_411_2000001011 | Human | Colorectum | SER | 2.74e-02 | 6.88e-01 | -0.2602 |
| 51228 | GLTP | HTA11_2112_2000001011 | Human | Colorectum | SER | 1.96e-04 | 4.67e-01 | -0.2196 |
| 51228 | GLTP | HTA11_83_2000001011 | Human | Colorectum | SER | 4.62e-05 | 5.73e-01 | -0.1526 |
| 51228 | GLTP | HTA11_696_2000001011 | Human | Colorectum | AD | 1.05e-07 | 4.39e-01 | -0.1464 |
| 51228 | GLTP | HTA11_2992_2000001011 | Human | Colorectum | SER | 2.10e-07 | 8.26e-01 | -0.1706 |
| 51228 | GLTP | HTA11_5212_2000001011 | Human | Colorectum | AD | 3.81e-03 | 5.31e-01 | -0.2061 |
| 51228 | GLTP | A015-C-203 | Human | Colorectum | FAP | 4.46e-07 | -2.06e-01 | -0.1294 |
| 51228 | GLTP | A002-C-201 | Human | Colorectum | FAP | 1.51e-04 | -2.03e-01 | 0.0324 |
| 51228 | GLTP | A002-C-205 | Human | Colorectum | FAP | 6.12e-03 | -1.75e-01 | -0.1236 |
| 51228 | GLTP | A015-C-006 | Human | Colorectum | FAP | 1.19e-03 | -2.16e-01 | -0.0994 |
| 51228 | GLTP | A015-C-104 | Human | Colorectum | FAP | 4.46e-07 | -2.16e-01 | -0.1899 |
| 51228 | GLTP | A001-C-014 | Human | Colorectum | FAP | 4.45e-03 | -1.48e-01 | 0.0135 |
| Page: 1 2 3 4 5 6 7 8 |
| Tissue | Expression Dynamics | Abbreviation |
| Cervix | 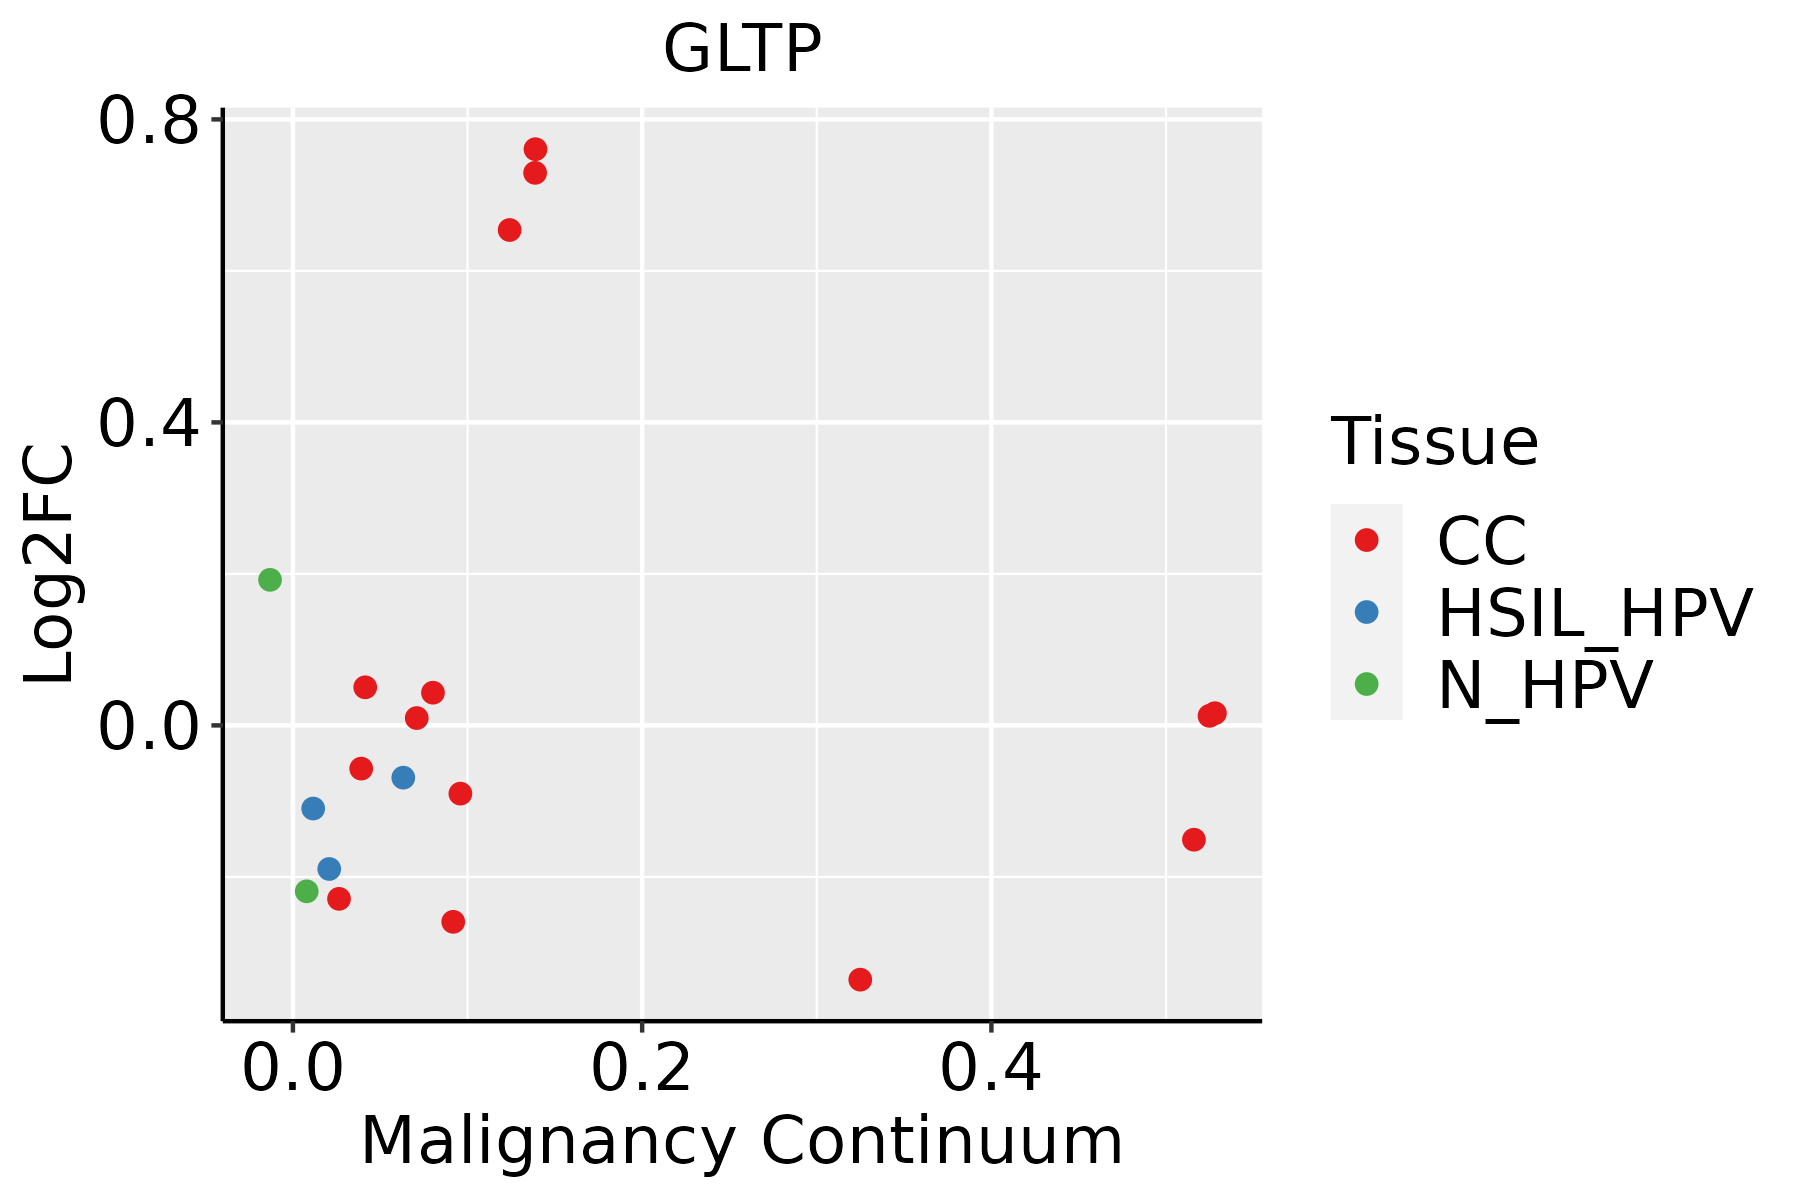 | CC: Cervix cancer |
| HSIL_HPV: HPV-infected high-grade squamous intraepithelial lesions | ||
| N_HPV: HPV-infected normal cervix | ||
| Colorectum (GSE201348) |  | FAP: Familial adenomatous polyposis |
| CRC: Colorectal cancer | ||
| Colorectum (HTA11) |  | AD: Adenomas |
| SER: Sessile serrated lesions | ||
| MSI-H: Microsatellite-high colorectal cancer | ||
| MSS: Microsatellite stable colorectal cancer | ||
| Esophagus | 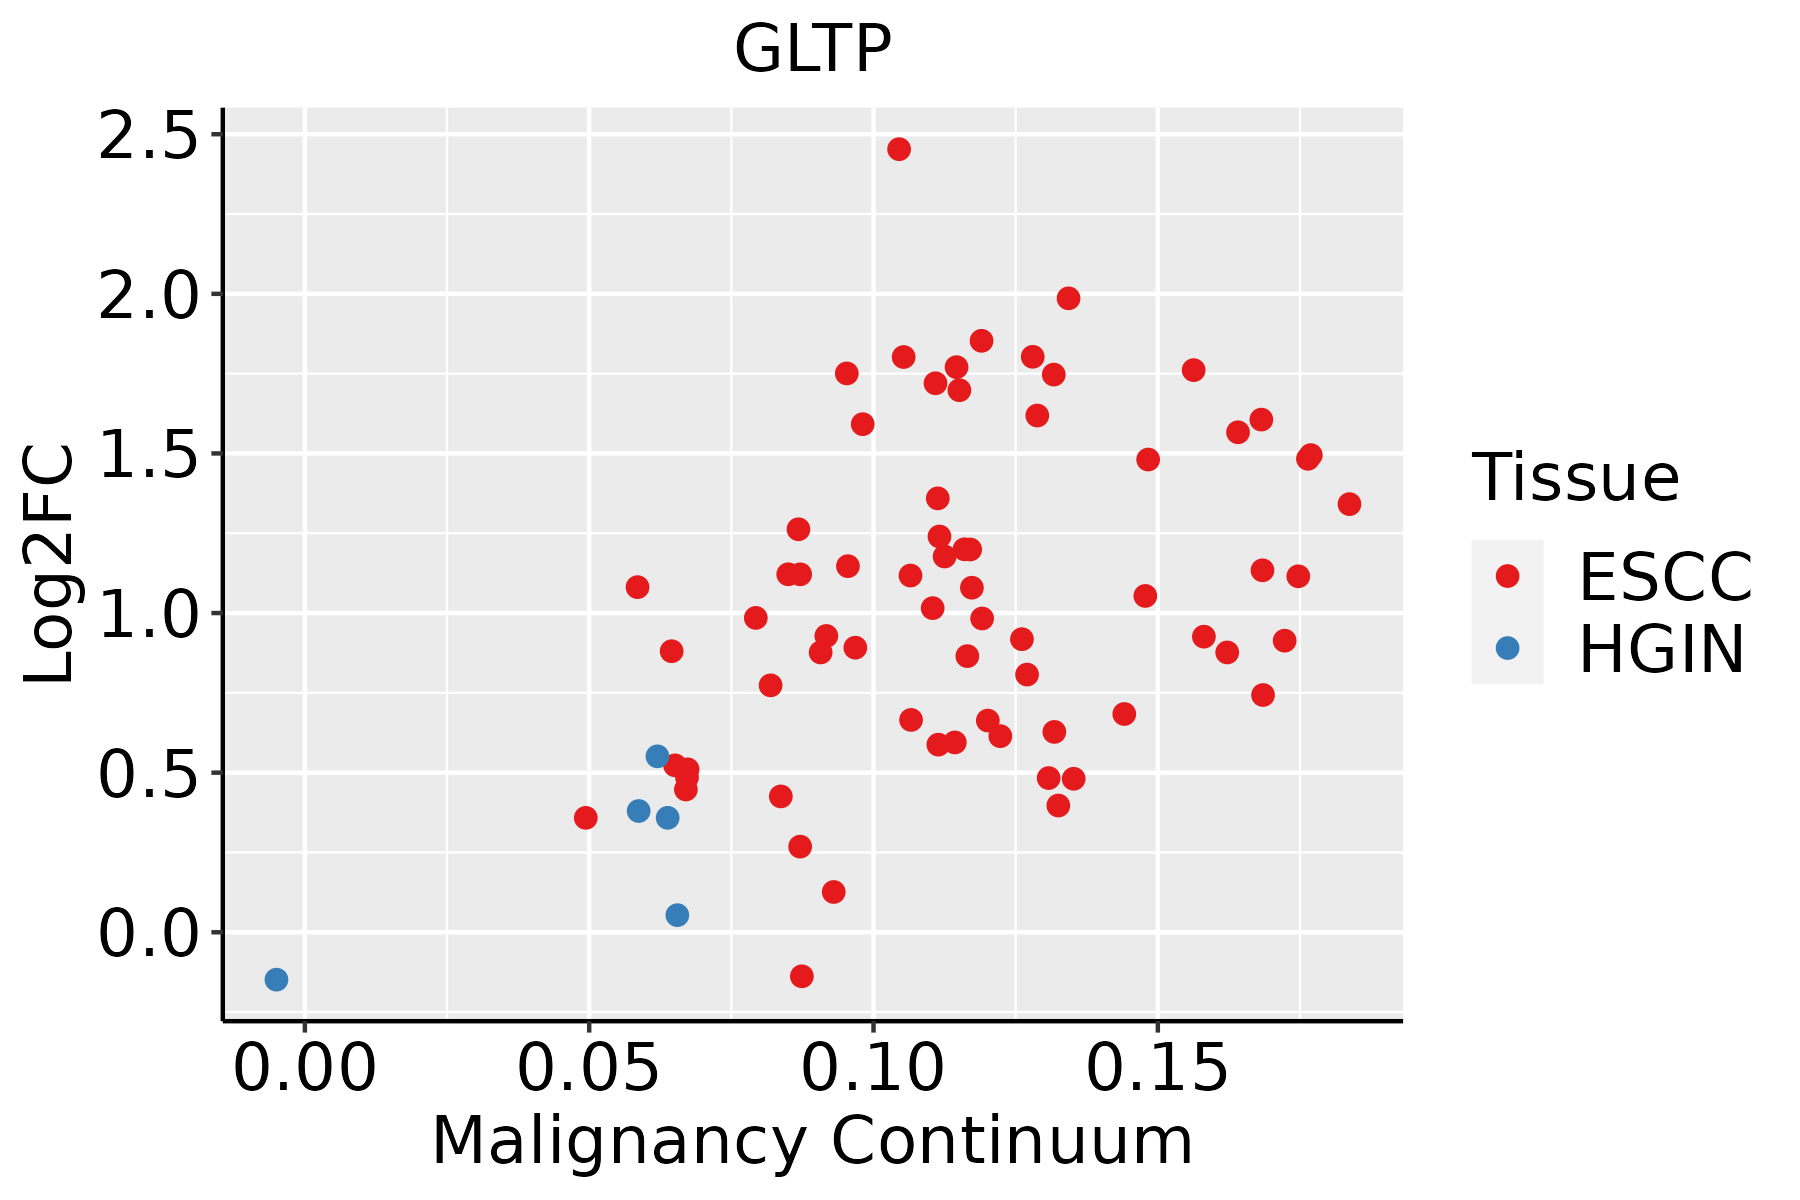 | ESCC: Esophageal squamous cell carcinoma |
| HGIN: High-grade intraepithelial neoplasias | ||
| LGIN: Low-grade intraepithelial neoplasias | ||
| Liver | 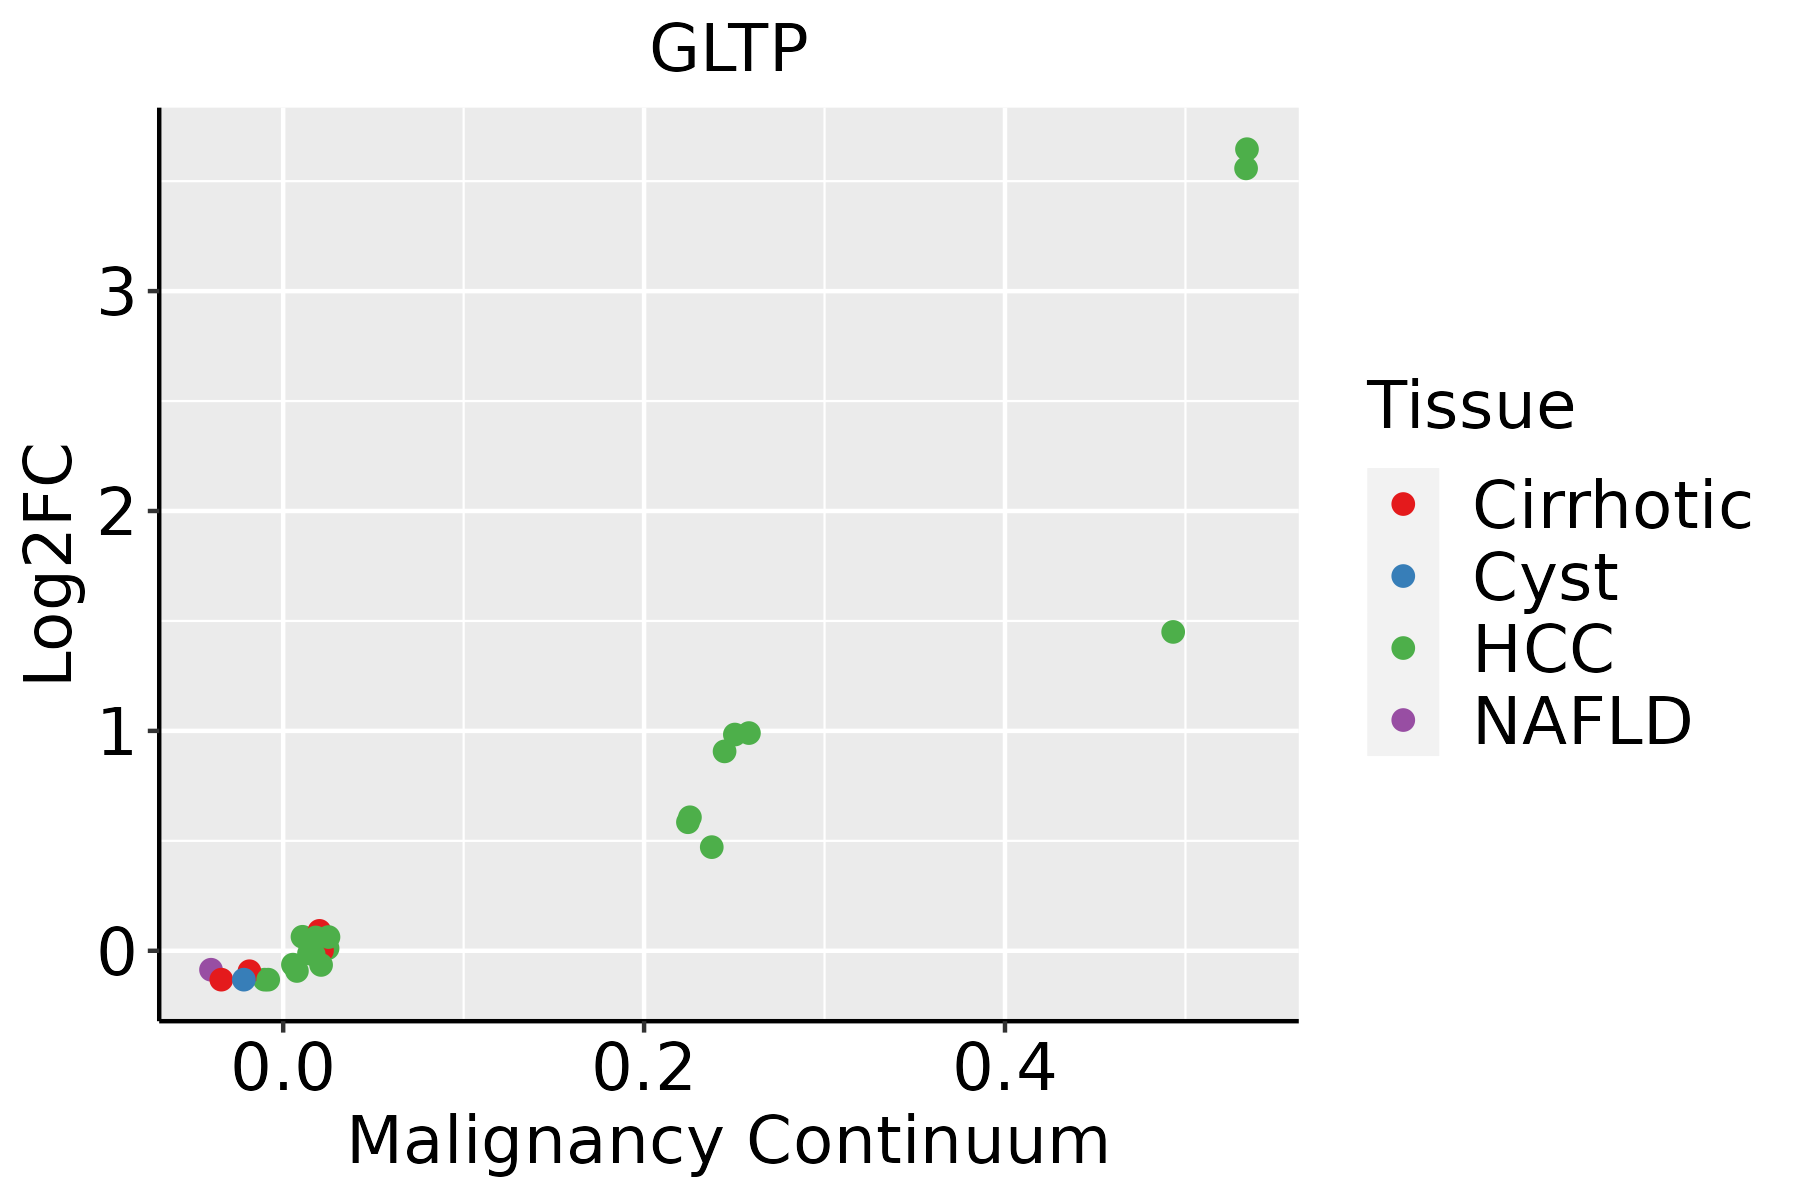 | HCC: Hepatocellular carcinoma |
| NAFLD: Non-alcoholic fatty liver disease | ||
| Oral Cavity | 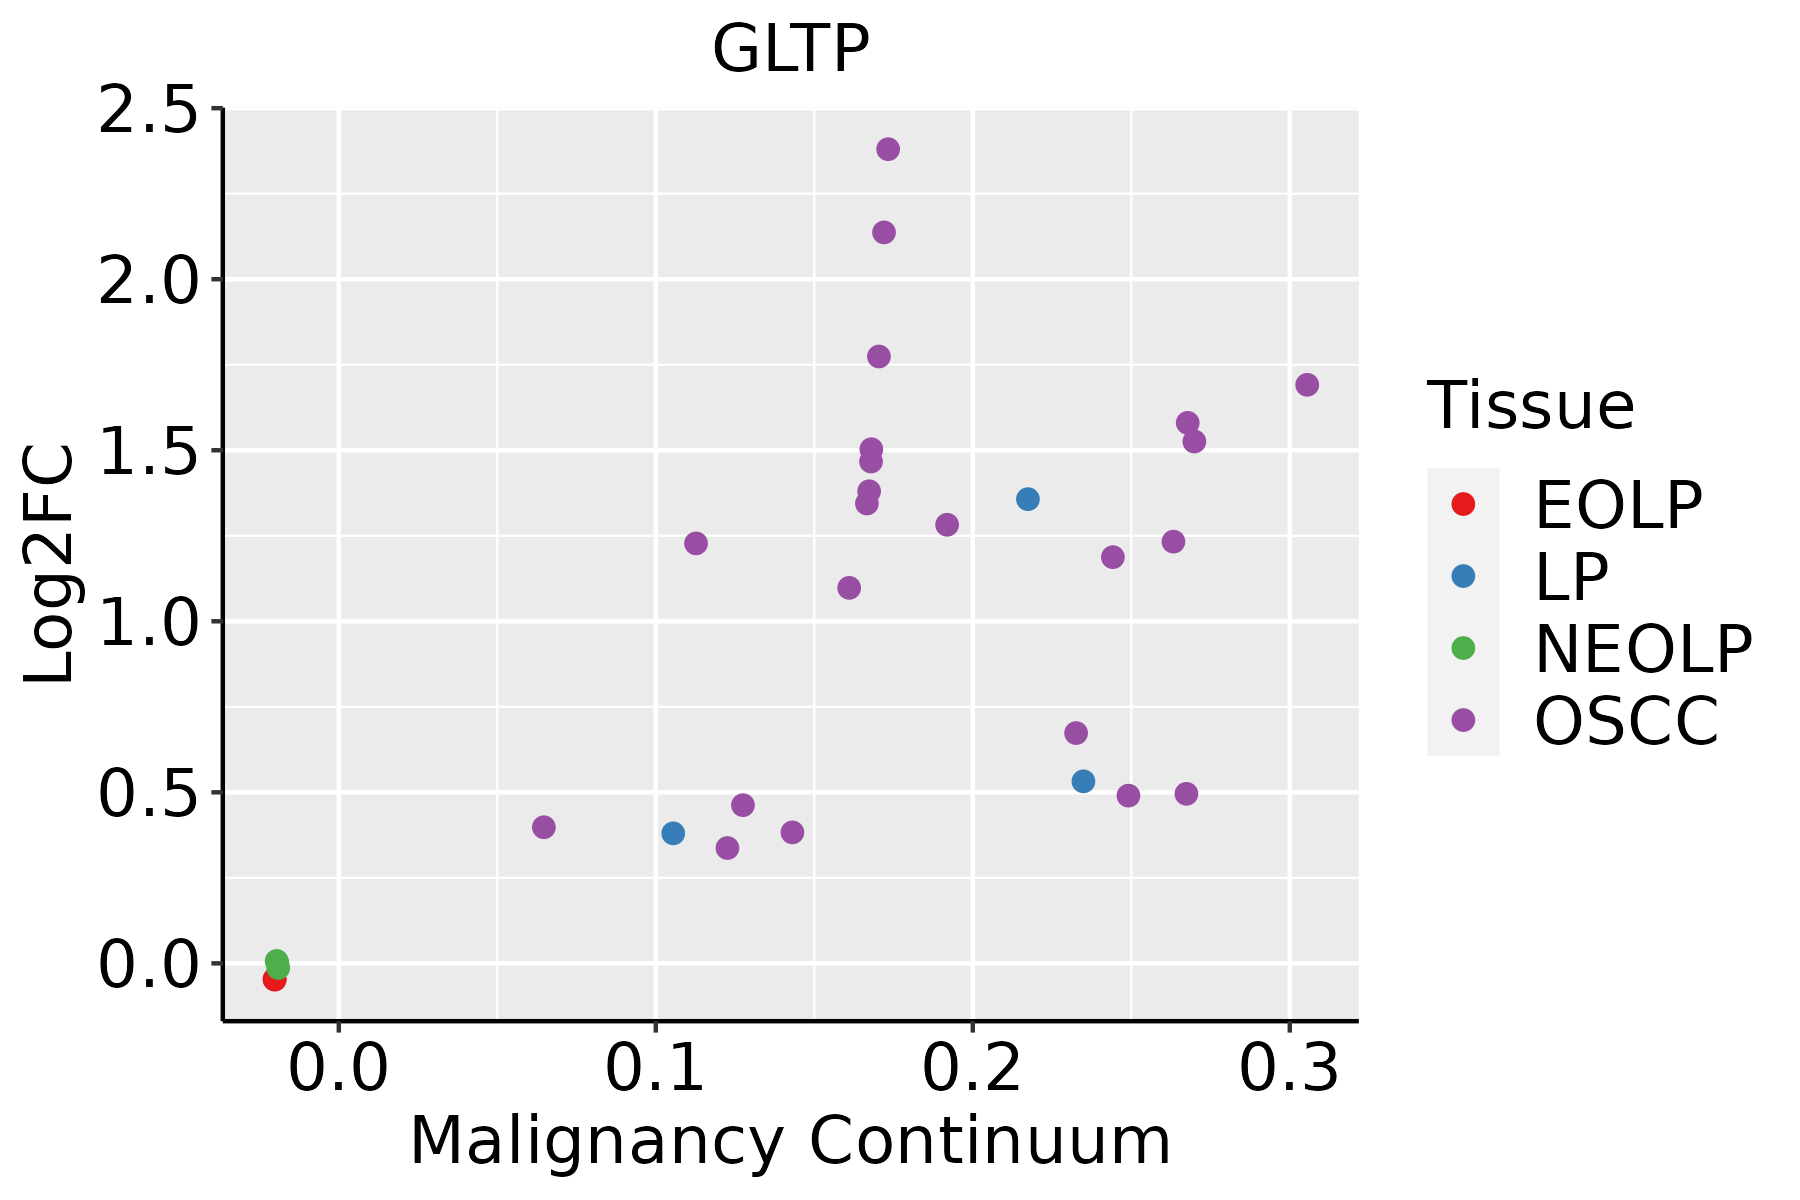 | EOLP: Erosive Oral lichen planus |
| LP: leukoplakia | ||
| NEOLP: Non-erosive oral lichen planus | ||
| OSCC: Oral squamous cell carcinoma | ||
| Skin | 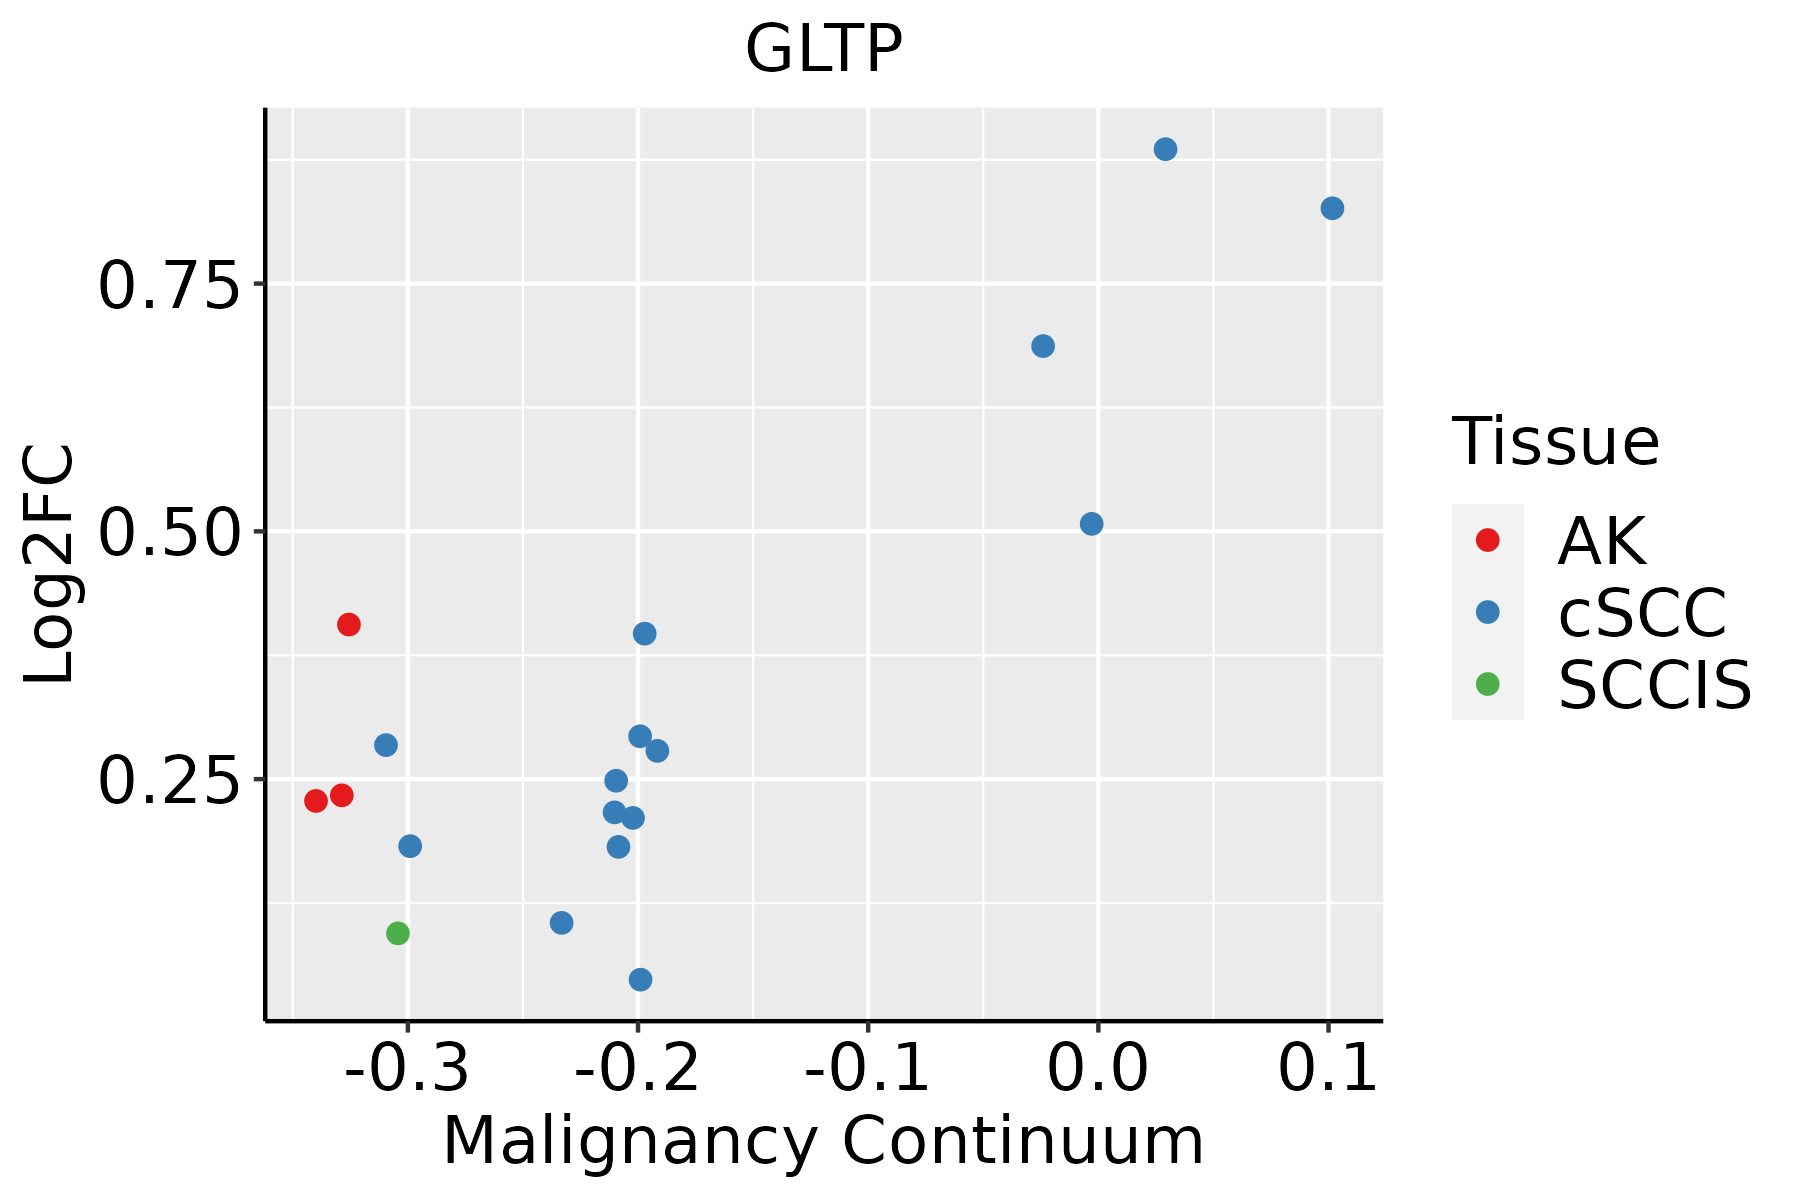 | AK: Actinic keratosis |
| cSCC: Cutaneous squamous cell carcinoma | ||
| SCCIS:squamous cell carcinoma in situ | ||
| Thyroid |  | ATC: Anaplastic thyroid cancer |
| HT: Hashimoto's thyroiditis | ||
| PTC: Papillary thyroid cancer |
| ∗log2FC in expression of this searched gene in stem-like cells from each diseased tissue sample relative to stem-like cells in normal samples in each tissue plotted against the malignancy continuum. Samples are colored based on if they are from different disease stage. |
Top |
Malignant transformation related pathway analysis |
| Find out the enriched GO biological processes and KEGG pathways involved in transition from healthy to precancer to cancer |
| Tissue | Disease Stage | Enriched GO biological Processes |
| Colorectum | AD |  |
| Colorectum | SER |  |
| Colorectum | MSS |  |
| Colorectum | MSI-H |  |
| Colorectum | FAP |  |
| ∗Top 15 enriched GO BP terms are showed in the bar plot of each disease state in each tissue. Each row represents a significant GO biological process which is colored according to the -log10(p.adjust). |
| Page: 1 2 3 4 5 6 7 8 9 |
| GO ID | Tissue | Disease Stage | Description | Gene Ratio | Bg Ratio | pvalue | p.adjust | Count |
| GO:0010876 | Colorectum | AD | lipid localization | 120/3918 | 448/18723 | 1.59e-03 | 1.33e-02 | 120 |
| GO:0006869 | Colorectum | AD | lipid transport | 108/3918 | 398/18723 | 1.67e-03 | 1.39e-02 | 108 |
| GO:0042886 | Colorectum | AD | amide transport | 83/3918 | 301/18723 | 3.37e-03 | 2.46e-02 | 83 |
| GO:0015748 | Colorectum | AD | organophosphate ester transport | 42/3918 | 140/18723 | 7.04e-03 | 4.31e-02 | 42 |
| GO:00068691 | Colorectum | FAP | lipid transport | 81/2622 | 398/18723 | 2.84e-04 | 3.76e-03 | 81 |
| GO:00428862 | Colorectum | FAP | amide transport | 62/2622 | 301/18723 | 1.01e-03 | 9.93e-03 | 62 |
| GO:00108762 | Colorectum | FAP | lipid localization | 85/2622 | 448/18723 | 1.92e-03 | 1.63e-02 | 85 |
| GO:0015914 | Colorectum | FAP | phospholipid transport | 23/2622 | 96/18723 | 6.09e-03 | 3.82e-02 | 23 |
| GO:00068692 | Colorectum | CRC | lipid transport | 63/2078 | 398/18723 | 2.36e-03 | 2.26e-02 | 63 |
| GO:00108763 | Colorectum | CRC | lipid localization | 68/2078 | 448/18723 | 4.60e-03 | 3.58e-02 | 68 |
| GO:00066433 | Esophagus | ESCC | membrane lipid metabolic process | 130/8552 | 203/18723 | 9.29e-08 | 1.54e-06 | 130 |
| GO:00066652 | Esophagus | ESCC | sphingolipid metabolic process | 96/8552 | 155/18723 | 3.21e-05 | 2.66e-04 | 96 |
| GO:00066642 | Esophagus | ESCC | glycolipid metabolic process | 63/8552 | 100/18723 | 3.55e-04 | 2.06e-03 | 63 |
| GO:19035092 | Esophagus | ESCC | liposaccharide metabolic process | 63/8552 | 101/18723 | 5.25e-04 | 2.90e-03 | 63 |
| GO:001087611 | Liver | Cirrhotic | lipid localization | 147/4634 | 448/18723 | 6.24e-05 | 7.12e-04 | 147 |
| GO:000686911 | Liver | Cirrhotic | lipid transport | 128/4634 | 398/18723 | 4.54e-04 | 3.69e-03 | 128 |
| GO:0006643 | Liver | Cirrhotic | membrane lipid metabolic process | 69/4634 | 203/18723 | 1.89e-03 | 1.19e-02 | 69 |
| GO:01200091 | Liver | Cirrhotic | intermembrane lipid transfer | 21/4634 | 48/18723 | 3.06e-03 | 1.73e-02 | 21 |
| GO:00066431 | Liver | HCC | membrane lipid metabolic process | 115/7958 | 203/18723 | 3.17e-05 | 3.22e-04 | 115 |
| GO:001087621 | Liver | HCC | lipid localization | 228/7958 | 448/18723 | 1.80e-04 | 1.41e-03 | 228 |
| Page: 1 2 |
| Pathway ID | Tissue | Disease Stage | Description | Gene Ratio | Bg Ratio | pvalue | p.adjust | qvalue | Count |
| Page: 1 |
Top |
Cell-cell communication analysis |
| Identification of potential cell-cell interactions between two cell types and their ligand-receptor pairs for different disease states |
| Ligand | Receptor | LRpair | Pathway | Tissue | Disease Stage |
| Page: 1 |
Top |
Single-cell gene regulatory network inference analysis |
| Find out the significant the regulons (TFs) and the target genes of each regulon across cell types for different disease states |
| TF | Cell Type | Tissue | Disease Stage | Target Gene | RSS | Regulon Activity |
| ∗The dot plots of a searched regulon are shown for all cell subpopulations in each disease state of each tissue based on the regulon specific score inferred using pySCENIC and by calculating the average expression. |
| Page: 1 |
Top |
Somatic mutation of malignant transformation related genes |
| Annotation of somatic variants for genes involved in malignant transformation |
| Hugo Symbol | Variant Class | Variant Classification | dbSNP RS | HGVSc | HGVSp | HGVSp Short | SWISSPROT | BIOTYPE | SIFT | PolyPhen | Tumor Sample Barcode | Tissue | Histology | Sex | Age | Stage | Therapy Types | Drugs | Outcome |
| GLTP | insertion | Nonsense_Mutation | novel | c.465_466insTAAGAATCTTGGGTTTCGGCAGGGTGCAGTGGCTCACTTCTGTAATC | p.Pro156Ter | p.P156* | Q9NZD2 | protein_coding | TCGA-A8-A08H-01 | Breast | breast invasive carcinoma | Female | >=65 | I/II | Unknown | Unknown | SD | ||
| GLTP | insertion | Frame_Shift_Ins | novel | c.597_598insTGTAGTTCCAGCTACTCAGGAGG | p.Gln200CysfsTer10 | p.Q200Cfs*10 | Q9NZD2 | protein_coding | TCGA-B6-A0IB-01 | Breast | breast invasive carcinoma | Female | <65 | III/IV | Unknown | Unknown | PD | ||
| GLTP | SNV | Missense_Mutation | rs201181687 | c.607N>A | p.Ala203Thr | p.A203T | Q9NZD2 | protein_coding | tolerated(0.08) | benign(0.344) | TCGA-2W-A8YY-01 | Cervix | cervical & endocervical cancer | Female | <65 | I/II | Chemotherapy | cisplatin | CR |
| GLTP | SNV | Missense_Mutation | rs141894554 | c.397N>A | p.Glu133Lys | p.E133K | Q9NZD2 | protein_coding | tolerated(0.13) | benign(0.048) | TCGA-A6-6653-01 | Colorectum | colon adenocarcinoma | Male | >=65 | I/II | Unknown | Unknown | SD |
| GLTP | SNV | Missense_Mutation | novel | c.537N>T | p.Lys179Asn | p.K179N | Q9NZD2 | protein_coding | tolerated(0.22) | benign(0.005) | TCGA-CA-6717-01 | Colorectum | colon adenocarcinoma | Male | <65 | I/II | Chemotherapy | oxaliplatin | CR |
| GLTP | SNV | Missense_Mutation | novel | c.536N>C | p.Lys179Thr | p.K179T | Q9NZD2 | protein_coding | deleterious(0.02) | benign(0.092) | TCGA-2E-A9G8-01 | Endometrium | uterine corpus endometrioid carcinoma | Female | <65 | III/IV | Chemotherapy | taxol | CR |
| GLTP | SNV | Missense_Mutation | rs758929905 | c.566N>T | p.Ala189Val | p.A189V | Q9NZD2 | protein_coding | tolerated(0.06) | benign(0.027) | TCGA-AJ-A3BH-01 | Endometrium | uterine corpus endometrioid carcinoma | Female | Unknown | I/II | Unknown | Unknown | SD |
| GLTP | SNV | Missense_Mutation | novel | c.295N>G | p.Arg99Gly | p.R99G | Q9NZD2 | protein_coding | deleterious(0) | probably_damaging(1) | TCGA-B5-A3FA-01 | Endometrium | uterine corpus endometrioid carcinoma | Female | >=65 | I/II | Unknown | Unknown | SD |
| GLTP | SNV | Missense_Mutation | c.184A>G | p.Thr62Ala | p.T62A | Q9NZD2 | protein_coding | tolerated(0.06) | benign(0.062) | TCGA-D1-A0ZO-01 | Endometrium | uterine corpus endometrioid carcinoma | Female | >=65 | I/II | Unknown | Unknown | SD | |
| GLTP | SNV | Missense_Mutation | novel | c.473N>G | p.Lys158Arg | p.K158R | Q9NZD2 | protein_coding | tolerated(0.66) | benign(0.005) | TCGA-DI-A1NO-01 | Endometrium | uterine corpus endometrioid carcinoma | Female | >=65 | III/IV | Unknown | Unknown | PD |
| Page: 1 2 |
Top |
Related drugs of malignant transformation related genes |
| Identification of chemicals and drugs interact with genes involved in malignant transfromation |
| (DGIdb 4.0) |
| Entrez ID | Symbol | Category | Interaction Types | Drug Claim Name | Drug Name | PMIDs |
| Page: 1 |

Copyright 2023-Present -The University of Texas Health Science Center at Houston |