
|
|||||
|
 | |
| |
| |
| |
| |
| |
|
Gene: GLS2 |
Gene summary for GLS2 |
| Gene information | Species | Human | Gene symbol | GLS2 | Gene ID | 27165 |
| Gene name | glutaminase 2 | |
| Gene Alias | GA | |
| Cytomap | 12q13.3 | |
| Gene Type | protein-coding | GO ID | GO:0006082 | UniProtAcc | A0A087X004 |
Top |
Malignant transformation analysis |
| Identification of the aberrant gene expression in precancerous and cancerous lesions by comparing the gene expression of stem-like cells in diseased tissues with normal stem cells |
| Entrez ID | Symbol | Replicates | Species | Organ | Tissue | Adj P-value | Log2FC | Malignancy |
| 27165 | GLS2 | P2T-E | Human | Esophagus | ESCC | 8.40e-04 | 1.09e-01 | 0.1177 |
| 27165 | GLS2 | P4T-E | Human | Esophagus | ESCC | 3.13e-03 | 1.10e-01 | 0.1323 |
| 27165 | GLS2 | P12T-E | Human | Esophagus | ESCC | 8.40e-04 | 9.81e-02 | 0.1122 |
| 27165 | GLS2 | P16T-E | Human | Esophagus | ESCC | 3.35e-02 | 3.09e-02 | 0.1153 |
| 27165 | GLS2 | P23T-E | Human | Esophagus | ESCC | 5.77e-06 | 1.51e-01 | 0.108 |
| 27165 | GLS2 | P26T-E | Human | Esophagus | ESCC | 6.56e-15 | 3.41e-01 | 0.1276 |
| 27165 | GLS2 | P27T-E | Human | Esophagus | ESCC | 4.12e-11 | 2.37e-01 | 0.1055 |
| 27165 | GLS2 | P28T-E | Human | Esophagus | ESCC | 1.78e-03 | 8.39e-02 | 0.1149 |
| 27165 | GLS2 | P48T-E | Human | Esophagus | ESCC | 1.78e-03 | 1.09e-01 | 0.0959 |
| 27165 | GLS2 | P52T-E | Human | Esophagus | ESCC | 7.90e-03 | 8.70e-02 | 0.1555 |
| 27165 | GLS2 | P54T-E | Human | Esophagus | ESCC | 1.35e-04 | 1.38e-01 | 0.0975 |
| 27165 | GLS2 | P57T-E | Human | Esophagus | ESCC | 7.90e-03 | 7.60e-02 | 0.0926 |
| 27165 | GLS2 | P74T-E | Human | Esophagus | ESCC | 3.40e-23 | 5.27e-01 | 0.1479 |
| 27165 | GLS2 | P83T-E | Human | Esophagus | ESCC | 2.98e-08 | 2.12e-01 | 0.1738 |
| 27165 | GLS2 | P107T-E | Human | Esophagus | ESCC | 2.19e-08 | 9.09e-02 | 0.171 |
| 27165 | GLS2 | P128T-E | Human | Esophagus | ESCC | 3.62e-17 | 4.66e-01 | 0.1241 |
| 27165 | GLS2 | P130T-E | Human | Esophagus | ESCC | 1.15e-45 | 8.62e-01 | 0.1676 |
| Page: 1 |
| Tissue | Expression Dynamics | Abbreviation |
| Esophagus | 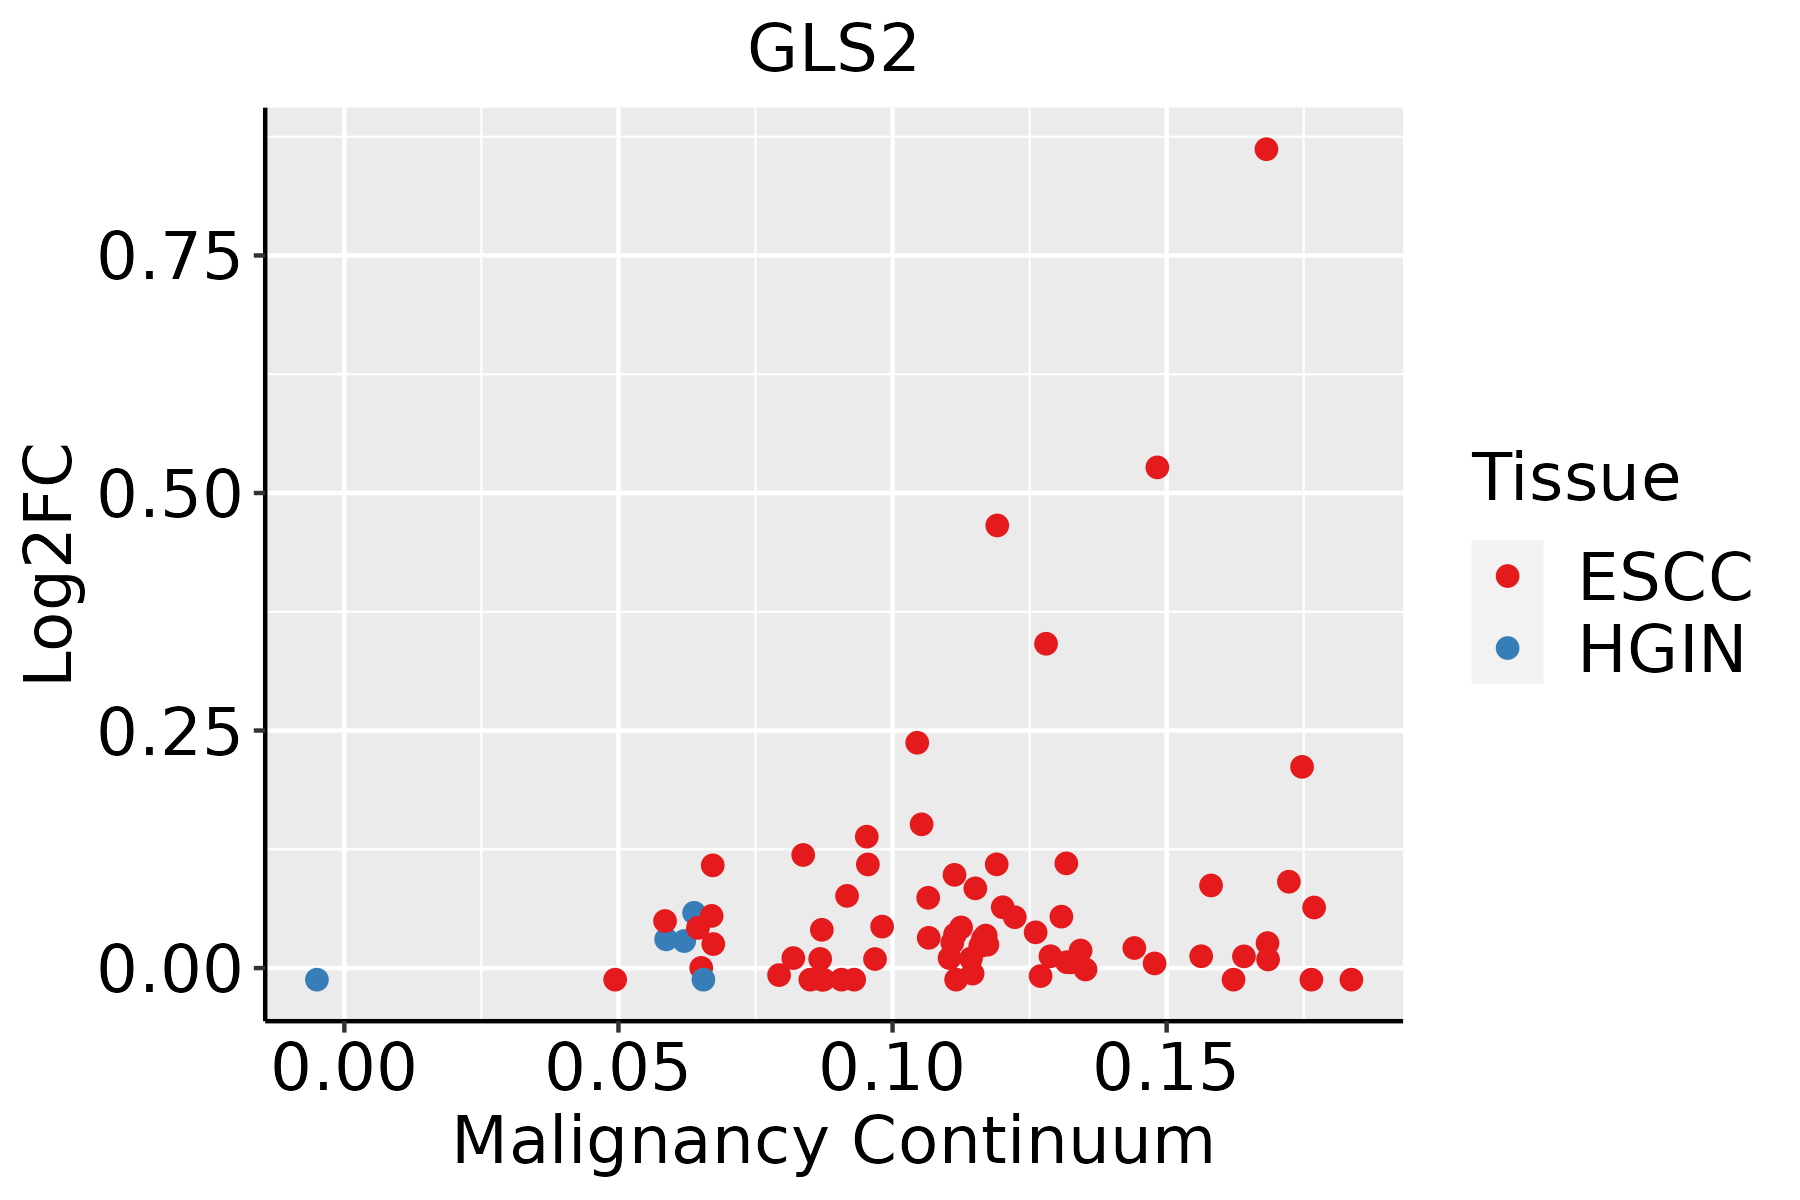 | ESCC: Esophageal squamous cell carcinoma |
| HGIN: High-grade intraepithelial neoplasias | ||
| LGIN: Low-grade intraepithelial neoplasias |
| ∗log2FC in expression of this searched gene in stem-like cells from each diseased tissue sample relative to stem-like cells in normal samples in each tissue plotted against the malignancy continuum. Samples are colored based on if they are from different disease stage. |
Top |
Malignant transformation related pathway analysis |
| Find out the enriched GO biological processes and KEGG pathways involved in transition from healthy to precancer to cancer |
| Tissue | Disease Stage | Enriched GO biological Processes |
| Colorectum | AD |  |
| Colorectum | SER |  |
| Colorectum | MSS |  |
| Colorectum | MSI-H |  |
| Colorectum | FAP |  |
| ∗Top 15 enriched GO BP terms are showed in the bar plot of each disease state in each tissue. Each row represents a significant GO biological process which is colored according to the -log10(p.adjust). |
| Page: 1 2 3 4 5 6 7 8 9 |
| GO ID | Tissue | Disease Stage | Description | Gene Ratio | Bg Ratio | pvalue | p.adjust | Count |
| GO:00086525 | Esophagus | ESCC | cellular amino acid biosynthetic process | 51/8552 | 76/18723 | 1.30e-04 | 8.88e-04 | 51 |
| GO:007259318 | Esophagus | ESCC | reactive oxygen species metabolic process | 137/8552 | 239/18723 | 1.82e-04 | 1.16e-03 | 137 |
| GO:00463948 | Esophagus | ESCC | carboxylic acid biosynthetic process | 175/8552 | 314/18723 | 1.98e-04 | 1.26e-03 | 175 |
| GO:00160538 | Esophagus | ESCC | organic acid biosynthetic process | 175/8552 | 316/18723 | 3.04e-04 | 1.82e-03 | 175 |
| GO:19016075 | Esophagus | ESCC | alpha-amino acid biosynthetic process | 45/8552 | 68/18723 | 5.13e-04 | 2.84e-03 | 45 |
| GO:00442827 | Esophagus | ESCC | small molecule catabolic process | 201/8552 | 376/18723 | 1.35e-03 | 6.41e-03 | 201 |
| GO:00436485 | Esophagus | ESCC | dicarboxylic acid metabolic process | 58/8552 | 96/18723 | 2.55e-03 | 1.09e-02 | 58 |
| Page: 1 |
| Pathway ID | Tissue | Disease Stage | Description | Gene Ratio | Bg Ratio | pvalue | p.adjust | qvalue | Count |
| Page: 1 |
Top |
Cell-cell communication analysis |
| Identification of potential cell-cell interactions between two cell types and their ligand-receptor pairs for different disease states |
| Ligand | Receptor | LRpair | Pathway | Tissue | Disease Stage |
| Page: 1 |
Top |
Single-cell gene regulatory network inference analysis |
| Find out the significant the regulons (TFs) and the target genes of each regulon across cell types for different disease states |
| TF | Cell Type | Tissue | Disease Stage | Target Gene | RSS | Regulon Activity |
| ∗The dot plots of a searched regulon are shown for all cell subpopulations in each disease state of each tissue based on the regulon specific score inferred using pySCENIC and by calculating the average expression. |
| Page: 1 |
Top |
Somatic mutation of malignant transformation related genes |
| Annotation of somatic variants for genes involved in malignant transformation |
| Hugo Symbol | Variant Class | Variant Classification | dbSNP RS | HGVSc | HGVSp | HGVSp Short | SWISSPROT | BIOTYPE | SIFT | PolyPhen | Tumor Sample Barcode | Tissue | Histology | Sex | Age | Stage | Therapy Types | Drugs | Outcome |
| GLS2 | SNV | Missense_Mutation | novel | c.511G>T | p.Val171Phe | p.V171F | Q9UI32 | protein_coding | deleterious(0) | benign(0.078) | TCGA-A7-A0DB-01 | Breast | breast invasive carcinoma | Female | <65 | I/II | Hormone Therapy | arimidex | SD |
| GLS2 | SNV | Missense_Mutation | novel | c.779N>A | p.Gly260Glu | p.G260E | Q9UI32 | protein_coding | tolerated(0.38) | benign(0.248) | TCGA-AC-A3TM-01 | Breast | breast invasive carcinoma | Female | <65 | III/IV | Chemotherapy | cytoxan | CR |
| GLS2 | SNV | Missense_Mutation | novel | c.299G>C | p.Gly100Ala | p.G100A | Q9UI32 | protein_coding | deleterious(0) | probably_damaging(0.982) | TCGA-EA-A3HU-01 | Cervix | cervical & endocervical cancer | Female | <65 | I/II | Unknown | Unknown | SD |
| GLS2 | SNV | Missense_Mutation | c.472N>C | p.Glu158Gln | p.E158Q | Q9UI32 | protein_coding | tolerated(0.75) | benign(0.001) | TCGA-JW-A5VJ-01 | Cervix | cervical & endocervical cancer | Female | <65 | I/II | Unknown | Unknown | PD | |
| GLS2 | SNV | Missense_Mutation | rs752285913 | c.257N>A | p.Arg86Gln | p.R86Q | Q9UI32 | protein_coding | tolerated(0.37) | benign(0.011) | TCGA-A6-6141-01 | Colorectum | colon adenocarcinoma | Male | <65 | I/II | Chemotherapy | 5-fu | SD |
| GLS2 | SNV | Missense_Mutation | rs756555927 | c.212G>A | p.Arg71His | p.R71H | Q9UI32 | protein_coding | tolerated(0.09) | possibly_damaging(0.629) | TCGA-AA-3663-01 | Colorectum | colon adenocarcinoma | Male | <65 | I/II | Unknown | Unknown | SD |
| GLS2 | SNV | Missense_Mutation | rs752271151 | c.1411C>T | p.Arg471Trp | p.R471W | Q9UI32 | protein_coding | deleterious(0) | possibly_damaging(0.53) | TCGA-AA-3710-01 | Colorectum | colon adenocarcinoma | Female | >=65 | I/II | Unknown | Unknown | SD |
| GLS2 | SNV | Missense_Mutation | novel | c.529N>T | p.Gly177Cys | p.G177C | Q9UI32 | protein_coding | deleterious(0.02) | probably_damaging(0.997) | TCGA-AA-3950-01 | Colorectum | colon adenocarcinoma | Female | >=65 | I/II | Unknown | Unknown | SD |
| GLS2 | SNV | Missense_Mutation | c.94C>A | p.Leu32Ile | p.L32I | Q9UI32 | protein_coding | tolerated_low_confidence(0.15) | possibly_damaging(0.899) | TCGA-AZ-6598-01 | Colorectum | colon adenocarcinoma | Female | >=65 | I/II | Unknown | Unknown | SD | |
| GLS2 | SNV | Missense_Mutation | rs750601118 | c.748N>T | p.Arg250Cys | p.R250C | Q9UI32 | protein_coding | deleterious(0.03) | probably_damaging(0.929) | TCGA-CK-5916-01 | Colorectum | colon adenocarcinoma | Female | >=65 | I/II | Unknown | Unknown | PD |
| Page: 1 2 3 4 5 |
Top |
Related drugs of malignant transformation related genes |
| Identification of chemicals and drugs interact with genes involved in malignant transfromation |
| (DGIdb 4.0) |
| Entrez ID | Symbol | Category | Interaction Types | Drug Claim Name | Drug Name | PMIDs |
| Page: 1 |

Copyright 2023-Present -The University of Texas Health Science Center at Houston |