
|
|||||
|
 | |
| |
| |
| |
| |
| |
|
Gene: GLS |
Gene summary for GLS |
| Gene information | Species | Human | Gene symbol | GLS | Gene ID | 2744 |
| Gene name | glutaminase | |
| Gene Alias | AAD20 | |
| Cytomap | 2q32.2 | |
| Gene Type | protein-coding | GO ID | GO:0001967 | UniProtAcc | O94925 |
Top |
Malignant transformation analysis |
| Identification of the aberrant gene expression in precancerous and cancerous lesions by comparing the gene expression of stem-like cells in diseased tissues with normal stem cells |
| Entrez ID | Symbol | Replicates | Species | Organ | Tissue | Adj P-value | Log2FC | Malignancy |
| 2744 | GLS | CA_HPV_1 | Human | Cervix | CC | 1.05e-03 | 2.87e-01 | 0.0264 |
| 2744 | GLS | CCI_2 | Human | Cervix | CC | 7.07e-04 | 7.85e-01 | 0.5249 |
| 2744 | GLS | CCI_3 | Human | Cervix | CC | 8.19e-03 | 6.09e-01 | 0.516 |
| 2744 | GLS | L1 | Human | Cervix | CC | 4.21e-02 | -1.29e-01 | 0.0802 |
| 2744 | GLS | HTA11_3410_2000001011 | Human | Colorectum | AD | 5.66e-10 | -4.54e-01 | 0.0155 |
| 2744 | GLS | HTA11_3361_2000001011 | Human | Colorectum | AD | 1.55e-03 | -4.57e-01 | -0.1207 |
| 2744 | GLS | HTA11_696_2000001011 | Human | Colorectum | AD | 3.52e-09 | -3.77e-01 | -0.1464 |
| 2744 | GLS | HTA11_866_2000001011 | Human | Colorectum | AD | 1.37e-07 | -3.47e-01 | -0.1001 |
| 2744 | GLS | HTA11_10711_2000001011 | Human | Colorectum | AD | 1.55e-02 | -4.13e-01 | 0.0338 |
| 2744 | GLS | HTA11_7696_3000711011 | Human | Colorectum | AD | 1.41e-03 | -2.72e-01 | 0.0674 |
| 2744 | GLS | HTA11_99999965062_69753 | Human | Colorectum | MSI-H | 3.32e-06 | 1.24e+00 | 0.3487 |
| 2744 | GLS | A001-C-207 | Human | Colorectum | FAP | 3.00e-02 | -8.38e-02 | 0.1278 |
| 2744 | GLS | A015-C-203 | Human | Colorectum | FAP | 7.28e-31 | -4.31e-01 | -0.1294 |
| 2744 | GLS | A015-C-204 | Human | Colorectum | FAP | 1.24e-03 | -1.75e-01 | -0.0228 |
| 2744 | GLS | A014-C-040 | Human | Colorectum | FAP | 3.27e-03 | -3.70e-01 | -0.1184 |
| 2744 | GLS | A002-C-201 | Human | Colorectum | FAP | 5.23e-11 | -3.10e-01 | 0.0324 |
| 2744 | GLS | A002-C-203 | Human | Colorectum | FAP | 4.51e-04 | -1.20e-01 | 0.2786 |
| 2744 | GLS | A001-C-119 | Human | Colorectum | FAP | 3.27e-09 | -4.00e-01 | -0.1557 |
| 2744 | GLS | A001-C-108 | Human | Colorectum | FAP | 2.43e-17 | -2.29e-01 | -0.0272 |
| 2744 | GLS | A002-C-205 | Human | Colorectum | FAP | 6.19e-18 | -4.25e-01 | -0.1236 |
| Page: 1 2 3 4 5 6 7 8 9 10 |
| Tissue | Expression Dynamics | Abbreviation |
| Cervix | 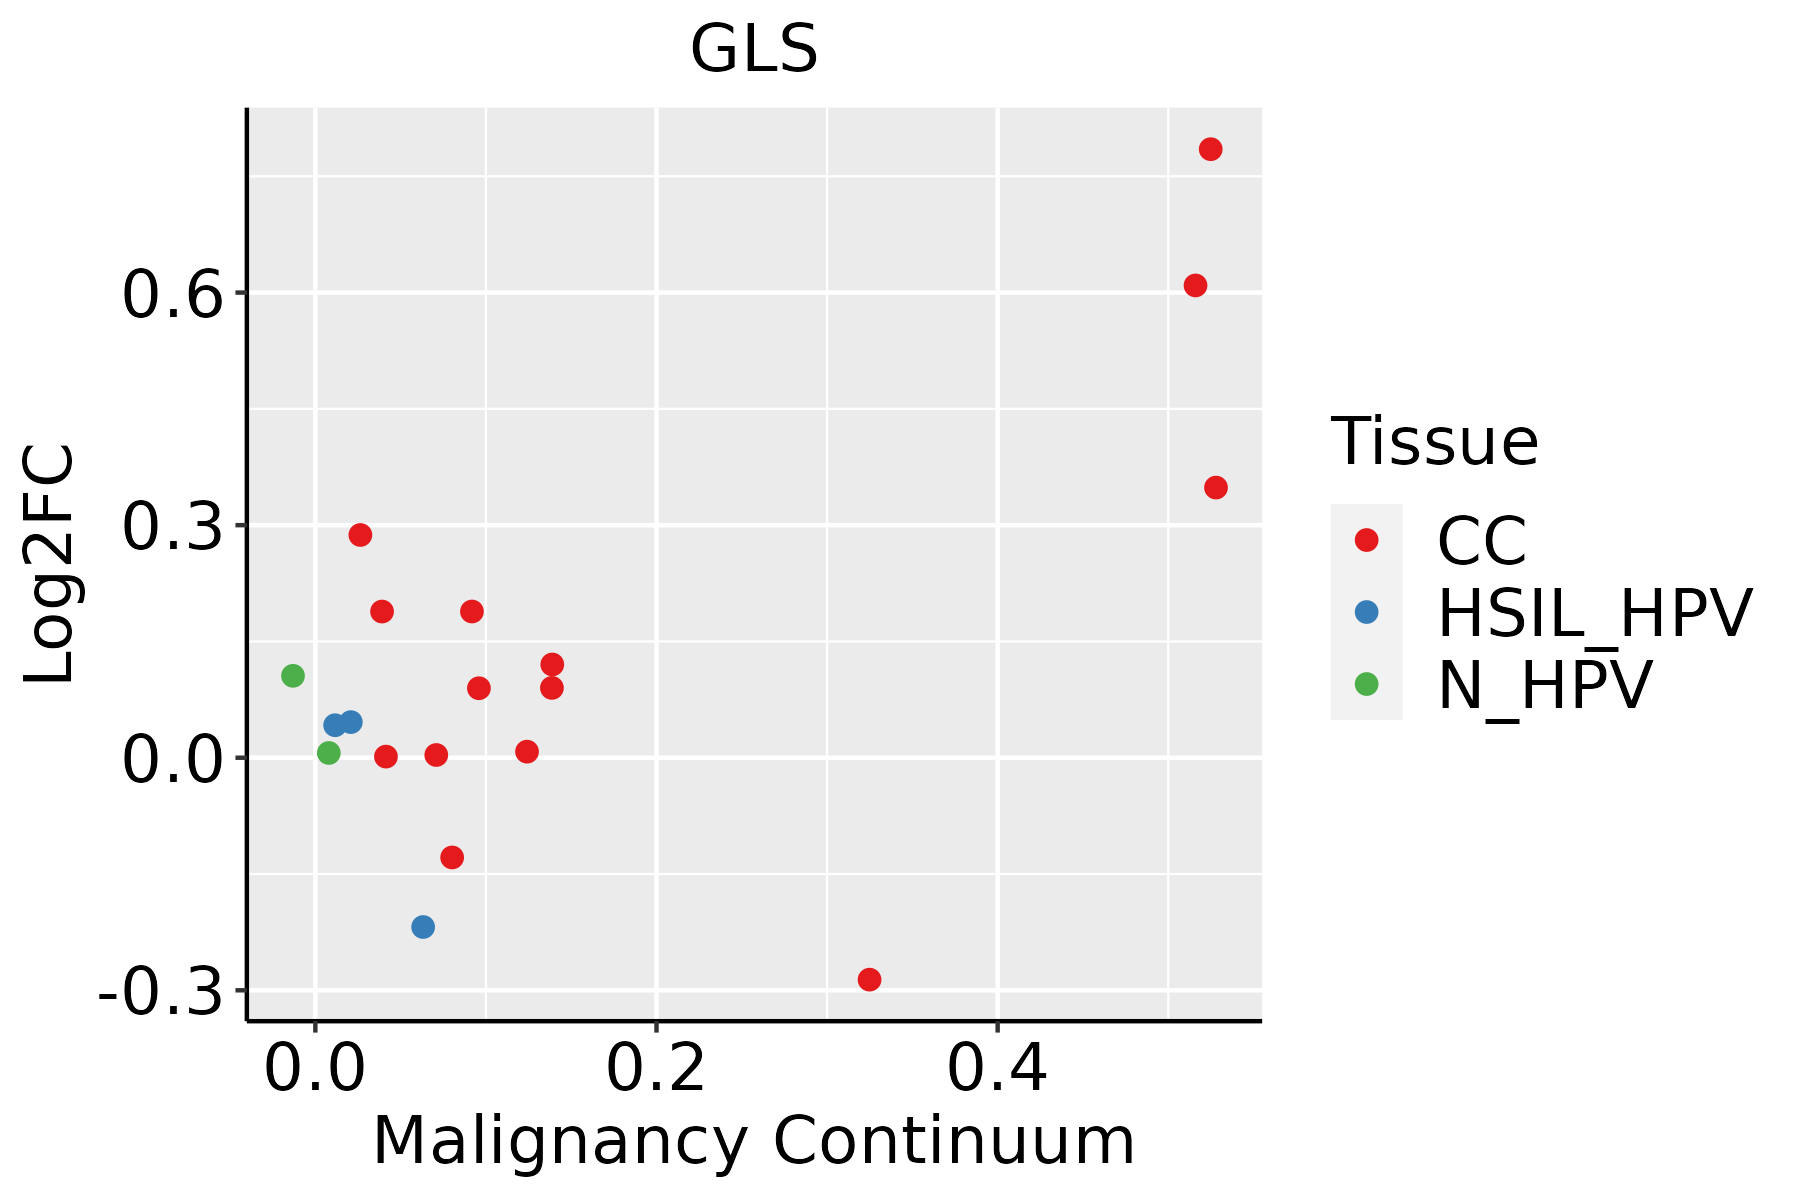 | CC: Cervix cancer |
| HSIL_HPV: HPV-infected high-grade squamous intraepithelial lesions | ||
| N_HPV: HPV-infected normal cervix | ||
| Colorectum (GSE201348) | 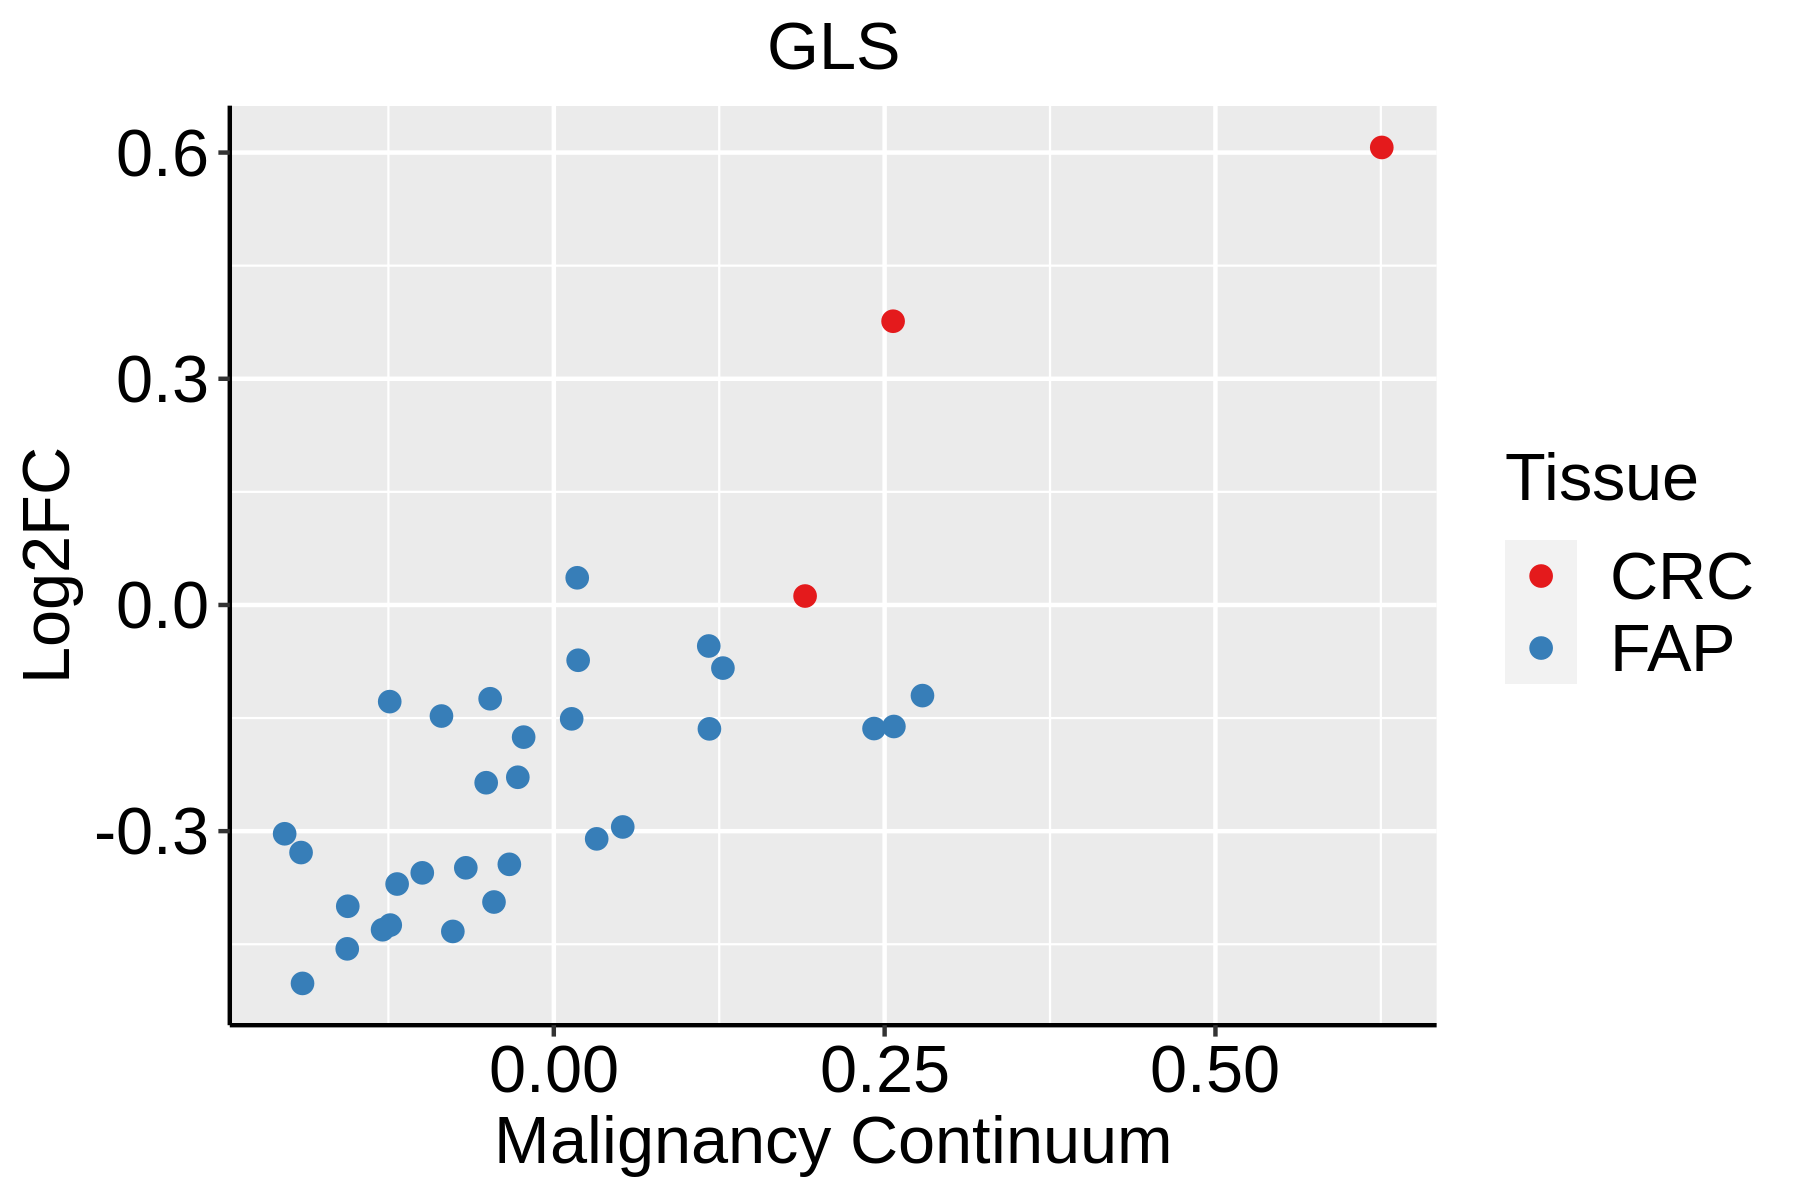 | FAP: Familial adenomatous polyposis |
| CRC: Colorectal cancer | ||
| Colorectum (HTA11) | 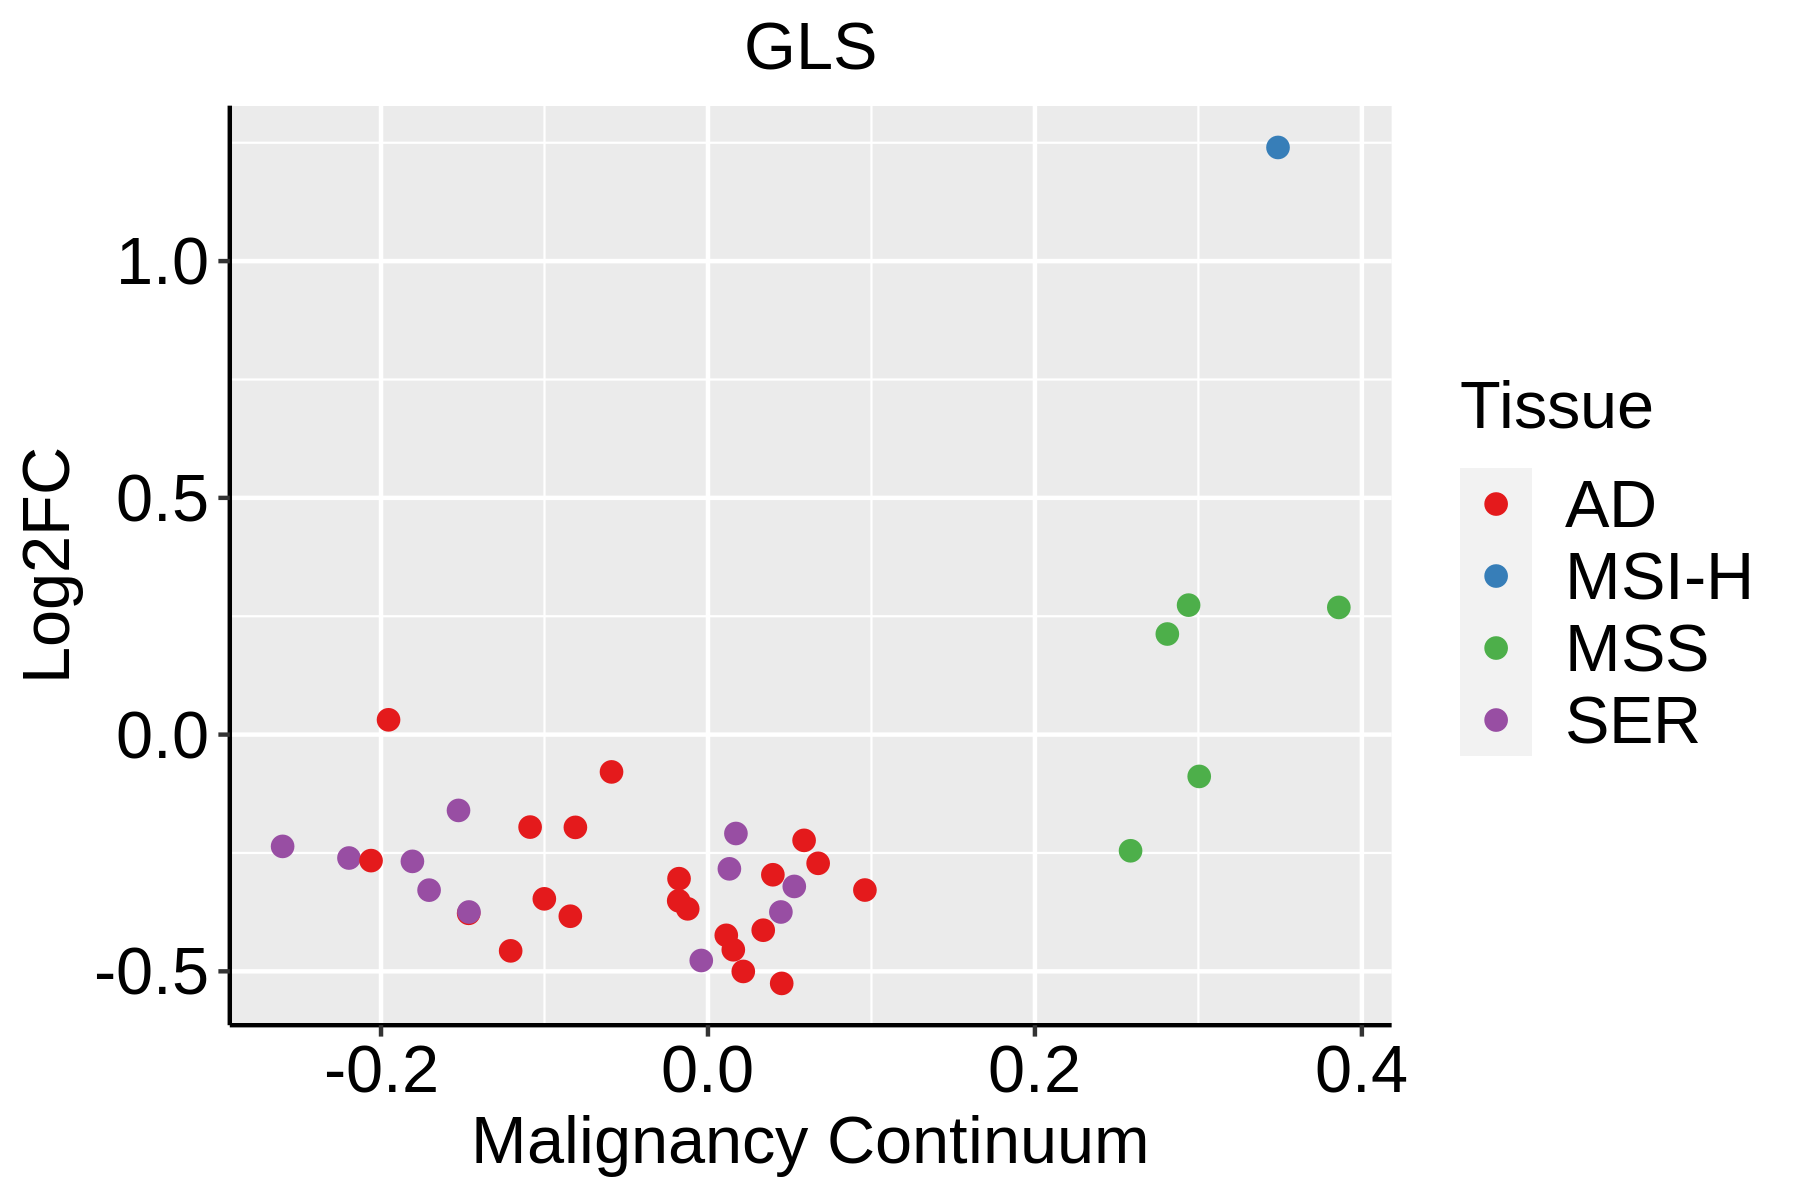 | AD: Adenomas |
| SER: Sessile serrated lesions | ||
| MSI-H: Microsatellite-high colorectal cancer | ||
| MSS: Microsatellite stable colorectal cancer | ||
| Esophagus |  | ESCC: Esophageal squamous cell carcinoma |
| HGIN: High-grade intraepithelial neoplasias | ||
| LGIN: Low-grade intraepithelial neoplasias | ||
| GC |  | CAG: Chronic atrophic gastritis |
| CAG with IM: Chronic atrophic gastritis with intestinal metaplasia | ||
| CSG: Chronic superficial gastritis | ||
| GC: Gastric cancer | ||
| SIM: Severe intestinal metaplasia | ||
| WIM: Wild intestinal metaplasia | ||
| Lung | 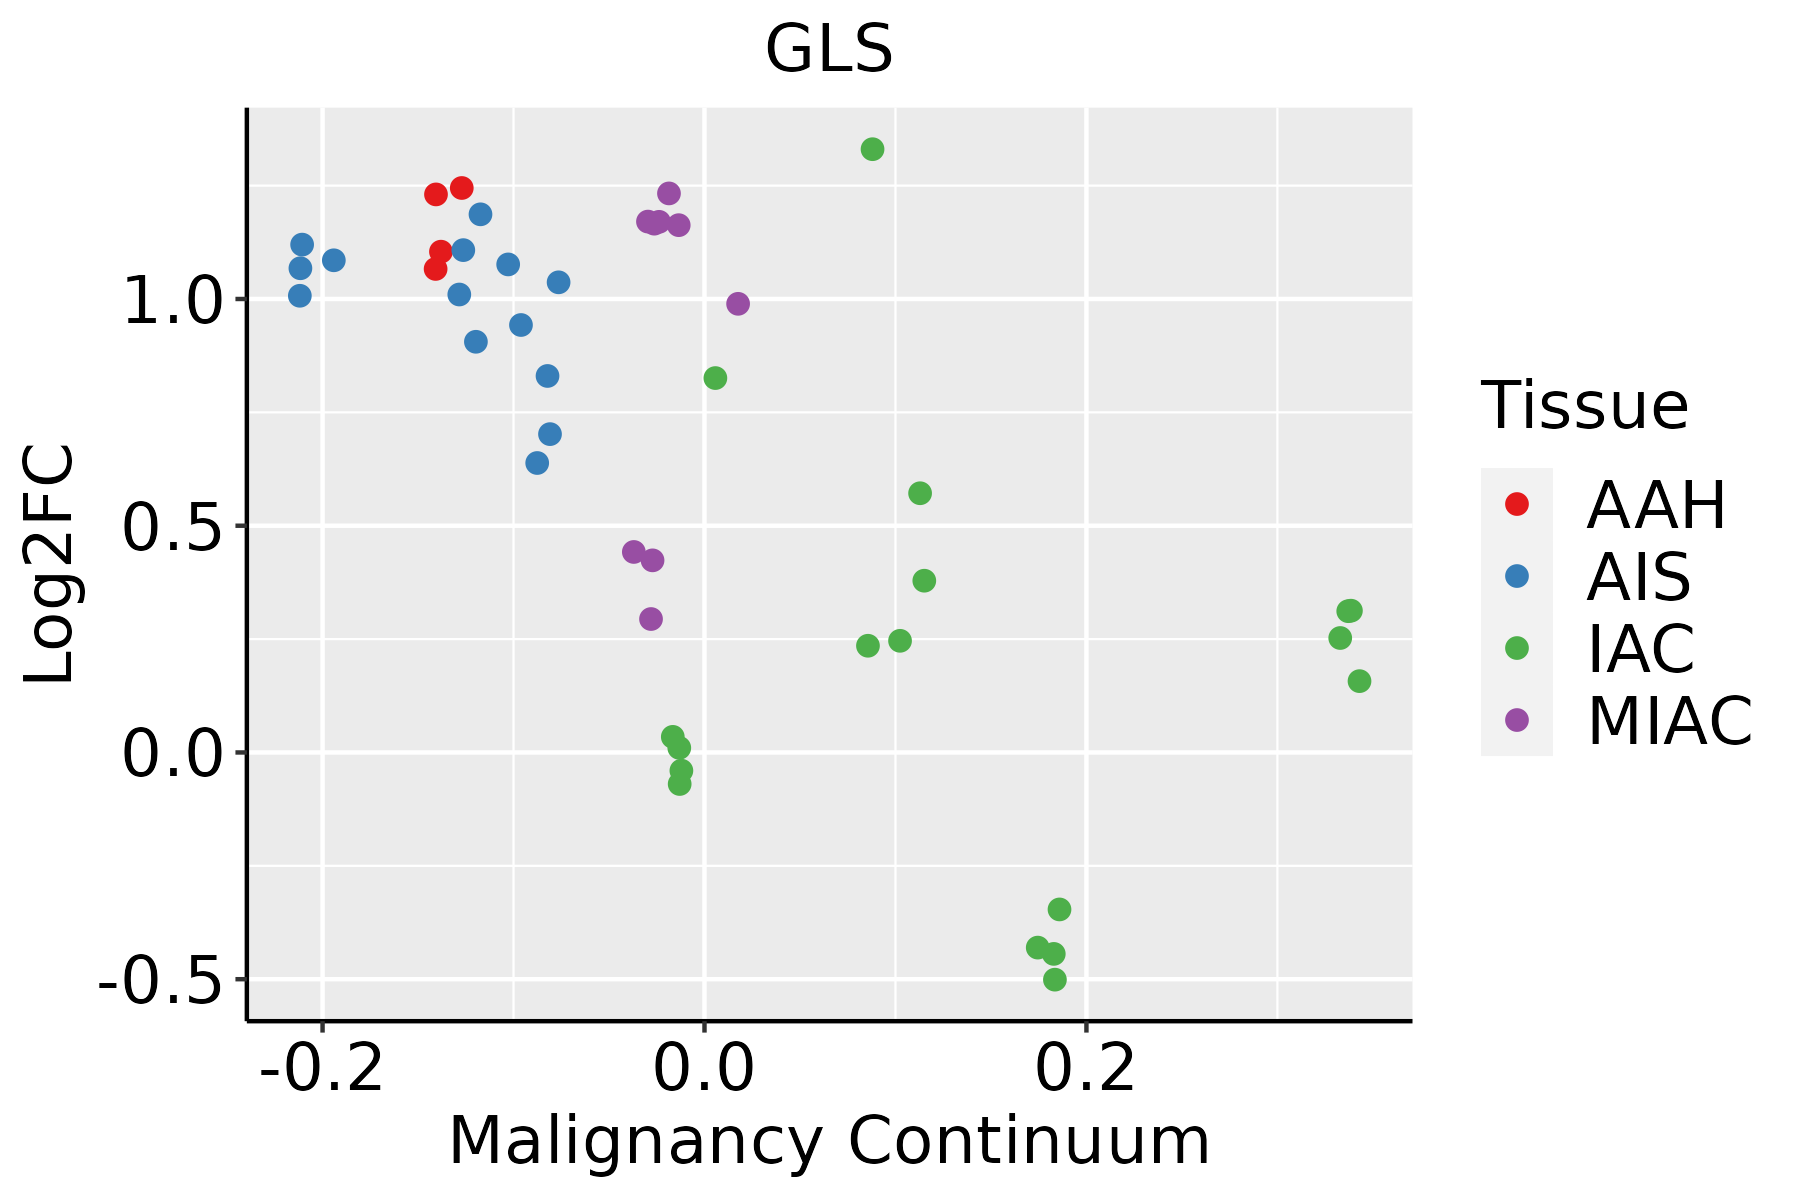 | AAH: Atypical adenomatous hyperplasia |
| AIS: Adenocarcinoma in situ | ||
| IAC: Invasive lung adenocarcinoma | ||
| MIA: Minimally invasive adenocarcinoma | ||
| Oral Cavity | 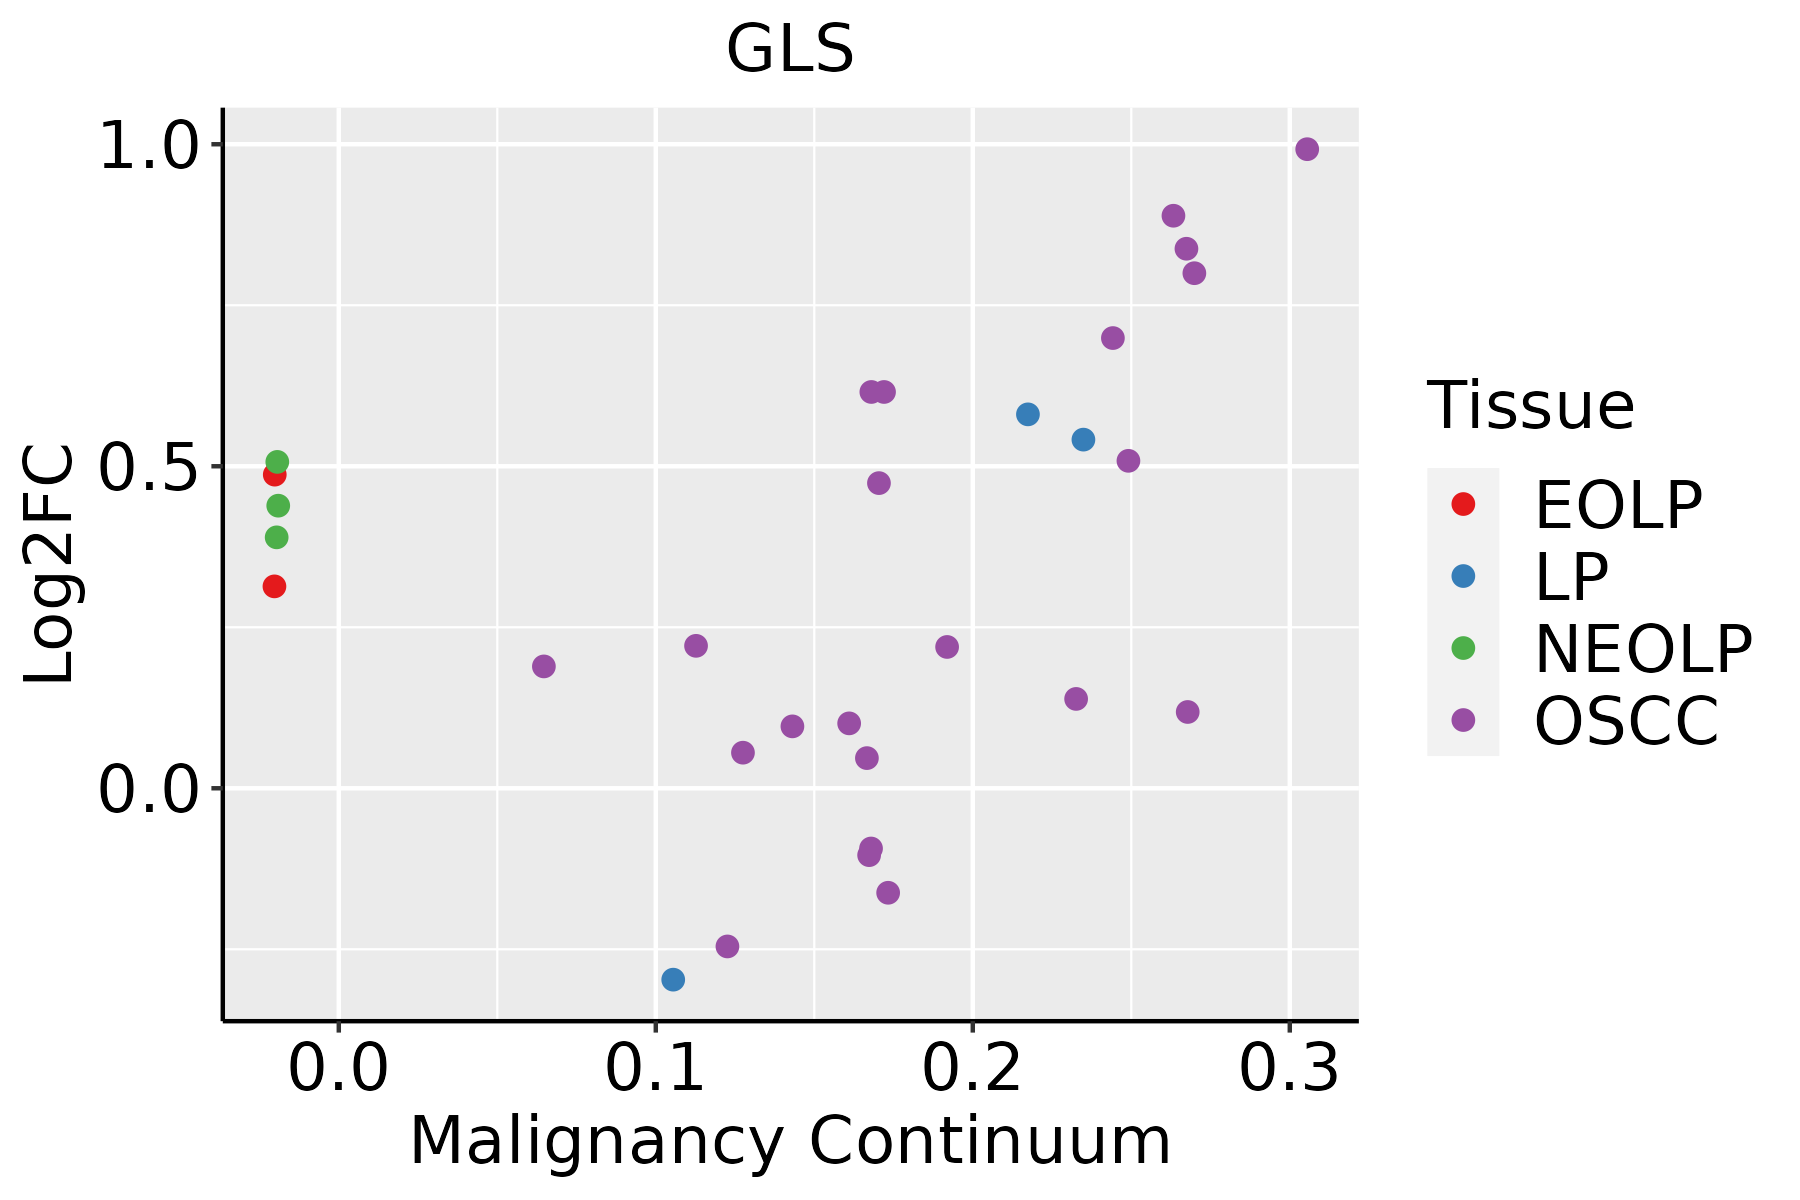 | EOLP: Erosive Oral lichen planus |
| LP: leukoplakia | ||
| NEOLP: Non-erosive oral lichen planus | ||
| OSCC: Oral squamous cell carcinoma | ||
| Prostate | 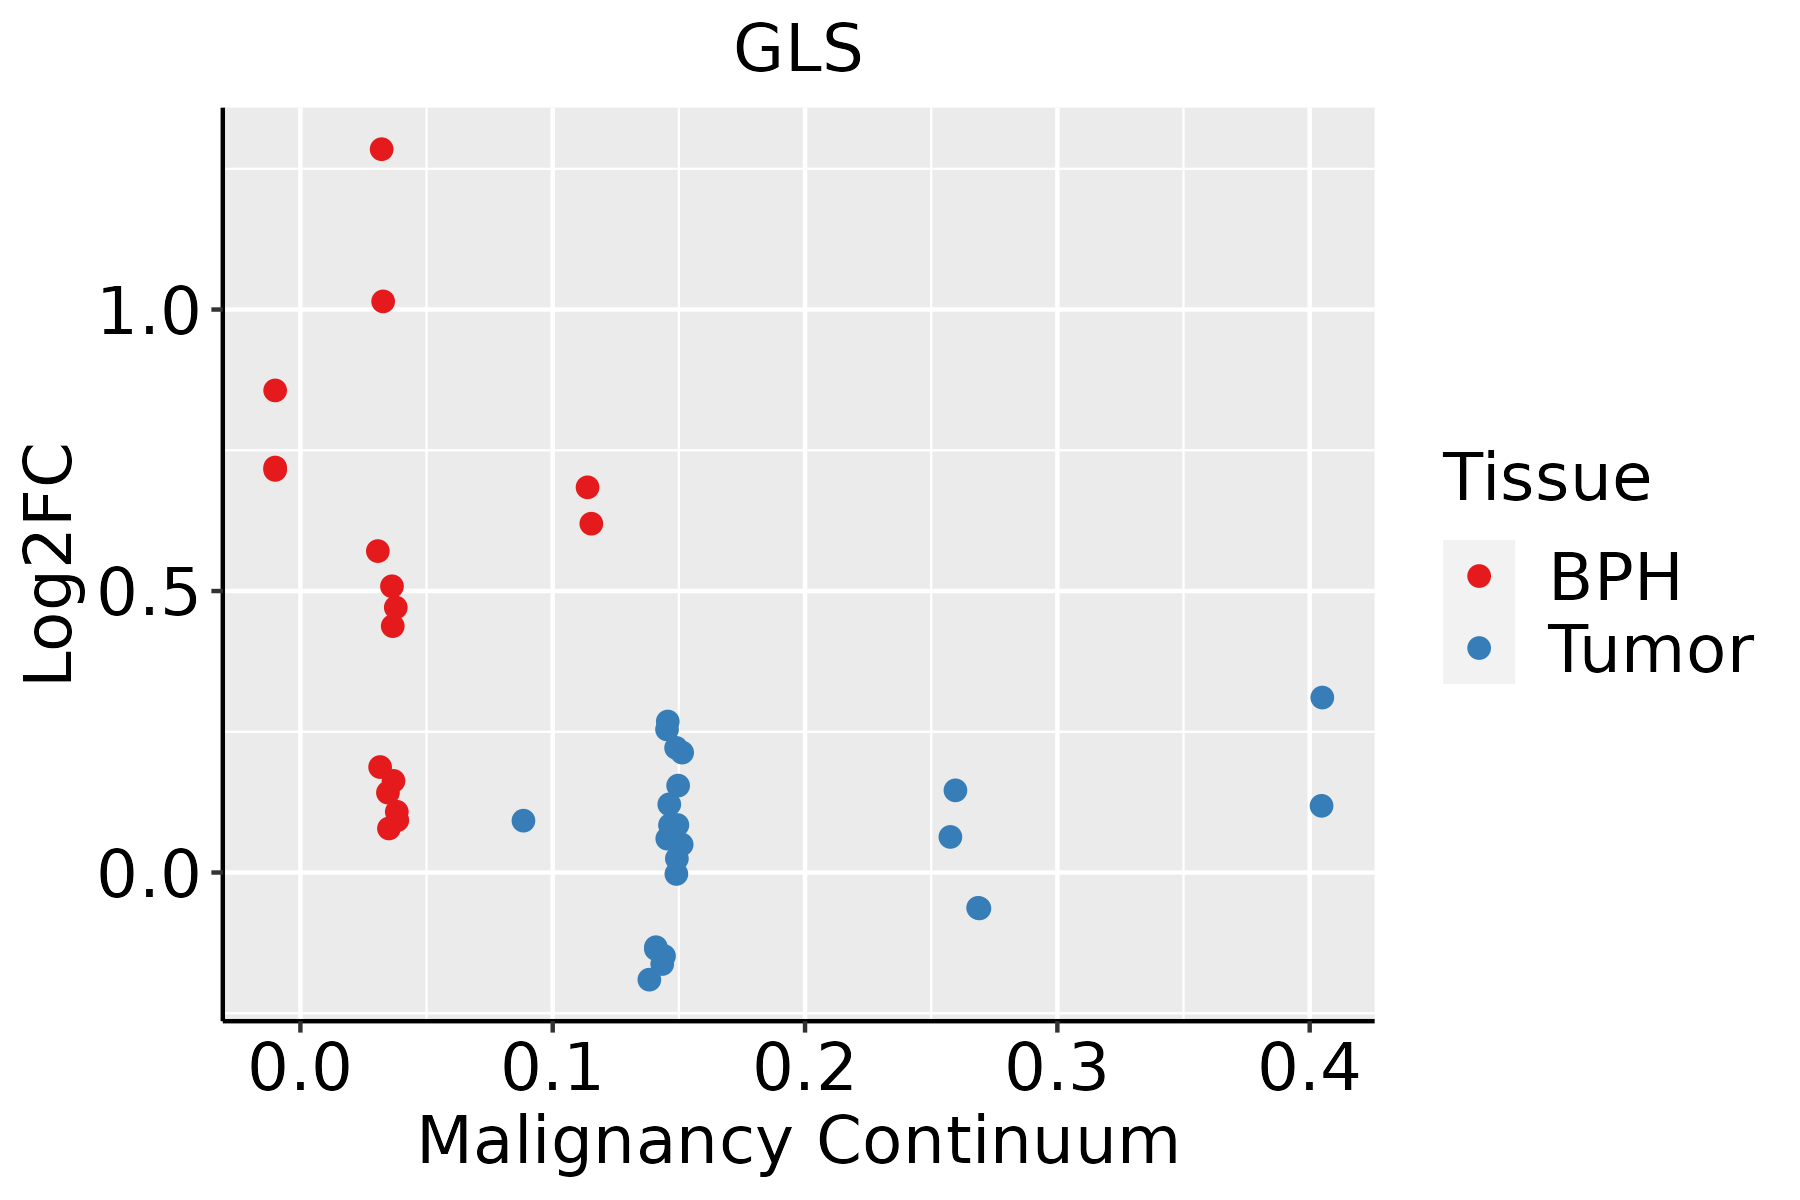 | BPH: Benign Prostatic Hyperplasia |
| Skin | 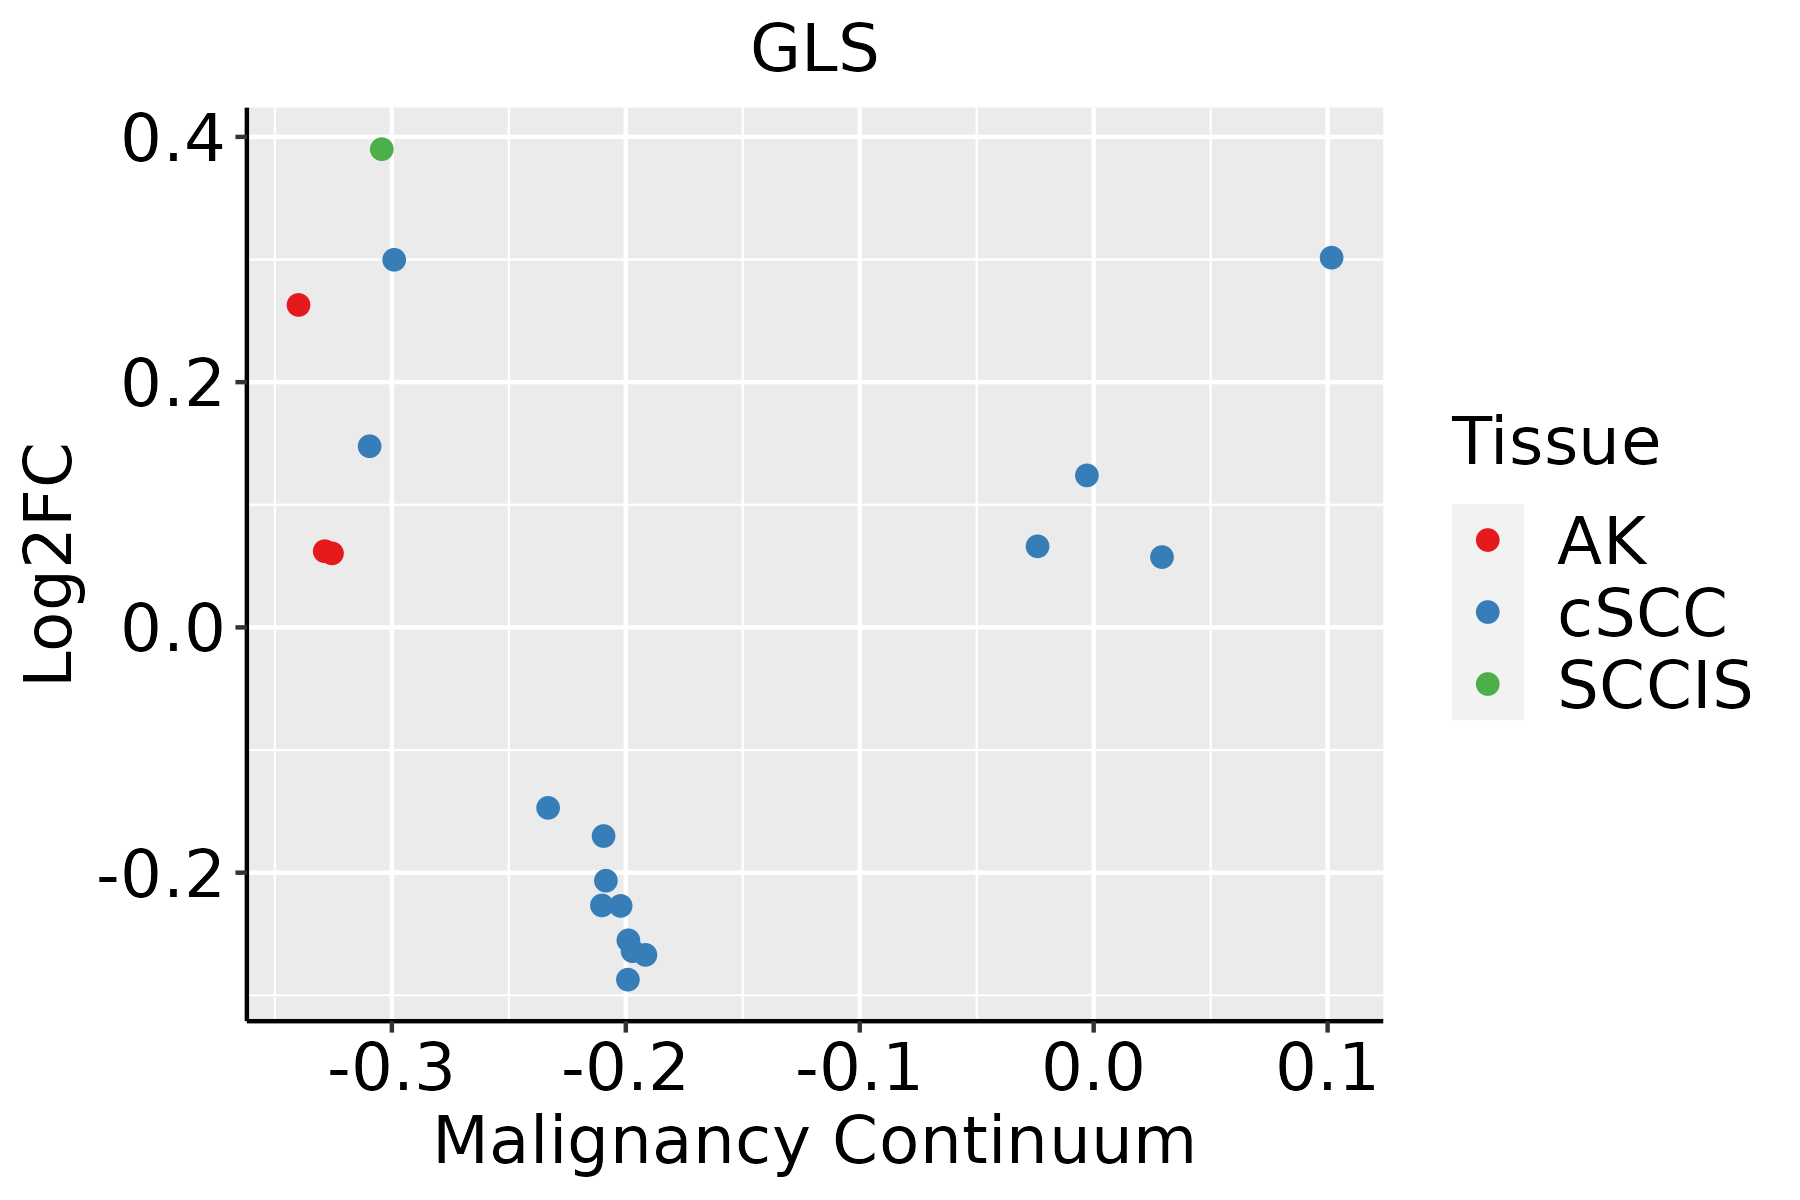 | AK: Actinic keratosis |
| cSCC: Cutaneous squamous cell carcinoma | ||
| SCCIS:squamous cell carcinoma in situ | ||
| Thyroid | 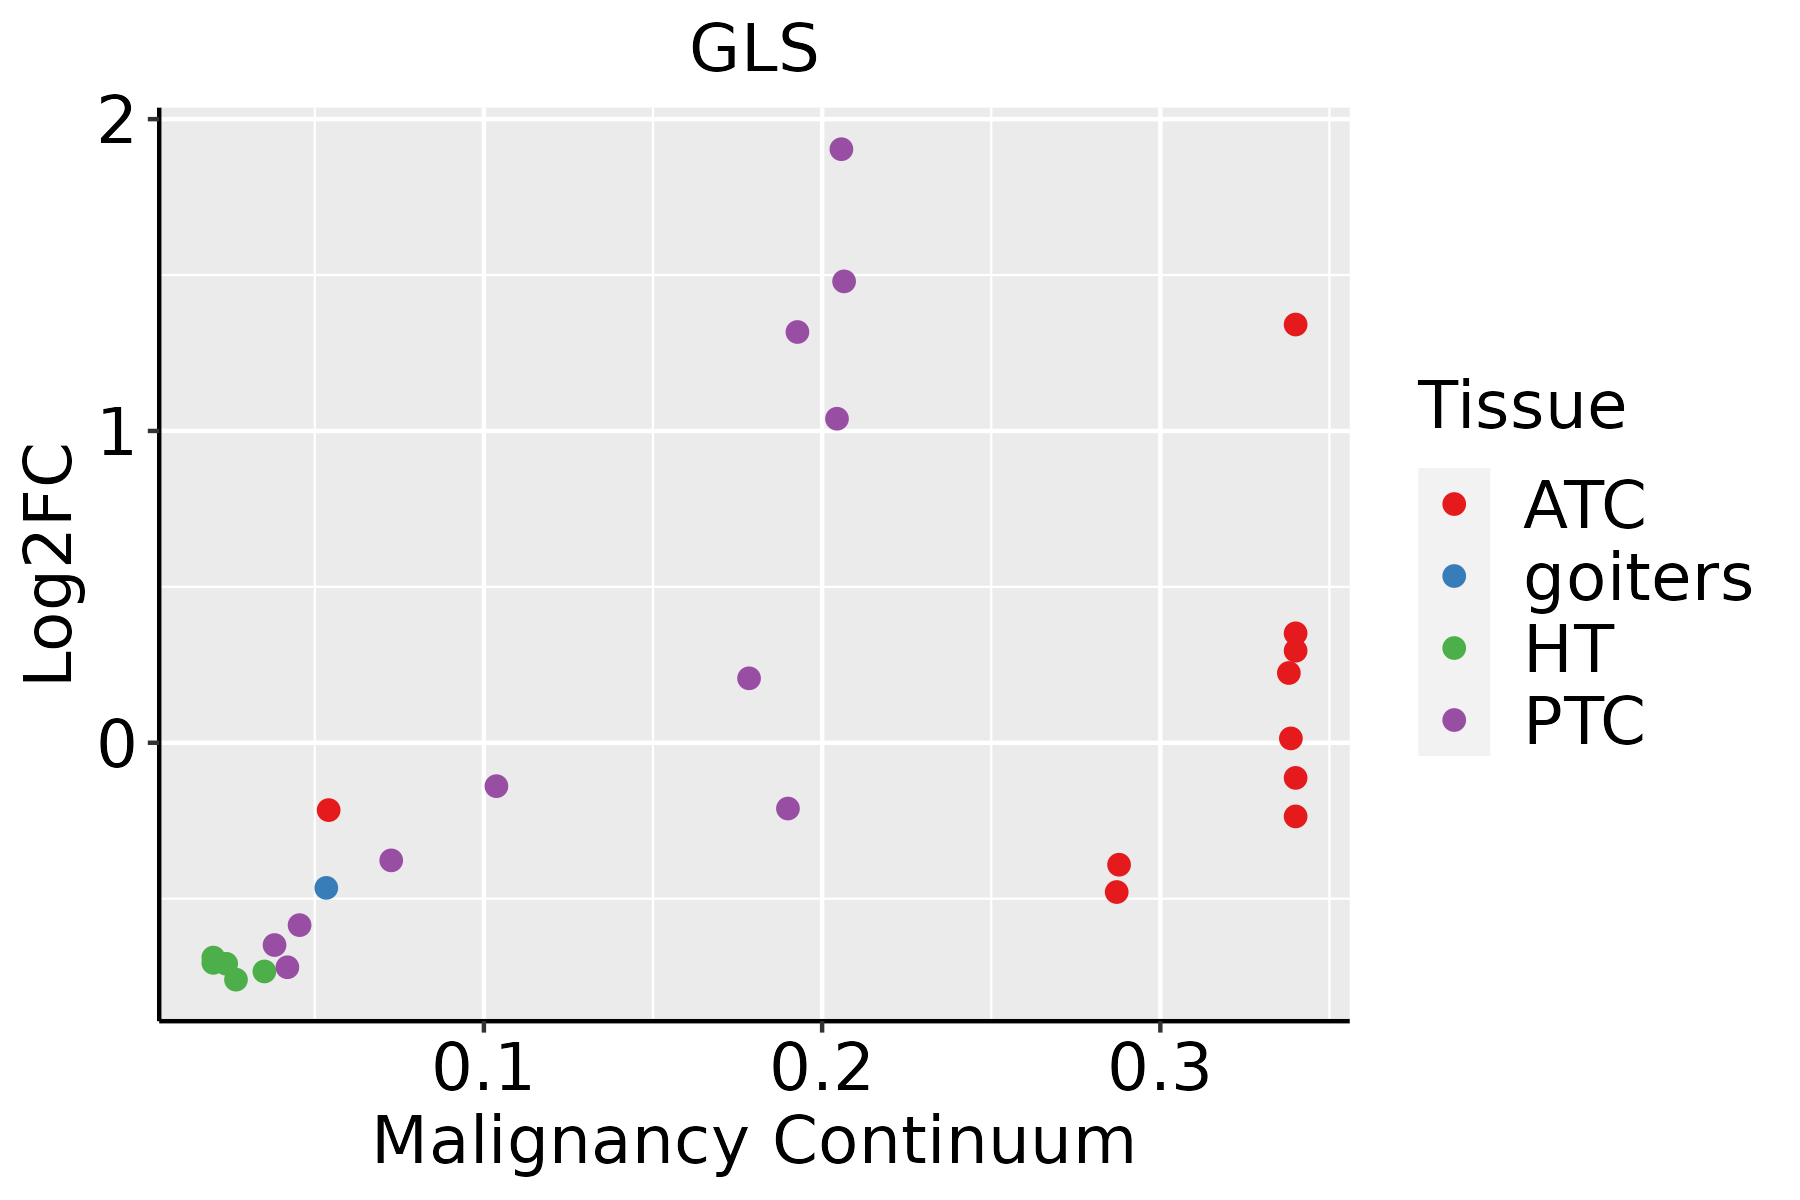 | ATC: Anaplastic thyroid cancer |
| HT: Hashimoto's thyroiditis | ||
| PTC: Papillary thyroid cancer |
| ∗log2FC in expression of this searched gene in stem-like cells from each diseased tissue sample relative to stem-like cells in normal samples in each tissue plotted against the malignancy continuum. Samples are colored based on if they are from different disease stage. |
Top |
Malignant transformation related pathway analysis |
| Find out the enriched GO biological processes and KEGG pathways involved in transition from healthy to precancer to cancer |
| Tissue | Disease Stage | Enriched GO biological Processes |
| Colorectum | AD |  |
| Colorectum | SER |  |
| Colorectum | MSS |  |
| Colorectum | MSI-H |  |
| Colorectum | FAP |  |
| ∗Top 15 enriched GO BP terms are showed in the bar plot of each disease state in each tissue. Each row represents a significant GO biological process which is colored according to the -log10(p.adjust). |
| Page: 1 2 3 4 5 6 7 8 9 |
| GO ID | Tissue | Disease Stage | Description | Gene Ratio | Bg Ratio | pvalue | p.adjust | Count |
| GO:00060919 | Cervix | CC | generation of precursor metabolites and energy | 105/2311 | 490/18723 | 7.40e-09 | 6.61e-07 | 105 |
| GO:000609114 | Cervix | HSIL_HPV | generation of precursor metabolites and energy | 32/737 | 490/18723 | 3.69e-03 | 3.27e-02 | 32 |
| GO:000609124 | Cervix | N_HPV | generation of precursor metabolites and energy | 40/534 | 490/18723 | 2.59e-09 | 7.88e-07 | 40 |
| GO:0044282 | Colorectum | AD | small molecule catabolic process | 118/3918 | 376/18723 | 1.05e-06 | 3.55e-05 | 118 |
| GO:0016054 | Colorectum | AD | organic acid catabolic process | 73/3918 | 240/18723 | 3.20e-04 | 3.81e-03 | 73 |
| GO:0043648 | Colorectum | AD | dicarboxylic acid metabolic process | 34/3918 | 96/18723 | 7.22e-04 | 7.28e-03 | 34 |
| GO:0046395 | Colorectum | AD | carboxylic acid catabolic process | 70/3918 | 236/18723 | 9.06e-04 | 8.71e-03 | 70 |
| GO:0006520 | Colorectum | AD | cellular amino acid metabolic process | 81/3918 | 284/18723 | 1.37e-03 | 1.19e-02 | 81 |
| GO:1901605 | Colorectum | MSI-H | alpha-amino acid metabolic process | 26/1319 | 195/18723 | 1.26e-03 | 2.02e-02 | 26 |
| GO:0008652 | Colorectum | MSI-H | cellular amino acid biosynthetic process | 13/1319 | 76/18723 | 2.35e-03 | 3.12e-02 | 13 |
| GO:1901607 | Colorectum | MSI-H | alpha-amino acid biosynthetic process | 12/1319 | 68/18723 | 2.60e-03 | 3.41e-02 | 12 |
| GO:00463941 | Colorectum | MSI-H | carboxylic acid biosynthetic process | 36/1319 | 314/18723 | 2.68e-03 | 3.48e-02 | 36 |
| GO:00160531 | Colorectum | MSI-H | organic acid biosynthetic process | 36/1319 | 316/18723 | 2.98e-03 | 3.78e-02 | 36 |
| GO:00442823 | Colorectum | FAP | small molecule catabolic process | 77/2622 | 376/18723 | 3.25e-04 | 4.16e-03 | 77 |
| GO:00160543 | Colorectum | FAP | organic acid catabolic process | 50/2622 | 240/18723 | 2.30e-03 | 1.85e-02 | 50 |
| GO:00436481 | Colorectum | FAP | dicarboxylic acid metabolic process | 24/2622 | 96/18723 | 2.88e-03 | 2.20e-02 | 24 |
| GO:00463951 | Colorectum | FAP | carboxylic acid catabolic process | 48/2622 | 236/18723 | 4.53e-03 | 3.08e-02 | 48 |
| GO:000609110 | Endometrium | AEH | generation of precursor metabolites and energy | 121/2100 | 490/18723 | 1.65e-17 | 8.23e-15 | 121 |
| GO:000609115 | Endometrium | EEC | generation of precursor metabolites and energy | 125/2168 | 490/18723 | 3.76e-18 | 1.88e-15 | 125 |
| GO:000609120 | Esophagus | HGIN | generation of precursor metabolites and energy | 145/2587 | 490/18723 | 3.41e-20 | 2.04e-17 | 145 |
| Page: 1 2 3 4 5 |
| Pathway ID | Tissue | Disease Stage | Description | Gene Ratio | Bg Ratio | pvalue | p.adjust | qvalue | Count |
| hsa0523010 | Cervix | CC | Central carbon metabolism in cancer | 18/1267 | 70/8465 | 1.29e-02 | 3.87e-02 | 2.29e-02 | 18 |
| hsa0523013 | Cervix | CC | Central carbon metabolism in cancer | 18/1267 | 70/8465 | 1.29e-02 | 3.87e-02 | 2.29e-02 | 18 |
| hsa05230 | Colorectum | AD | Central carbon metabolism in cancer | 33/2092 | 70/8465 | 3.61e-05 | 3.19e-04 | 2.03e-04 | 33 |
| hsa04964 | Colorectum | AD | Proximal tubule bicarbonate reclamation | 11/2092 | 23/8465 | 1.35e-02 | 4.86e-02 | 3.10e-02 | 11 |
| hsa052301 | Colorectum | AD | Central carbon metabolism in cancer | 33/2092 | 70/8465 | 3.61e-05 | 3.19e-04 | 2.03e-04 | 33 |
| hsa049641 | Colorectum | AD | Proximal tubule bicarbonate reclamation | 11/2092 | 23/8465 | 1.35e-02 | 4.86e-02 | 3.10e-02 | 11 |
| hsa052306 | Colorectum | FAP | Central carbon metabolism in cancer | 23/1404 | 70/8465 | 6.12e-04 | 4.26e-03 | 2.59e-03 | 23 |
| hsa052307 | Colorectum | FAP | Central carbon metabolism in cancer | 23/1404 | 70/8465 | 6.12e-04 | 4.26e-03 | 2.59e-03 | 23 |
| hsa04724 | Colorectum | CRC | Glutamatergic synapse | 24/1091 | 115/8465 | 1.07e-02 | 4.74e-02 | 3.21e-02 | 24 |
| hsa047241 | Colorectum | CRC | Glutamatergic synapse | 24/1091 | 115/8465 | 1.07e-02 | 4.74e-02 | 3.21e-02 | 24 |
| hsa0523018 | Esophagus | ESCC | Central carbon metabolism in cancer | 50/4205 | 70/8465 | 1.70e-04 | 6.62e-04 | 3.39e-04 | 50 |
| hsa0523019 | Esophagus | ESCC | Central carbon metabolism in cancer | 50/4205 | 70/8465 | 1.70e-04 | 6.62e-04 | 3.39e-04 | 50 |
| hsa0523016 | Oral cavity | OSCC | Central carbon metabolism in cancer | 49/3704 | 70/8465 | 7.57e-06 | 3.59e-05 | 1.83e-05 | 49 |
| hsa0523017 | Oral cavity | OSCC | Central carbon metabolism in cancer | 49/3704 | 70/8465 | 7.57e-06 | 3.59e-05 | 1.83e-05 | 49 |
| hsa0523041 | Oral cavity | EOLP | Central carbon metabolism in cancer | 17/1218 | 70/8465 | 1.87e-02 | 4.75e-02 | 2.80e-02 | 17 |
| hsa0523051 | Oral cavity | EOLP | Central carbon metabolism in cancer | 17/1218 | 70/8465 | 1.87e-02 | 4.75e-02 | 2.80e-02 | 17 |
| hsa0523014 | Prostate | BPH | Central carbon metabolism in cancer | 23/1718 | 70/8465 | 9.13e-03 | 2.84e-02 | 1.76e-02 | 23 |
| hsa0523015 | Prostate | BPH | Central carbon metabolism in cancer | 23/1718 | 70/8465 | 9.13e-03 | 2.84e-02 | 1.76e-02 | 23 |
| hsa00220 | Stomach | GC | Arginine biosynthesis | 6/708 | 22/8465 | 7.81e-03 | 4.10e-02 | 2.88e-02 | 6 |
| hsa002201 | Stomach | GC | Arginine biosynthesis | 6/708 | 22/8465 | 7.81e-03 | 4.10e-02 | 2.88e-02 | 6 |
| Page: 1 |
Top |
Cell-cell communication analysis |
| Identification of potential cell-cell interactions between two cell types and their ligand-receptor pairs for different disease states |
| Ligand | Receptor | LRpair | Pathway | Tissue | Disease Stage |
| Page: 1 |
Top |
Single-cell gene regulatory network inference analysis |
| Find out the significant the regulons (TFs) and the target genes of each regulon across cell types for different disease states |
| TF | Cell Type | Tissue | Disease Stage | Target Gene | RSS | Regulon Activity |
| ∗The dot plots of a searched regulon are shown for all cell subpopulations in each disease state of each tissue based on the regulon specific score inferred using pySCENIC and by calculating the average expression. |
| Page: 1 |
Top |
Somatic mutation of malignant transformation related genes |
| Annotation of somatic variants for genes involved in malignant transformation |
| Hugo Symbol | Variant Class | Variant Classification | dbSNP RS | HGVSc | HGVSp | HGVSp Short | SWISSPROT | BIOTYPE | SIFT | PolyPhen | Tumor Sample Barcode | Tissue | Histology | Sex | Age | Stage | Therapy Types | Drugs | Outcome |
| GLS | SNV | Missense_Mutation | novel | c.603N>C | p.Lys201Asn | p.K201N | O94925 | protein_coding | deleterious(0.01) | possibly_damaging(0.647) | TCGA-AN-A046-01 | Breast | breast invasive carcinoma | Female | >=65 | I/II | Unknown | Unknown | SD |
| GLS | SNV | Missense_Mutation | c.1404N>A | p.Phe468Leu | p.F468L | O94925 | protein_coding | deleterious(0.05) | benign(0.106) | TCGA-FU-A3HZ-01 | Cervix | cervical & endocervical cancer | Female | <65 | I/II | Chemotherapy | cisplatin | CR | |
| GLS | SNV | Missense_Mutation | novel | c.481N>G | p.Thr161Ala | p.T161A | O94925 | protein_coding | tolerated(0.4) | benign(0) | TCGA-CA-6717-01 | Colorectum | colon adenocarcinoma | Male | <65 | I/II | Chemotherapy | oxaliplatin | CR |
| GLS | SNV | Missense_Mutation | c.1909N>G | p.Lys637Glu | p.K637E | O94925 | protein_coding | tolerated(0.73) | benign(0.01) | TCGA-G4-6628-01 | Colorectum | colon adenocarcinoma | Male | >=65 | I/II | Unknown | Unknown | SD | |
| GLS | insertion | Frame_Shift_Ins | novel | c.1085dupT | p.Leu362PhefsTer3 | p.L362Ffs*3 | O94925 | protein_coding | TCGA-F4-6703-01 | Colorectum | colon adenocarcinoma | Male | <65 | I/II | Unknown | Unknown | SD | ||
| GLS | SNV | Missense_Mutation | novel | c.1375N>G | p.Leu459Val | p.L459V | O94925 | protein_coding | tolerated(0.06) | possibly_damaging(0.744) | TCGA-2E-A9G8-01 | Endometrium | uterine corpus endometrioid carcinoma | Female | <65 | III/IV | Chemotherapy | taxol | CR |
| GLS | SNV | Missense_Mutation | novel | c.829N>T | p.Asp277Tyr | p.D277Y | O94925 | protein_coding | deleterious(0) | probably_damaging(0.987) | TCGA-A5-A2K5-01 | Endometrium | uterine corpus endometrioid carcinoma | Female | >=65 | I/II | Unknown | Unknown | SD |
| GLS | SNV | Missense_Mutation | c.698N>C | p.Glu233Ala | p.E233A | O94925 | protein_coding | tolerated(0.1) | benign(0.01) | TCGA-AP-A051-01 | Endometrium | uterine corpus endometrioid carcinoma | Female | >=65 | I/II | Unknown | Unknown | SD | |
| GLS | SNV | Missense_Mutation | c.1016T>G | p.Ile339Ser | p.I339S | O94925 | protein_coding | deleterious(0) | probably_damaging(1) | TCGA-AP-A054-01 | Endometrium | uterine corpus endometrioid carcinoma | Female | <65 | III/IV | Chemotherapy | carboplatin | PD | |
| GLS | SNV | Missense_Mutation | c.653A>C | p.Lys218Thr | p.K218T | O94925 | protein_coding | deleterious(0.04) | possibly_damaging(0.576) | TCGA-AP-A059-01 | Endometrium | uterine corpus endometrioid carcinoma | Female | >=65 | I/II | Unknown | Unknown | SD |
| Page: 1 2 3 4 5 6 |
Top |
Related drugs of malignant transformation related genes |
| Identification of chemicals and drugs interact with genes involved in malignant transfromation |
| (DGIdb 4.0) |
| Entrez ID | Symbol | Category | Interaction Types | Drug Claim Name | Drug Name | PMIDs |
| 2744 | GLS | ENZYME | CEFATRIZINE | CEFATRIZINE | ||
| 2744 | GLS | ENZYME | THUNBERGINOL B | THUNBERGINOL B | ||
| 2744 | GLS | ENZYME | 2,3,4-TRIHYDROXYBENZOPHENONE | CHEMBL1527 | ||
| 2744 | GLS | ENZYME | CEFMETAZOLE SODIUM | CEFMETAZOLE SODIUM | ||
| 2744 | GLS | ENZYME | LINOLENIC ACID | LINOLENIC ACID | ||
| 2744 | GLS | ENZYME | ANTIANGIOGENIC | 15743040 | ||
| 2744 | GLS | ENZYME | ASTERRIC ACID | ASTERRIC ACID | ||
| 2744 | GLS | ENZYME | OXIDOPAMINE HYDROCHLORIDE | OXIDOPAMINE HYDROCHLORIDE | ||
| 2744 | GLS | ENZYME | ISOTHYMONIN | ISOTHYMONIN | ||
| 2744 | GLS | ENZYME | DAPHNORIN | DAPHNORIN |
| Page: 1 2 3 4 5 6 7 8 9 |

Copyright 2023-Present -The University of Texas Health Science Center at Houston |