
|
|||||
|
 | |
| |
| |
| |
| |
| |
|
Gene: GLRX5 |
Gene summary for GLRX5 |
| Gene information | Species | Human | Gene symbol | GLRX5 | Gene ID | 51218 |
| Gene name | glutaredoxin 5 | |
| Gene Alias | C14orf87 | |
| Cytomap | 14q32.13 | |
| Gene Type | protein-coding | GO ID | GO:0002376 | UniProtAcc | Q86SX6 |
Top |
Malignant transformation analysis |
| Identification of the aberrant gene expression in precancerous and cancerous lesions by comparing the gene expression of stem-like cells in diseased tissues with normal stem cells |
| Entrez ID | Symbol | Replicates | Species | Organ | Tissue | Adj P-value | Log2FC | Malignancy |
| 51218 | GLRX5 | HTA11_3410_2000001011 | Human | Colorectum | AD | 3.59e-04 | 2.07e-01 | 0.0155 |
| 51218 | GLRX5 | HTA11_2487_2000001011 | Human | Colorectum | SER | 3.18e-02 | 2.34e-01 | -0.1808 |
| 51218 | GLRX5 | HTA11_1938_2000001011 | Human | Colorectum | AD | 6.10e-03 | 3.54e-01 | -0.0811 |
| 51218 | GLRX5 | HTA11_78_2000001011 | Human | Colorectum | AD | 1.67e-02 | 2.61e-01 | -0.1088 |
| 51218 | GLRX5 | HTA11_347_2000001011 | Human | Colorectum | AD | 3.73e-31 | 7.57e-01 | -0.1954 |
| 51218 | GLRX5 | HTA11_411_2000001011 | Human | Colorectum | SER | 1.52e-05 | 5.73e-01 | -0.2602 |
| 51218 | GLRX5 | HTA11_696_2000001011 | Human | Colorectum | AD | 7.89e-07 | 3.14e-01 | -0.1464 |
| 51218 | GLRX5 | HTA11_866_2000001011 | Human | Colorectum | AD | 3.04e-02 | 1.19e-01 | -0.1001 |
| 51218 | GLRX5 | HTA11_1391_2000001011 | Human | Colorectum | AD | 2.84e-12 | 5.30e-01 | -0.059 |
| 51218 | GLRX5 | HTA11_2992_2000001011 | Human | Colorectum | SER | 6.46e-07 | 5.84e-01 | -0.1706 |
| 51218 | GLRX5 | HTA11_5212_2000001011 | Human | Colorectum | AD | 5.41e-06 | 5.10e-01 | -0.2061 |
| 51218 | GLRX5 | HTA11_5216_2000001011 | Human | Colorectum | SER | 2.34e-02 | 4.81e-01 | -0.1462 |
| 51218 | GLRX5 | HTA11_866_3004761011 | Human | Colorectum | AD | 3.38e-03 | 2.62e-01 | 0.096 |
| 51218 | GLRX5 | HTA11_7663_2000001011 | Human | Colorectum | SER | 2.45e-04 | 4.85e-01 | 0.0131 |
| 51218 | GLRX5 | HTA11_6801_2000001011 | Human | Colorectum | SER | 1.51e-05 | 7.45e-01 | 0.0171 |
| 51218 | GLRX5 | HTA11_7696_3000711011 | Human | Colorectum | AD | 3.95e-03 | 1.90e-01 | 0.0674 |
| 51218 | GLRX5 | HTA11_99999970781_79442 | Human | Colorectum | MSS | 2.53e-11 | 3.49e-01 | 0.294 |
| 51218 | GLRX5 | HTA11_99999965104_69814 | Human | Colorectum | MSS | 5.39e-09 | 4.97e-01 | 0.281 |
| 51218 | GLRX5 | HTA11_99999971662_82457 | Human | Colorectum | MSS | 2.65e-06 | 2.39e-01 | 0.3859 |
| 51218 | GLRX5 | LZE22D1 | Human | Esophagus | HGIN | 2.20e-02 | 7.32e-02 | 0.0595 |
| Page: 1 2 3 4 5 6 7 |
| Tissue | Expression Dynamics | Abbreviation |
| Colorectum (GSE201348) |  | FAP: Familial adenomatous polyposis |
| CRC: Colorectal cancer | ||
| Colorectum (HTA11) | 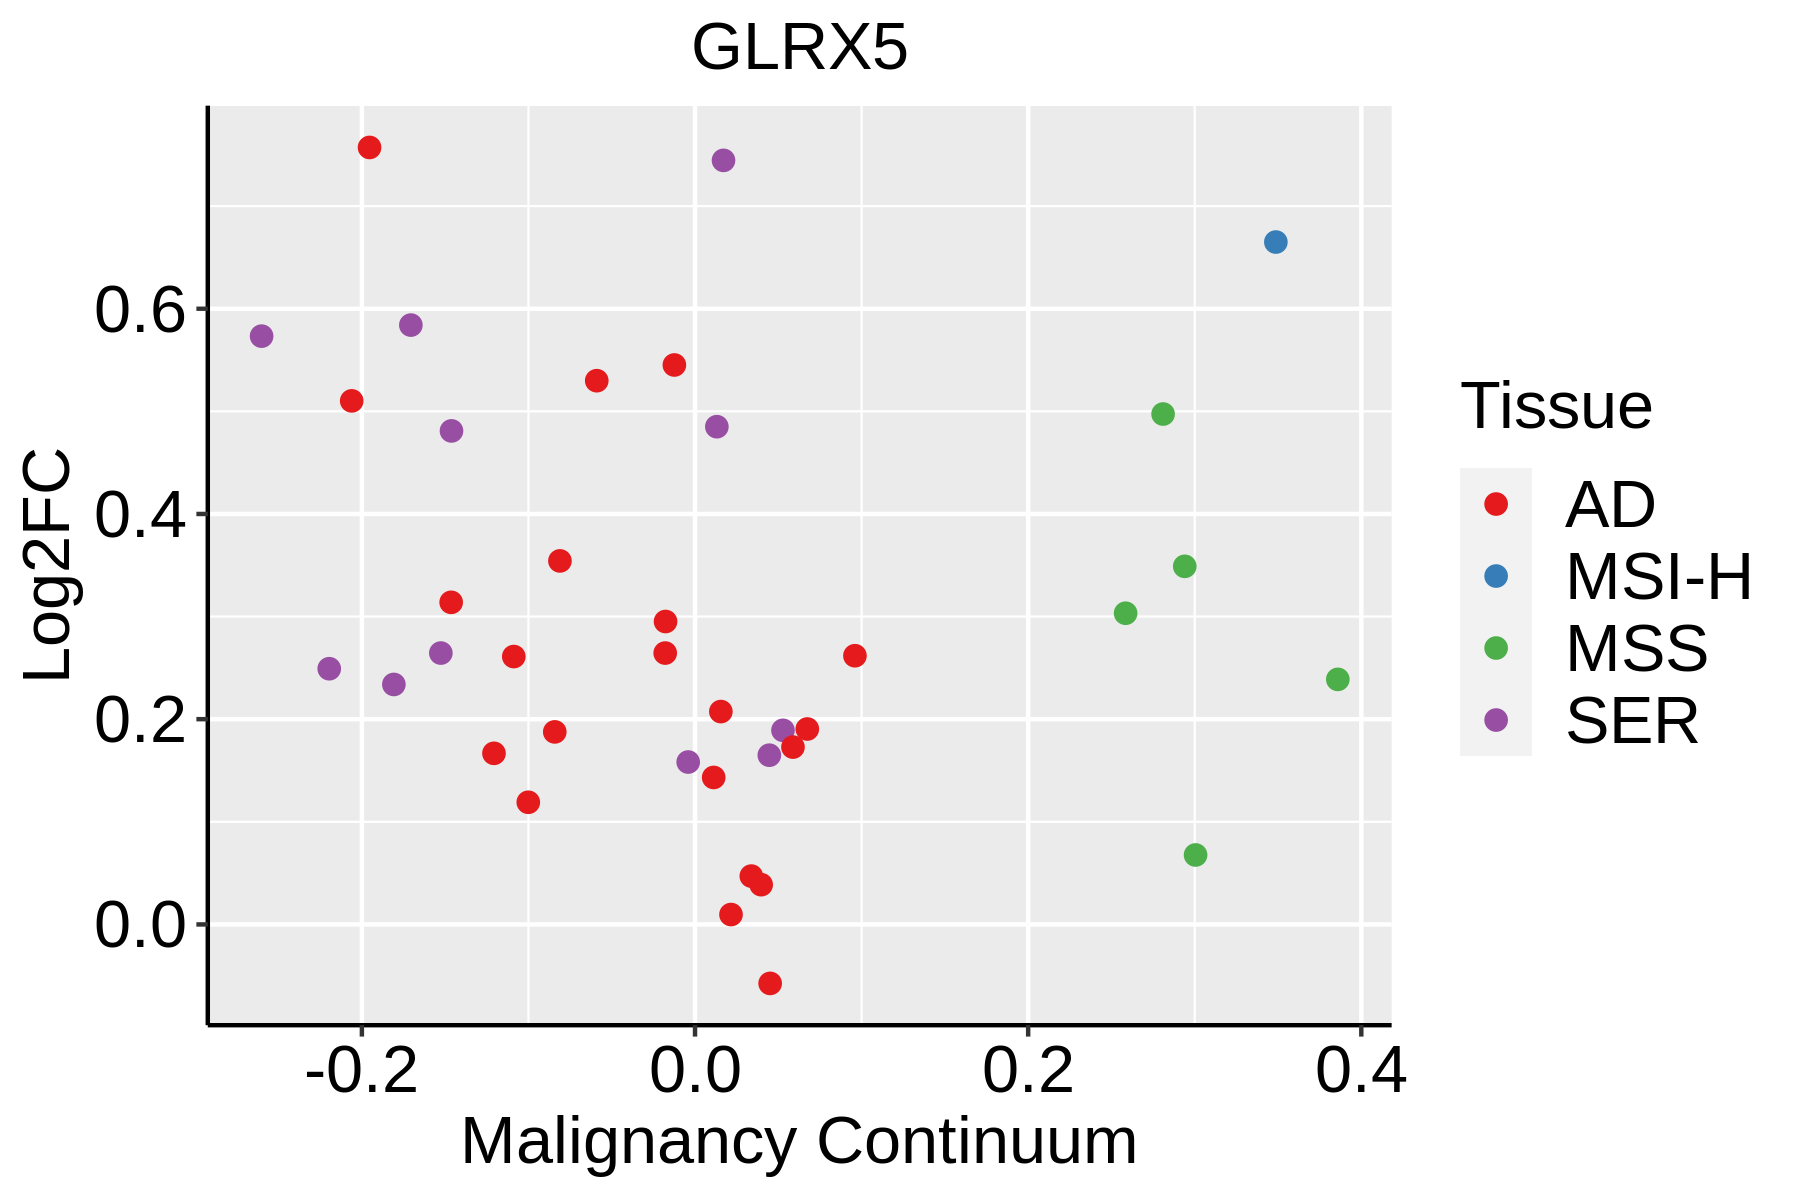 | AD: Adenomas |
| SER: Sessile serrated lesions | ||
| MSI-H: Microsatellite-high colorectal cancer | ||
| MSS: Microsatellite stable colorectal cancer | ||
| Esophagus |  | ESCC: Esophageal squamous cell carcinoma |
| HGIN: High-grade intraepithelial neoplasias | ||
| LGIN: Low-grade intraepithelial neoplasias | ||
| Liver |  | HCC: Hepatocellular carcinoma |
| NAFLD: Non-alcoholic fatty liver disease | ||
| Oral Cavity | 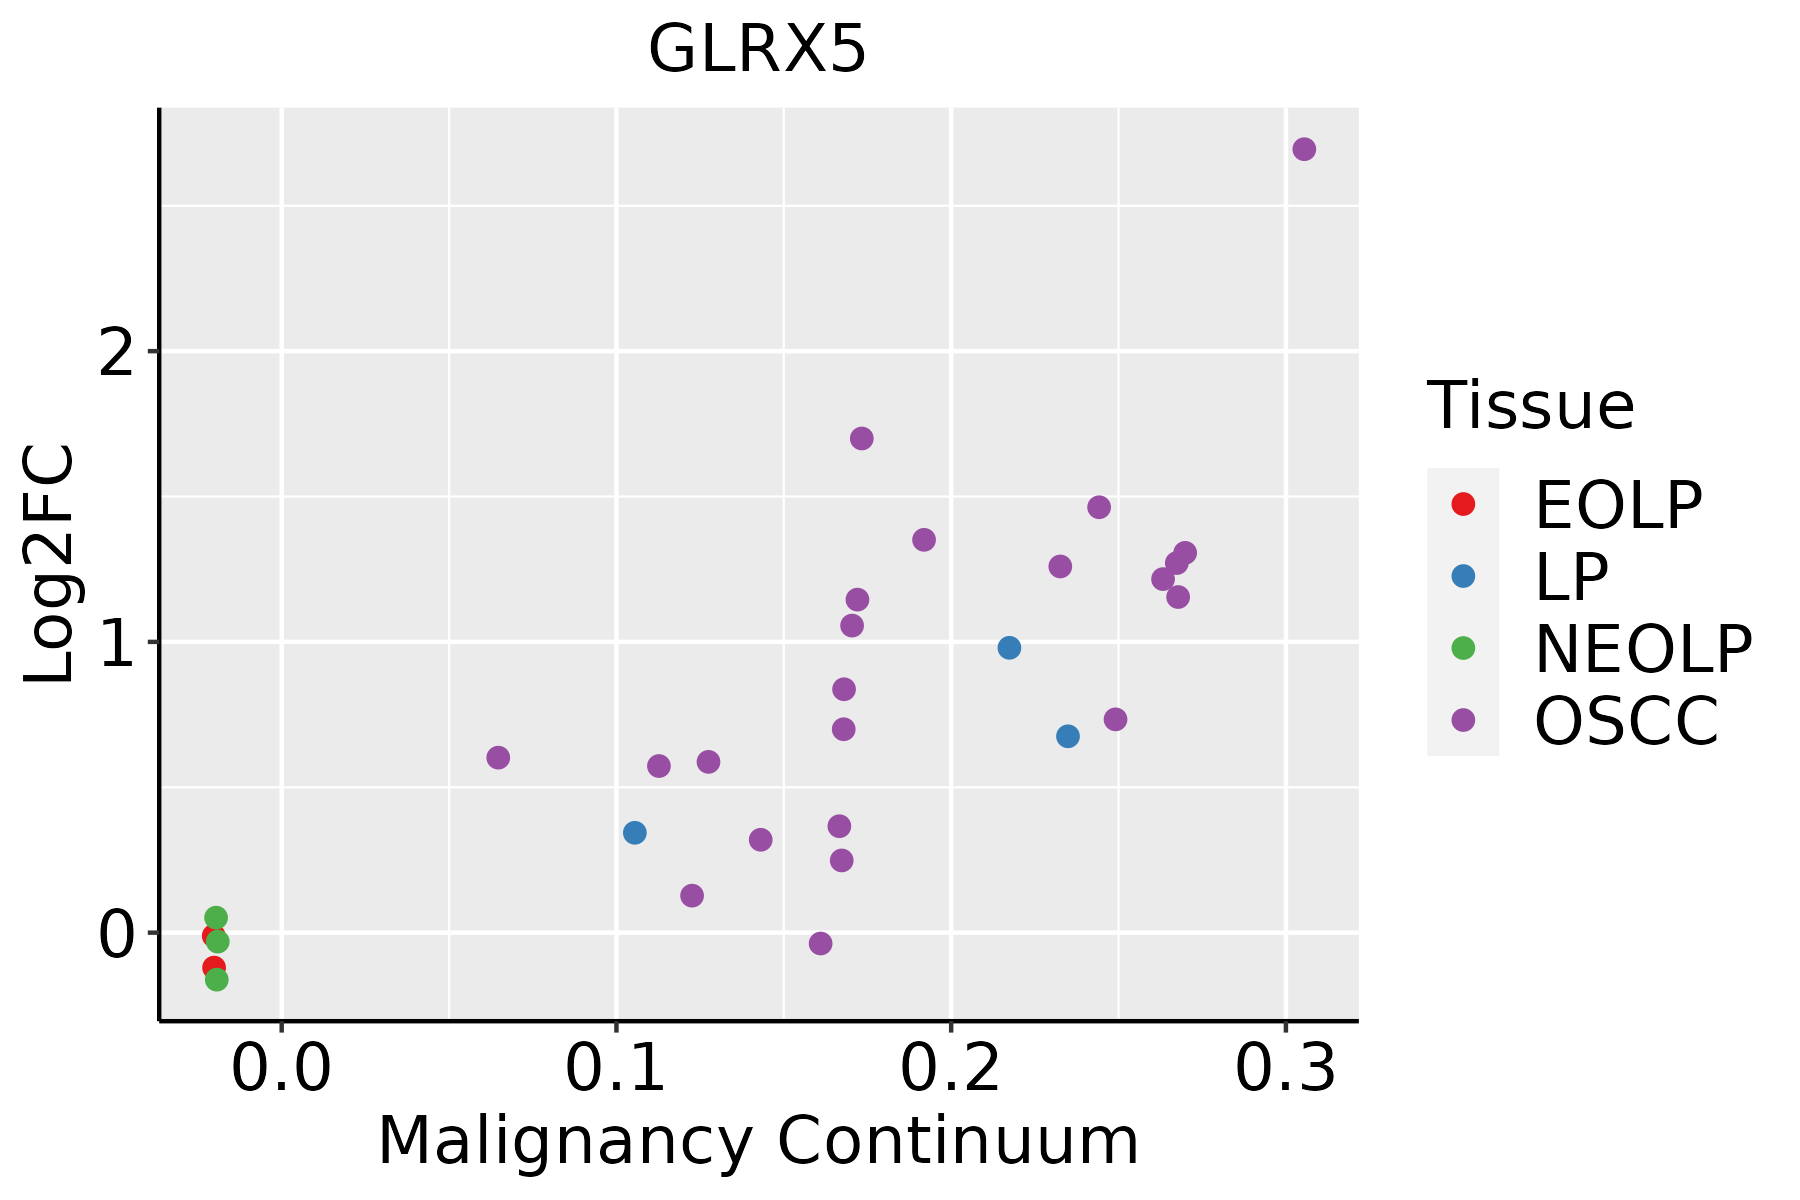 | EOLP: Erosive Oral lichen planus |
| LP: leukoplakia | ||
| NEOLP: Non-erosive oral lichen planus | ||
| OSCC: Oral squamous cell carcinoma | ||
| Skin | 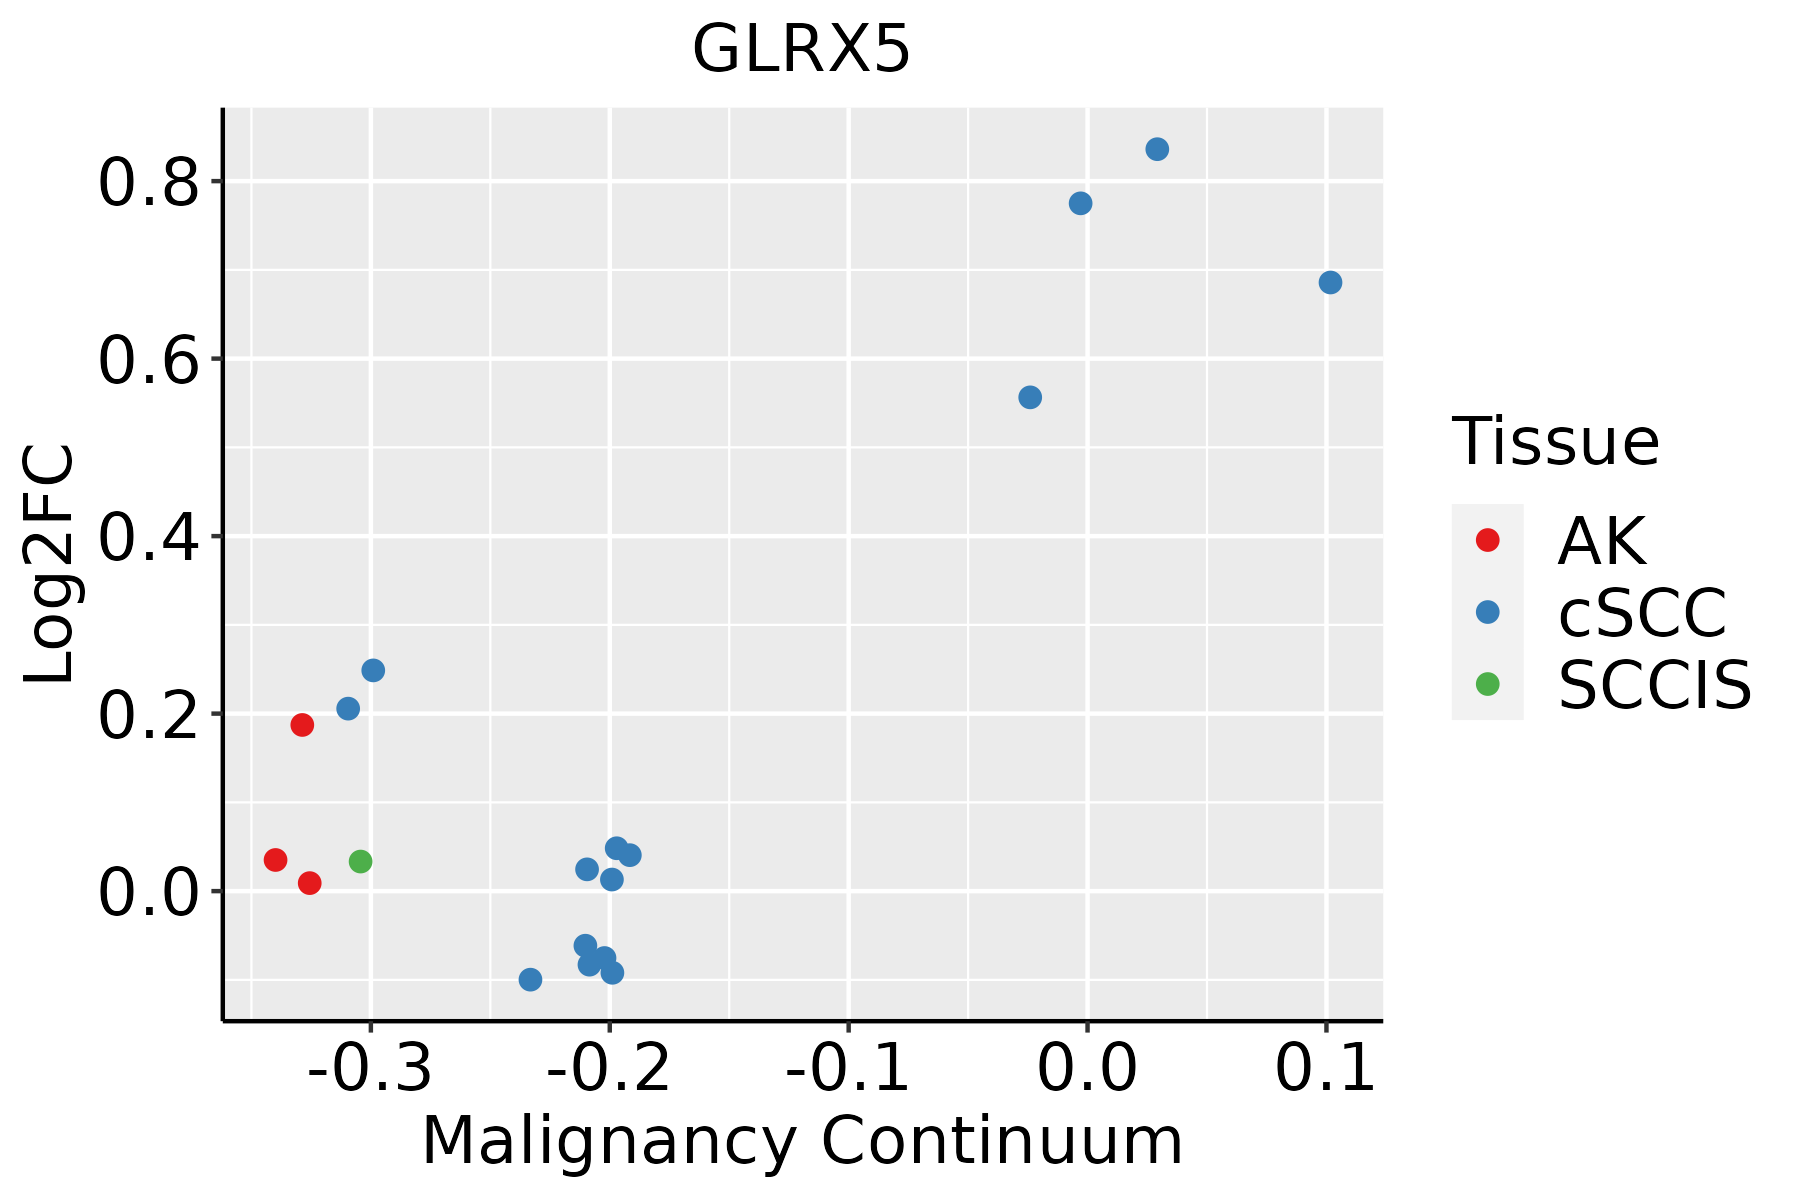 | AK: Actinic keratosis |
| cSCC: Cutaneous squamous cell carcinoma | ||
| SCCIS:squamous cell carcinoma in situ | ||
| Thyroid | 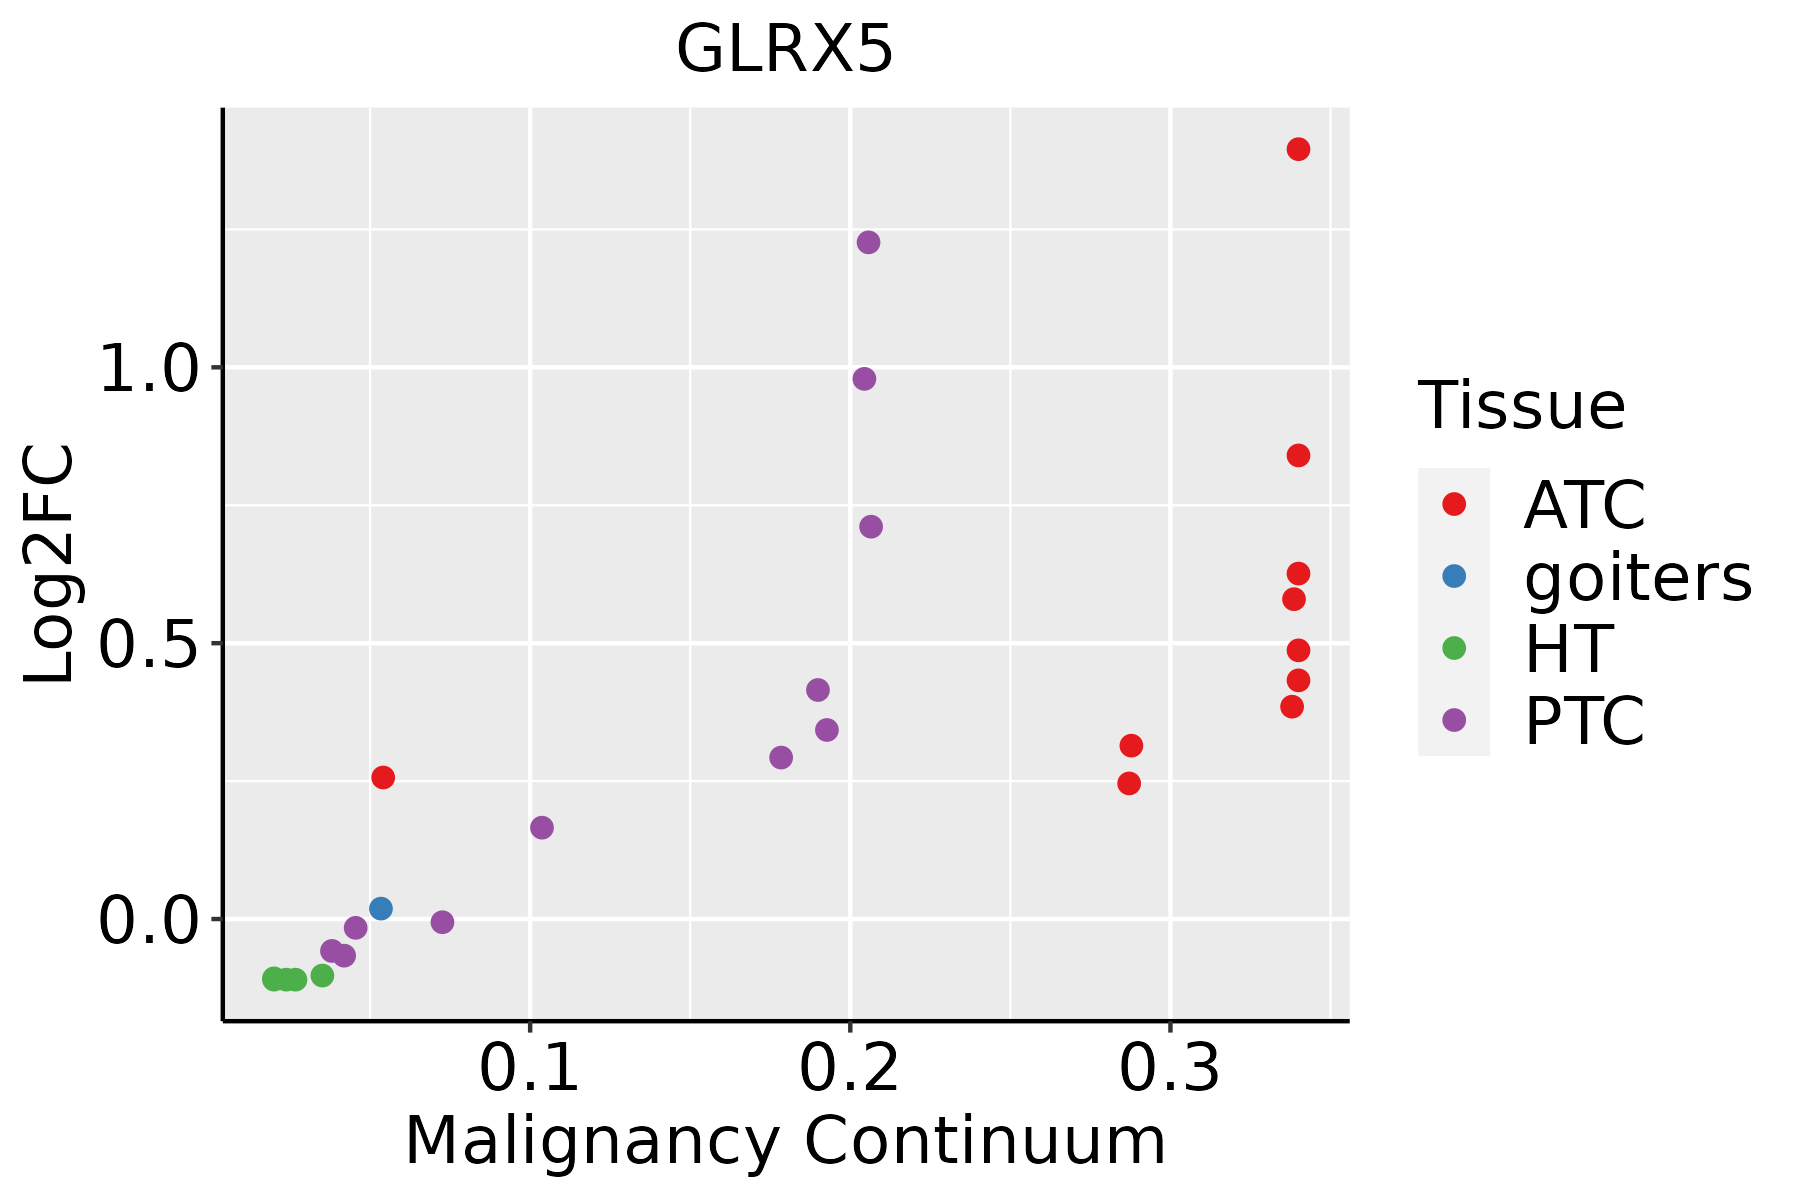 | ATC: Anaplastic thyroid cancer |
| HT: Hashimoto's thyroiditis | ||
| PTC: Papillary thyroid cancer |
| ∗log2FC in expression of this searched gene in stem-like cells from each diseased tissue sample relative to stem-like cells in normal samples in each tissue plotted against the malignancy continuum. Samples are colored based on if they are from different disease stage. |
Top |
Malignant transformation related pathway analysis |
| Find out the enriched GO biological processes and KEGG pathways involved in transition from healthy to precancer to cancer |
| Tissue | Disease Stage | Enriched GO biological Processes |
| Colorectum | AD |  |
| Colorectum | SER |  |
| Colorectum | MSS |  |
| Colorectum | MSI-H |  |
| Colorectum | FAP |  |
| ∗Top 15 enriched GO BP terms are showed in the bar plot of each disease state in each tissue. Each row represents a significant GO biological process which is colored according to the -log10(p.adjust). |
| Page: 1 2 3 4 5 6 7 8 9 |
| GO ID | Tissue | Disease Stage | Description | Gene Ratio | Bg Ratio | pvalue | p.adjust | Count |
| GO:0006790 | Colorectum | AD | sulfur compound metabolic process | 101/3918 | 339/18723 | 6.46e-05 | 1.07e-03 | 101 |
| GO:0051604 | Colorectum | AD | protein maturation | 85/3918 | 294/18723 | 6.73e-04 | 6.91e-03 | 85 |
| GO:00516041 | Colorectum | SER | protein maturation | 73/2897 | 294/18723 | 1.82e-05 | 5.38e-04 | 73 |
| GO:00067901 | Colorectum | SER | sulfur compound metabolic process | 73/2897 | 339/18723 | 1.75e-03 | 1.81e-02 | 73 |
| GO:00067902 | Colorectum | MSS | sulfur compound metabolic process | 85/3467 | 339/18723 | 1.52e-03 | 1.39e-02 | 85 |
| GO:00516042 | Colorectum | MSS | protein maturation | 75/3467 | 294/18723 | 1.70e-03 | 1.53e-02 | 75 |
| GO:005160417 | Esophagus | HGIN | protein maturation | 68/2587 | 294/18723 | 9.77e-06 | 2.86e-04 | 68 |
| GO:00974282 | Esophagus | HGIN | protein maturation by iron-sulfur cluster transfer | 8/2587 | 16/18723 | 6.00e-04 | 8.41e-03 | 8 |
| GO:00162263 | Esophagus | HGIN | iron-sulfur cluster assembly | 10/2587 | 26/18723 | 1.60e-03 | 1.79e-02 | 10 |
| GO:00311633 | Esophagus | HGIN | metallo-sulfur cluster assembly | 10/2587 | 26/18723 | 1.60e-03 | 1.79e-02 | 10 |
| GO:005160418 | Esophagus | ESCC | protein maturation | 189/8552 | 294/18723 | 7.64e-11 | 2.39e-09 | 189 |
| GO:00067906 | Esophagus | ESCC | sulfur compound metabolic process | 201/8552 | 339/18723 | 2.64e-07 | 3.94e-06 | 201 |
| GO:001622611 | Esophagus | ESCC | iron-sulfur cluster assembly | 21/8552 | 26/18723 | 2.69e-04 | 1.63e-03 | 21 |
| GO:003116311 | Esophagus | ESCC | metallo-sulfur cluster assembly | 21/8552 | 26/18723 | 2.69e-04 | 1.63e-03 | 21 |
| GO:009742811 | Esophagus | ESCC | protein maturation by iron-sulfur cluster transfer | 14/8552 | 16/18723 | 6.78e-04 | 3.56e-03 | 14 |
| GO:00516046 | Liver | Cirrhotic | protein maturation | 121/4634 | 294/18723 | 3.54e-10 | 1.68e-08 | 121 |
| GO:000679011 | Liver | Cirrhotic | sulfur compound metabolic process | 129/4634 | 339/18723 | 3.06e-08 | 1.04e-06 | 129 |
| GO:000679021 | Liver | HCC | sulfur compound metabolic process | 212/7958 | 339/18723 | 5.60e-14 | 3.39e-12 | 212 |
| GO:005160412 | Liver | HCC | protein maturation | 171/7958 | 294/18723 | 3.80e-08 | 8.30e-07 | 171 |
| GO:0016226 | Liver | HCC | iron-sulfur cluster assembly | 18/7958 | 26/18723 | 5.37e-03 | 2.24e-02 | 18 |
| Page: 1 2 |
| Pathway ID | Tissue | Disease Stage | Description | Gene Ratio | Bg Ratio | pvalue | p.adjust | qvalue | Count |
| Page: 1 |
Top |
Cell-cell communication analysis |
| Identification of potential cell-cell interactions between two cell types and their ligand-receptor pairs for different disease states |
| Ligand | Receptor | LRpair | Pathway | Tissue | Disease Stage |
| Page: 1 |
Top |
Single-cell gene regulatory network inference analysis |
| Find out the significant the regulons (TFs) and the target genes of each regulon across cell types for different disease states |
| TF | Cell Type | Tissue | Disease Stage | Target Gene | RSS | Regulon Activity |
| ∗The dot plots of a searched regulon are shown for all cell subpopulations in each disease state of each tissue based on the regulon specific score inferred using pySCENIC and by calculating the average expression. |
| Page: 1 |
Top |
Somatic mutation of malignant transformation related genes |
| Annotation of somatic variants for genes involved in malignant transformation |
| Hugo Symbol | Variant Class | Variant Classification | dbSNP RS | HGVSc | HGVSp | HGVSp Short | SWISSPROT | BIOTYPE | SIFT | PolyPhen | Tumor Sample Barcode | Tissue | Histology | Sex | Age | Stage | Therapy Types | Drugs | Outcome |
| GLRX5 | insertion | Nonsense_Mutation | novel | c.433_434insAGTAGCAGA | p.Ser145delinsTer | p.S145delins* | Q86SX6 | protein_coding | TCGA-DS-A1OB-01 | Cervix | cervical & endocervical cancer | Female | <65 | I/II | Chemotherapy | carboplatin | PD | ||
| GLRX5 | SNV | Missense_Mutation | novel | c.333N>T | p.Gln111His | p.Q111H | Q86SX6 | protein_coding | deleterious(0) | probably_damaging(0.999) | TCGA-34-2604-01 | Lung | lung squamous cell carcinoma | Female | >=65 | I/II | Unknown | Unknown | SD |
| GLRX5 | SNV | Missense_Mutation | c.444A>T | p.Leu148Phe | p.L148F | Q86SX6 | protein_coding | deleterious(0.05) | possibly_damaging(0.786) | TCGA-51-4079-01 | Lung | lung squamous cell carcinoma | Female | >=65 | I/II | Unknown | Unknown | SD | |
| GLRX5 | SNV | Missense_Mutation | c.304G>T | p.Asp102Tyr | p.D102Y | Q86SX6 | protein_coding | deleterious(0.03) | probably_damaging(0.979) | TCGA-BR-8680-01 | Stomach | stomach adenocarcinoma | Male | <65 | III/IV | Chemotherapy | oxaliplatin | CR |
| Page: 1 |
Top |
Related drugs of malignant transformation related genes |
| Identification of chemicals and drugs interact with genes involved in malignant transfromation |
| (DGIdb 4.0) |
| Entrez ID | Symbol | Category | Interaction Types | Drug Claim Name | Drug Name | PMIDs |
| Page: 1 |

Copyright 2023-Present -The University of Texas Health Science Center at Houston |