
|
|||||
|
 | |
| |
| |
| |
| |
| |
|
Gene: GLRX3 |
Gene summary for GLRX3 |
| Gene information | Species | Human | Gene symbol | GLRX3 | Gene ID | 10539 |
| Gene name | glutaredoxin 3 | |
| Gene Alias | GLRX4 | |
| Cytomap | 10q26.3 | |
| Gene Type | protein-coding | GO ID | GO:0002026 | UniProtAcc | A0A140VJK1 |
Top |
Malignant transformation analysis |
| Identification of the aberrant gene expression in precancerous and cancerous lesions by comparing the gene expression of stem-like cells in diseased tissues with normal stem cells |
| Entrez ID | Symbol | Replicates | Species | Organ | Tissue | Adj P-value | Log2FC | Malignancy |
| 10539 | GLRX3 | LZE2T | Human | Esophagus | ESCC | 2.04e-02 | 6.42e-01 | 0.082 |
| 10539 | GLRX3 | LZE4T | Human | Esophagus | ESCC | 3.07e-17 | 7.11e-01 | 0.0811 |
| 10539 | GLRX3 | LZE7T | Human | Esophagus | ESCC | 3.72e-10 | 2.83e-01 | 0.0667 |
| 10539 | GLRX3 | LZE8T | Human | Esophagus | ESCC | 2.89e-11 | 4.52e-01 | 0.067 |
| 10539 | GLRX3 | LZE20T | Human | Esophagus | ESCC | 4.51e-05 | 1.05e-01 | 0.0662 |
| 10539 | GLRX3 | LZE22D1 | Human | Esophagus | HGIN | 2.26e-03 | -1.22e-01 | 0.0595 |
| 10539 | GLRX3 | LZE24T | Human | Esophagus | ESCC | 8.66e-32 | 1.17e+00 | 0.0596 |
| 10539 | GLRX3 | LZE21T | Human | Esophagus | ESCC | 2.21e-05 | 5.77e-01 | 0.0655 |
| 10539 | GLRX3 | LZE6T | Human | Esophagus | ESCC | 2.53e-08 | 6.50e-01 | 0.0845 |
| 10539 | GLRX3 | P1T-E | Human | Esophagus | ESCC | 6.04e-04 | 3.74e-01 | 0.0875 |
| 10539 | GLRX3 | P2T-E | Human | Esophagus | ESCC | 1.88e-29 | 7.87e-01 | 0.1177 |
| 10539 | GLRX3 | P4T-E | Human | Esophagus | ESCC | 7.33e-66 | 1.75e+00 | 0.1323 |
| 10539 | GLRX3 | P5T-E | Human | Esophagus | ESCC | 4.09e-66 | 2.10e+00 | 0.1327 |
| 10539 | GLRX3 | P8T-E | Human | Esophagus | ESCC | 3.81e-31 | 7.55e-01 | 0.0889 |
| 10539 | GLRX3 | P9T-E | Human | Esophagus | ESCC | 1.22e-20 | 4.86e-01 | 0.1131 |
| 10539 | GLRX3 | P10T-E | Human | Esophagus | ESCC | 8.08e-15 | 4.12e-01 | 0.116 |
| 10539 | GLRX3 | P11T-E | Human | Esophagus | ESCC | 2.52e-21 | 1.03e+00 | 0.1426 |
| 10539 | GLRX3 | P12T-E | Human | Esophagus | ESCC | 2.50e-66 | 1.66e+00 | 0.1122 |
| 10539 | GLRX3 | P15T-E | Human | Esophagus | ESCC | 3.98e-42 | 1.19e+00 | 0.1149 |
| 10539 | GLRX3 | P16T-E | Human | Esophagus | ESCC | 5.09e-23 | 5.61e-01 | 0.1153 |
| Page: 1 2 3 4 5 6 7 |
| Tissue | Expression Dynamics | Abbreviation |
| Esophagus | 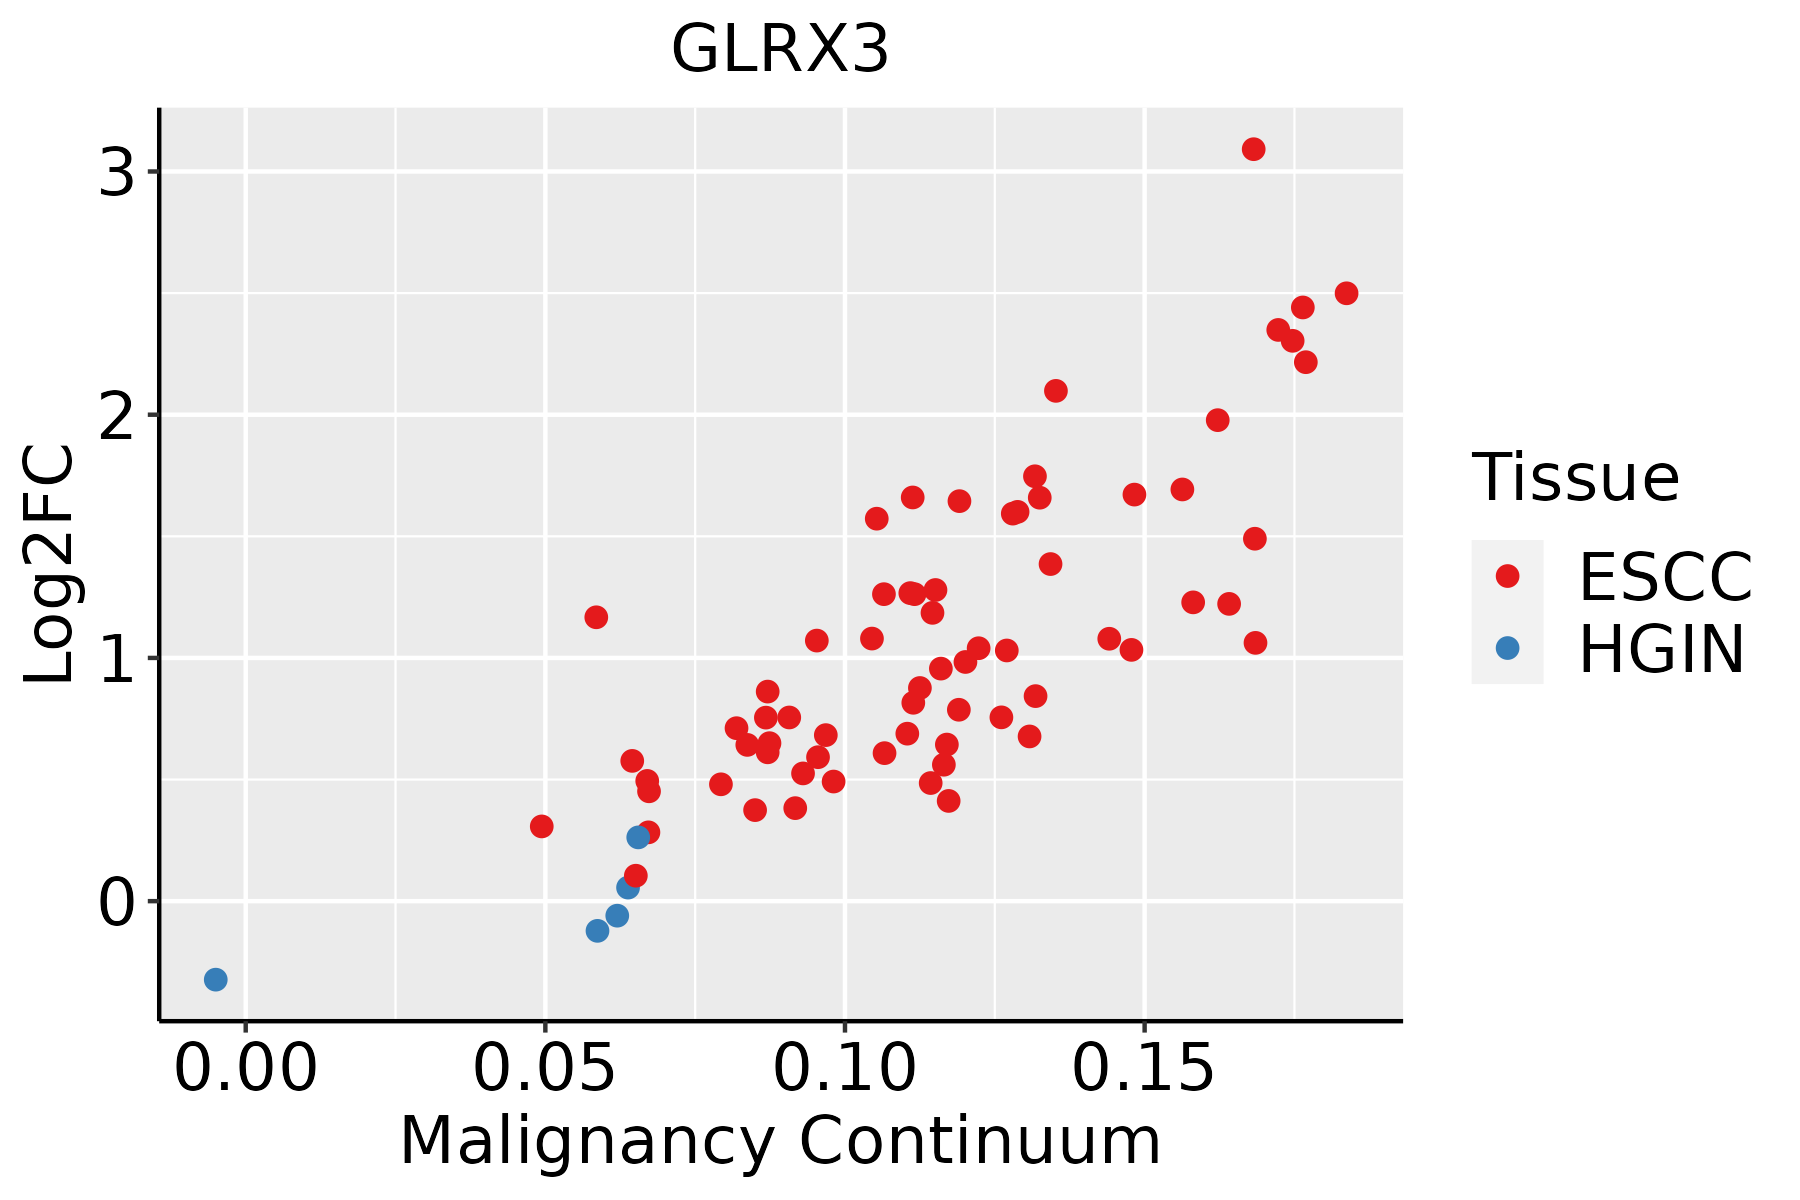 | ESCC: Esophageal squamous cell carcinoma |
| HGIN: High-grade intraepithelial neoplasias | ||
| LGIN: Low-grade intraepithelial neoplasias | ||
| Liver |  | HCC: Hepatocellular carcinoma |
| NAFLD: Non-alcoholic fatty liver disease | ||
| Oral Cavity | 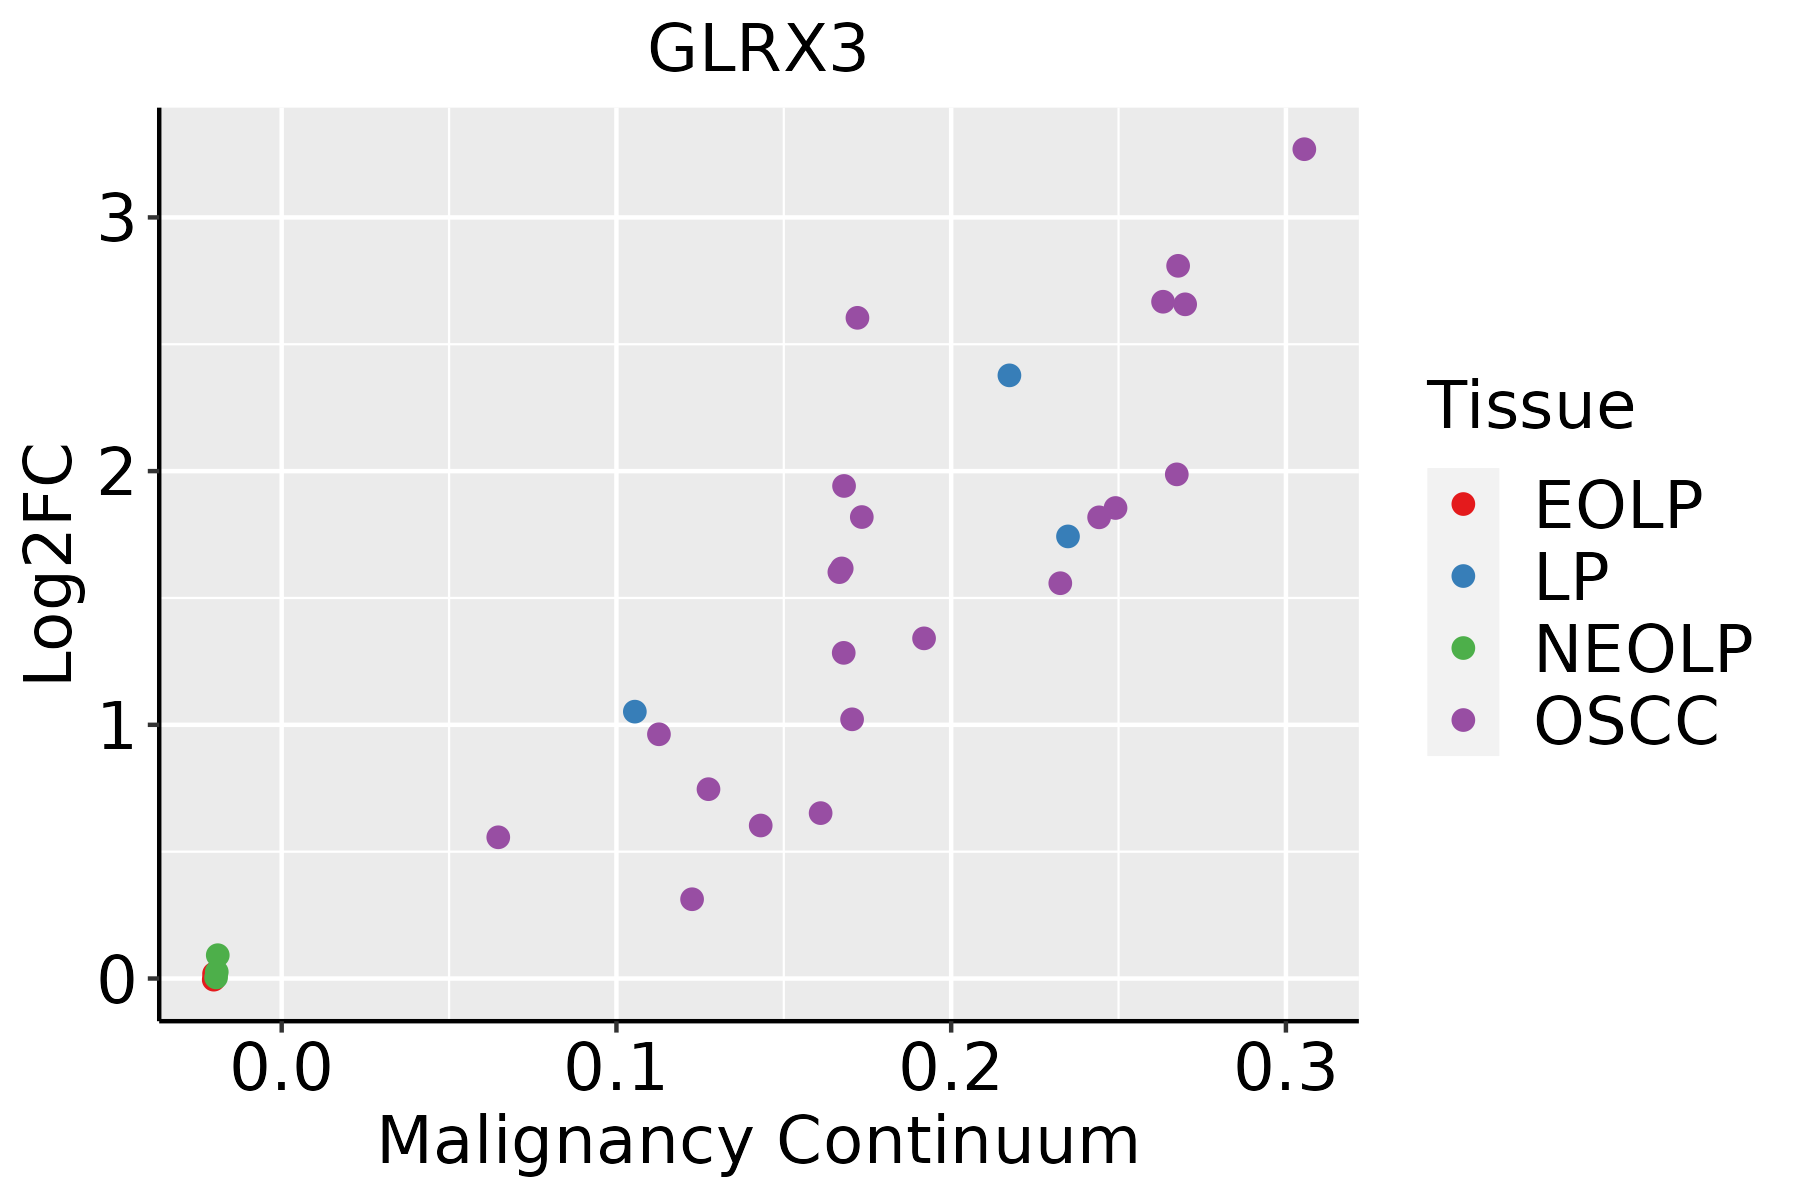 | EOLP: Erosive Oral lichen planus |
| LP: leukoplakia | ||
| NEOLP: Non-erosive oral lichen planus | ||
| OSCC: Oral squamous cell carcinoma | ||
| Prostate | 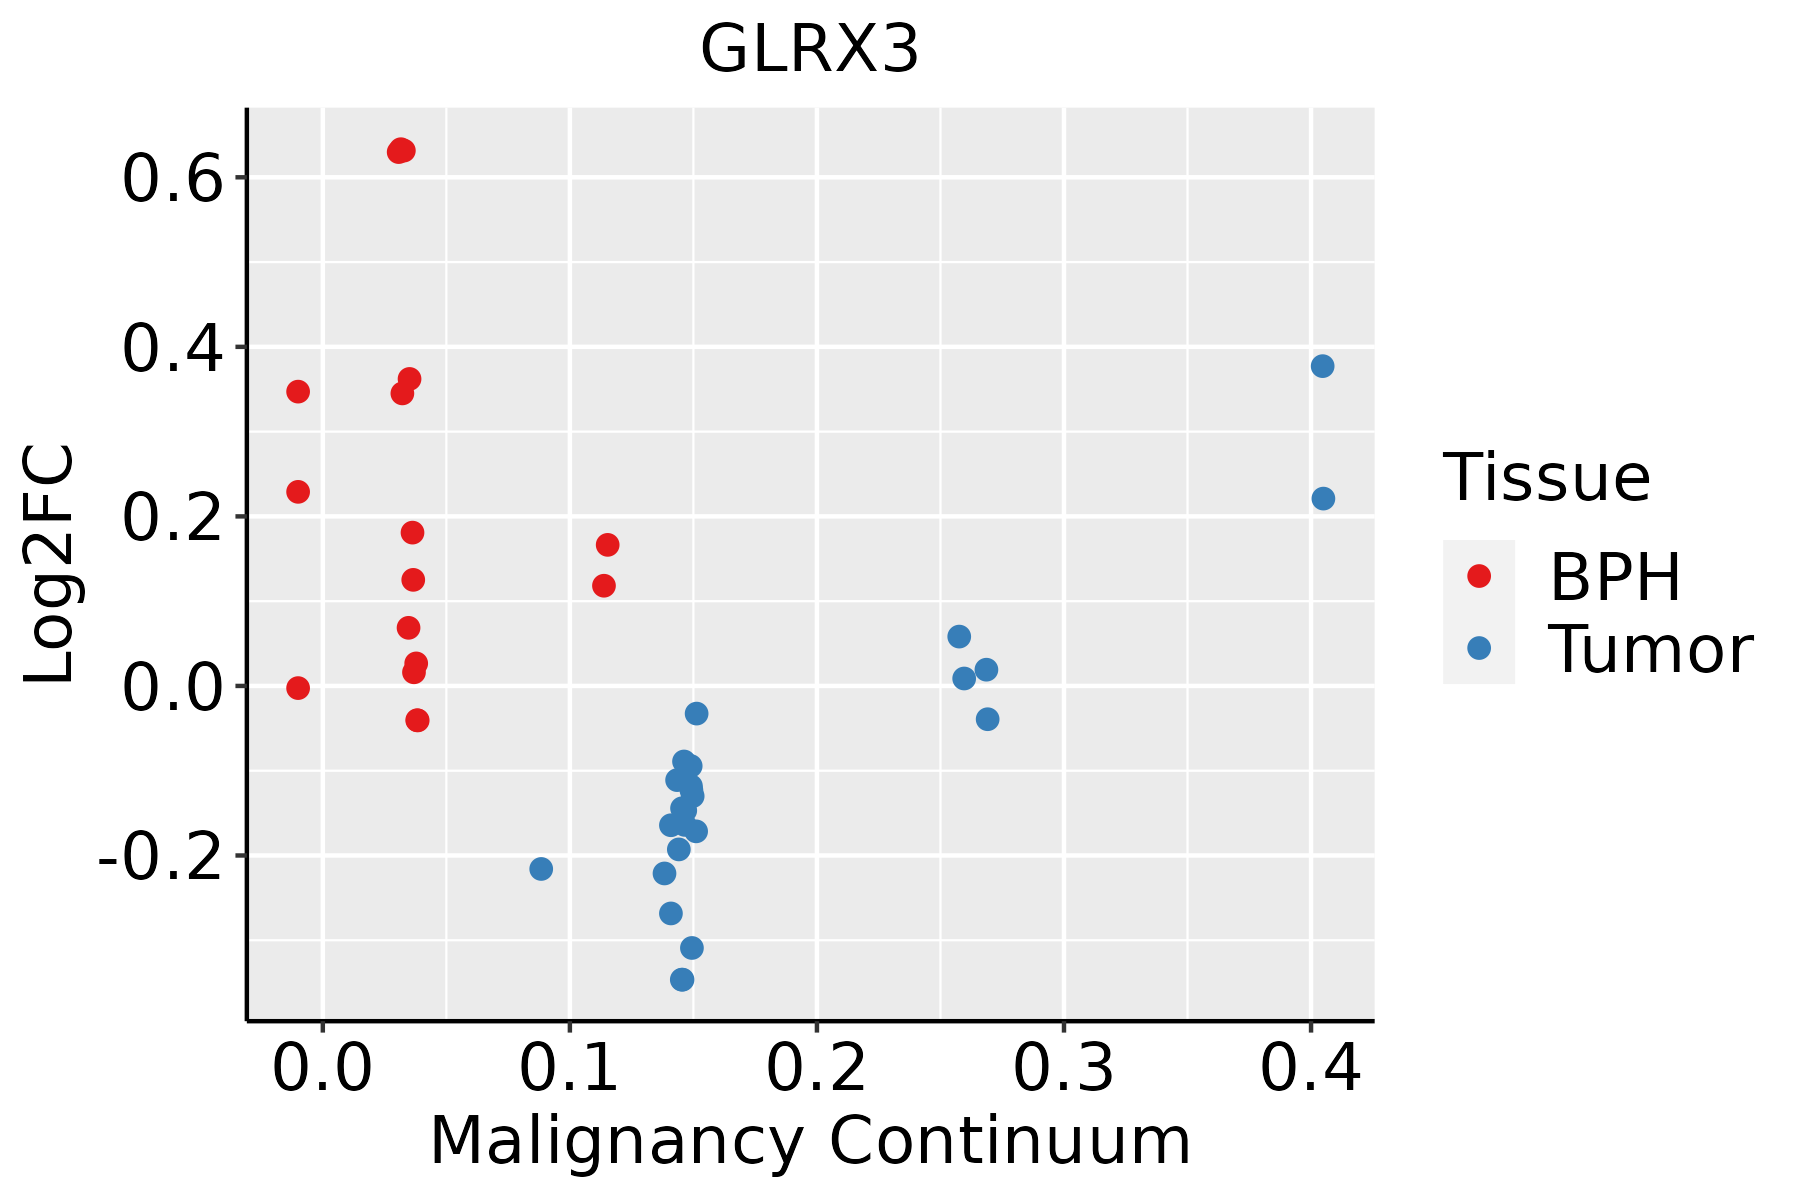 | BPH: Benign Prostatic Hyperplasia |
| Skin |  | AK: Actinic keratosis |
| cSCC: Cutaneous squamous cell carcinoma | ||
| SCCIS:squamous cell carcinoma in situ | ||
| Thyroid | 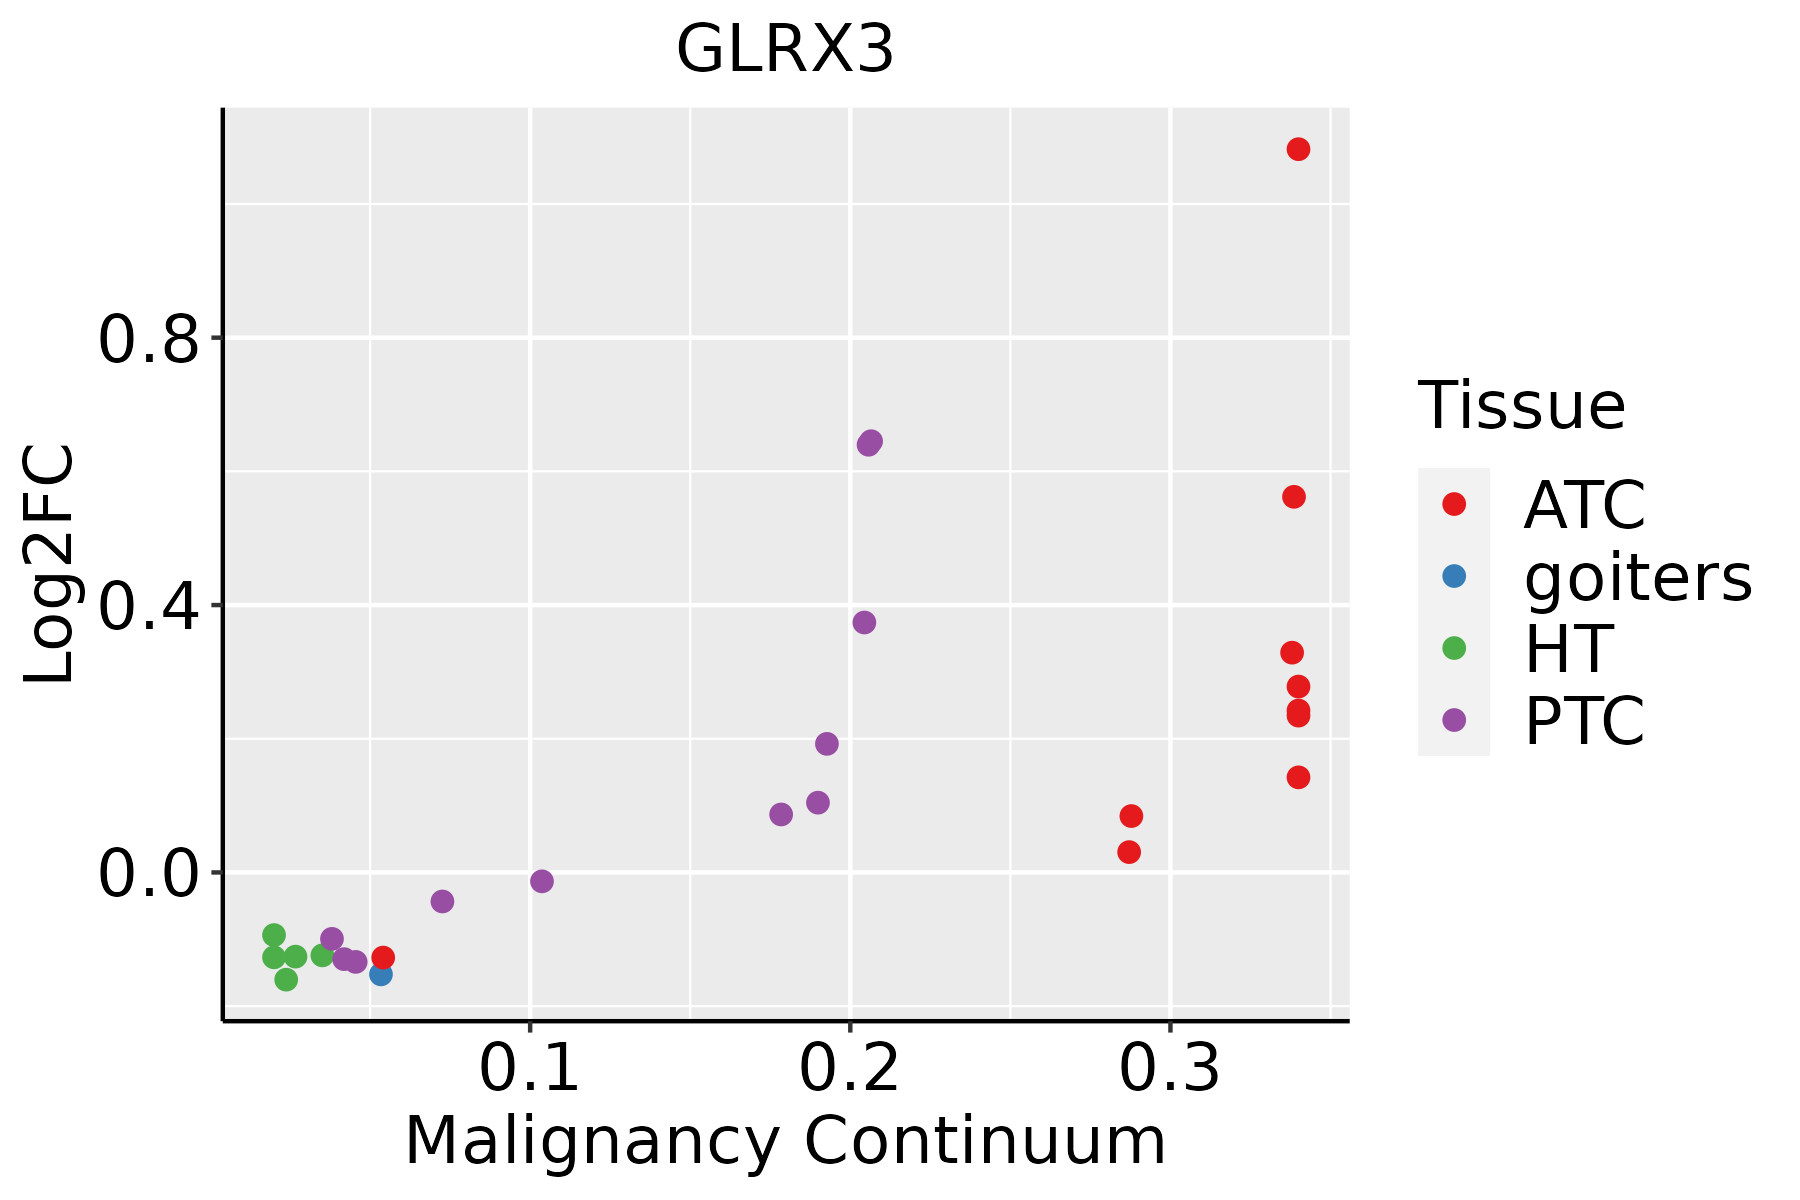 | ATC: Anaplastic thyroid cancer |
| HT: Hashimoto's thyroiditis | ||
| PTC: Papillary thyroid cancer |
| ∗log2FC in expression of this searched gene in stem-like cells from each diseased tissue sample relative to stem-like cells in normal samples in each tissue plotted against the malignancy continuum. Samples are colored based on if they are from different disease stage. |
Top |
Malignant transformation related pathway analysis |
| Find out the enriched GO biological processes and KEGG pathways involved in transition from healthy to precancer to cancer |
| Tissue | Disease Stage | Enriched GO biological Processes |
| Colorectum | AD |  |
| Colorectum | SER |  |
| Colorectum | MSS |  |
| Colorectum | MSI-H |  |
| Colorectum | FAP |  |
| ∗Top 15 enriched GO BP terms are showed in the bar plot of each disease state in each tissue. Each row represents a significant GO biological process which is colored according to the -log10(p.adjust). |
| Page: 1 2 3 4 5 6 7 8 9 |
| GO ID | Tissue | Disease Stage | Description | Gene Ratio | Bg Ratio | pvalue | p.adjust | Count |
| GO:005160417 | Esophagus | HGIN | protein maturation | 68/2587 | 294/18723 | 9.77e-06 | 2.86e-04 | 68 |
| GO:00974282 | Esophagus | HGIN | protein maturation by iron-sulfur cluster transfer | 8/2587 | 16/18723 | 6.00e-04 | 8.41e-03 | 8 |
| GO:00162263 | Esophagus | HGIN | iron-sulfur cluster assembly | 10/2587 | 26/18723 | 1.60e-03 | 1.79e-02 | 10 |
| GO:00311633 | Esophagus | HGIN | metallo-sulfur cluster assembly | 10/2587 | 26/18723 | 1.60e-03 | 1.79e-02 | 10 |
| GO:005160418 | Esophagus | ESCC | protein maturation | 189/8552 | 294/18723 | 7.64e-11 | 2.39e-09 | 189 |
| GO:00067906 | Esophagus | ESCC | sulfur compound metabolic process | 201/8552 | 339/18723 | 2.64e-07 | 3.94e-06 | 201 |
| GO:005507617 | Esophagus | ESCC | transition metal ion homeostasis | 87/8552 | 138/18723 | 2.85e-05 | 2.37e-04 | 87 |
| GO:001622611 | Esophagus | ESCC | iron-sulfur cluster assembly | 21/8552 | 26/18723 | 2.69e-04 | 1.63e-03 | 21 |
| GO:003116311 | Esophagus | ESCC | metallo-sulfur cluster assembly | 21/8552 | 26/18723 | 2.69e-04 | 1.63e-03 | 21 |
| GO:009742811 | Esophagus | ESCC | protein maturation by iron-sulfur cluster transfer | 14/8552 | 16/18723 | 6.78e-04 | 3.56e-03 | 14 |
| GO:00469169 | Esophagus | ESCC | cellular transition metal ion homeostasis | 70/8552 | 115/18723 | 7.28e-04 | 3.79e-03 | 70 |
| GO:00550729 | Esophagus | ESCC | iron ion homeostasis | 52/8552 | 85/18723 | 2.86e-03 | 1.21e-02 | 52 |
| GO:00516046 | Liver | Cirrhotic | protein maturation | 121/4634 | 294/18723 | 3.54e-10 | 1.68e-08 | 121 |
| GO:000679011 | Liver | Cirrhotic | sulfur compound metabolic process | 129/4634 | 339/18723 | 3.06e-08 | 1.04e-06 | 129 |
| GO:00550766 | Liver | Cirrhotic | transition metal ion homeostasis | 59/4634 | 138/18723 | 2.59e-06 | 4.65e-05 | 59 |
| GO:00469164 | Liver | Cirrhotic | cellular transition metal ion homeostasis | 48/4634 | 115/18723 | 4.51e-05 | 5.30e-04 | 48 |
| GO:00550724 | Liver | Cirrhotic | iron ion homeostasis | 35/4634 | 85/18723 | 6.22e-04 | 4.79e-03 | 35 |
| GO:00106111 | Liver | Cirrhotic | regulation of cardiac muscle hypertrophy | 27/4634 | 69/18723 | 5.74e-03 | 2.88e-02 | 27 |
| GO:00068792 | Liver | Cirrhotic | cellular iron ion homeostasis | 26/4634 | 67/18723 | 7.53e-03 | 3.57e-02 | 26 |
| GO:0014743 | Liver | Cirrhotic | regulation of muscle hypertrophy | 27/4634 | 72/18723 | 1.10e-02 | 4.81e-02 | 27 |
| Page: 1 2 3 4 5 |
| Pathway ID | Tissue | Disease Stage | Description | Gene Ratio | Bg Ratio | pvalue | p.adjust | qvalue | Count |
| Page: 1 |
Top |
Cell-cell communication analysis |
| Identification of potential cell-cell interactions between two cell types and their ligand-receptor pairs for different disease states |
| Ligand | Receptor | LRpair | Pathway | Tissue | Disease Stage |
| Page: 1 |
Top |
Single-cell gene regulatory network inference analysis |
| Find out the significant the regulons (TFs) and the target genes of each regulon across cell types for different disease states |
| TF | Cell Type | Tissue | Disease Stage | Target Gene | RSS | Regulon Activity |
| ∗The dot plots of a searched regulon are shown for all cell subpopulations in each disease state of each tissue based on the regulon specific score inferred using pySCENIC and by calculating the average expression. |
| Page: 1 |
Top |
Somatic mutation of malignant transformation related genes |
| Annotation of somatic variants for genes involved in malignant transformation |
| Hugo Symbol | Variant Class | Variant Classification | dbSNP RS | HGVSc | HGVSp | HGVSp Short | SWISSPROT | BIOTYPE | SIFT | PolyPhen | Tumor Sample Barcode | Tissue | Histology | Sex | Age | Stage | Therapy Types | Drugs | Outcome |
| GLRX3 | SNV | Missense_Mutation | novel | c.414N>T | p.Lys138Asn | p.K138N | O76003 | protein_coding | deleterious(0.02) | possibly_damaging(0.558) | TCGA-AN-A046-01 | Breast | breast invasive carcinoma | Female | >=65 | I/II | Unknown | Unknown | SD |
| GLRX3 | SNV | Missense_Mutation | rs373775553 | c.611A>G | p.Tyr204Cys | p.Y204C | O76003 | protein_coding | deleterious(0) | probably_damaging(1) | TCGA-AR-A24Q-01 | Breast | breast invasive carcinoma | Female | <65 | I/II | Chemotherapy | doxorubicin | SD |
| GLRX3 | SNV | Missense_Mutation | novel | c.694N>A | p.Ala232Thr | p.A232T | O76003 | protein_coding | tolerated(0.33) | benign(0.006) | TCGA-VS-A9UJ-01 | Cervix | cervical & endocervical cancer | Female | <65 | I/II | Unknown | Unknown | PD |
| GLRX3 | SNV | Missense_Mutation | novel | c.576N>C | p.Lys192Asn | p.K192N | O76003 | protein_coding | deleterious(0) | probably_damaging(1) | TCGA-A6-3809-01 | Colorectum | colon adenocarcinoma | Female | >=65 | I/II | Unknown | Unknown | SD |
| GLRX3 | SNV | Missense_Mutation | novel | c.127N>C | p.Ala43Pro | p.A43P | O76003 | protein_coding | deleterious(0) | probably_damaging(0.994) | TCGA-AA-3980-01 | Colorectum | colon adenocarcinoma | Female | >=65 | I/II | Unknown | Unknown | SD |
| GLRX3 | SNV | Missense_Mutation | rs775786978 | c.341N>A | p.Arg114Gln | p.R114Q | O76003 | protein_coding | tolerated(0.22) | benign(0.01) | TCGA-AA-3984-01 | Colorectum | colon adenocarcinoma | Female | <65 | I/II | Unknown | Unknown | SD |
| GLRX3 | SNV | Missense_Mutation | c.997N>A | p.Gly333Arg | p.G333R | O76003 | protein_coding | deleterious(0.02) | benign(0.14) | TCGA-AA-A010-01 | Colorectum | colon adenocarcinoma | Female | <65 | I/II | Chemotherapy | folinic | CR | |
| GLRX3 | SNV | Missense_Mutation | c.830A>G | p.Glu277Gly | p.E277G | O76003 | protein_coding | tolerated(0.13) | benign(0.005) | TCGA-AA-A01V-01 | Colorectum | colon adenocarcinoma | Male | <65 | I/II | Unknown | Unknown | SD | |
| GLRX3 | SNV | Missense_Mutation | c.464N>C | p.Gln155Pro | p.Q155P | O76003 | protein_coding | deleterious(0.05) | benign(0.334) | TCGA-AD-6895-01 | Colorectum | colon adenocarcinoma | Male | >=65 | III/IV | Unknown | Unknown | SD | |
| GLRX3 | SNV | Missense_Mutation | rs188360612 | c.151G>A | p.Glu51Lys | p.E51K | O76003 | protein_coding | tolerated(0.14) | benign(0.219) | TCGA-AZ-4315-01 | Colorectum | colon adenocarcinoma | Male | <65 | I/II | Unknown | Unknown | SD |
| Page: 1 2 3 4 5 |
Top |
Related drugs of malignant transformation related genes |
| Identification of chemicals and drugs interact with genes involved in malignant transfromation |
| (DGIdb 4.0) |
| Entrez ID | Symbol | Category | Interaction Types | Drug Claim Name | Drug Name | PMIDs |
| Page: 1 |

Copyright 2023-Present -The University of Texas Health Science Center at Houston |