Schematic overview of the cellular and molecular mechanisms involved in the cancer progression, including the proposed cellular and molecular mechanisms in cancer cells trajectory. AT1: alveolar type 1 cells; AT2: alveolar type 2 cells; AAH: atypical adenomatous hyperplasia; AIS: adenocarcinoma in situ; MIA: minimally invasive adenocarcinoma; IA: invasive adenocarcinoma; EMT: epithelial-mesenchymal transition

Home

Download

Statistics

Help

Contact

Center for Computational Systems Medicine
leaf

Gene summary

leaf

Malignant transformation analysis

leaf

Malignant transformation related pathway analysis

leaf

Cell-cell communication analysis

leaf

Single-cell gene regulatory network inference analysis

leaf

Somatic mutation of malignant transformation related genes

leaf

Related drugs of malignant transformation related genes

Gene: GLRX2

Gene summary for GLRX2

check button Gene summary.

Gene informationSpeciesHuman
Gene symbol

GLRX2

Gene ID

51022

Gene nameglutaredoxin 2
Gene AliasCGI-133
Cytomap1q31.2
Gene Typeprotein-coding
GO ID

GO:0000302

UniProtAcc

Q9NS18


Top

Malignant transformation analysis

check button Identification of the aberrant gene expression in precancerous and cancerous lesions by comparing the gene expression of stem-like cells in diseased tissues with normal stem cells
check button Malignant transformation involving gene list.
Entrez IDSymbolReplicatesSpeciesOrganTissueAdj P-valueLog2FCMalignancy
51022GLRX2LZE4THumanEsophagusESCC9.56e-132.23e-010.0811
51022GLRX2LZE7THumanEsophagusESCC5.58e-093.58e-010.0667
51022GLRX2LZE20THumanEsophagusESCC3.53e-061.47e-010.0662
51022GLRX2LZE22THumanEsophagusESCC2.21e-044.81e-010.068
51022GLRX2LZE24THumanEsophagusESCC2.11e-123.86e-010.0596
51022GLRX2LZE21THumanEsophagusESCC1.74e-052.40e-010.0655
51022GLRX2LZE6THumanEsophagusESCC1.50e-031.32e-010.0845
51022GLRX2P1T-EHumanEsophagusESCC4.68e-064.07e-010.0875
51022GLRX2P2T-EHumanEsophagusESCC1.69e-112.50e-010.1177
51022GLRX2P4T-EHumanEsophagusESCC4.12e-237.34e-010.1323
51022GLRX2P5T-EHumanEsophagusESCC1.17e-285.48e-010.1327
51022GLRX2P8T-EHumanEsophagusESCC1.23e-066.03e-020.0889
51022GLRX2P9T-EHumanEsophagusESCC8.36e-185.13e-010.1131
51022GLRX2P10T-EHumanEsophagusESCC5.12e-111.52e-010.116
51022GLRX2P11T-EHumanEsophagusESCC2.83e-176.84e-010.1426
51022GLRX2P12T-EHumanEsophagusESCC3.51e-121.05e-010.1122
51022GLRX2P15T-EHumanEsophagusESCC3.22e-102.17e-010.1149
51022GLRX2P16T-EHumanEsophagusESCC2.34e-183.08e-010.1153
51022GLRX2P17T-EHumanEsophagusESCC3.21e-073.25e-010.1278
51022GLRX2P19T-EHumanEsophagusESCC1.04e-107.74e-010.1662
Page: 1 2 3 4 5 6 

check button Transcriptomic changes along malignancy continuum.
TissueExpression DynamicsAbbreviation
EsophagusThe image shows the transcriptomic changes along malignancy continuum.log2FC in expression of this searched gene in stem-like cells from each diseased tissue sample relative to stem-like cells in normal samples in each tissue plotted against the malignancy continuum. Samples are colored based on if they are from different disease stage.
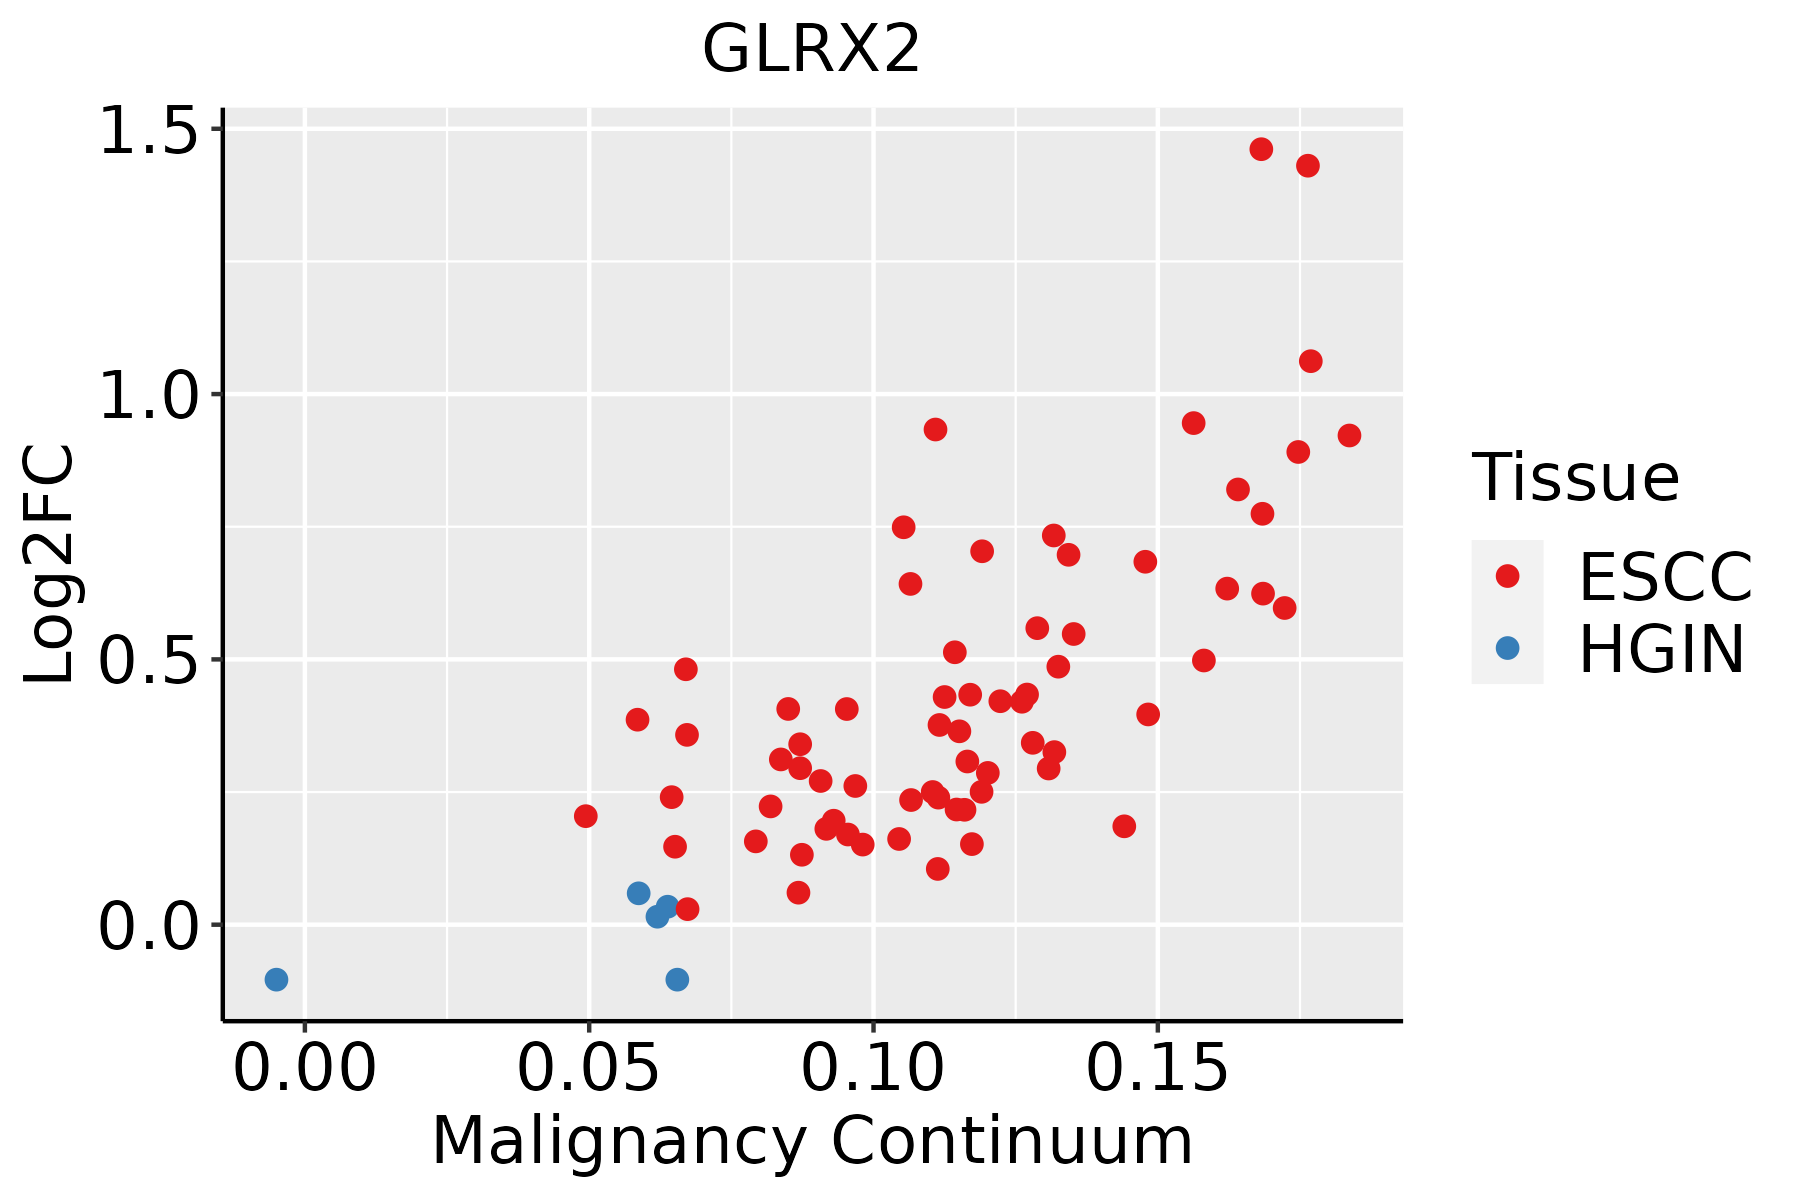
ESCC: Esophageal squamous cell carcinoma
HGIN: High-grade intraepithelial neoplasias
LGIN: Low-grade intraepithelial neoplasias
LiverThe image shows the transcriptomic changes along malignancy continuum.log2FC in expression of this searched gene in stem-like cells from each diseased tissue sample relative to stem-like cells in normal samples in each tissue plotted against the malignancy continuum. Samples are colored based on if they are from different disease stage.
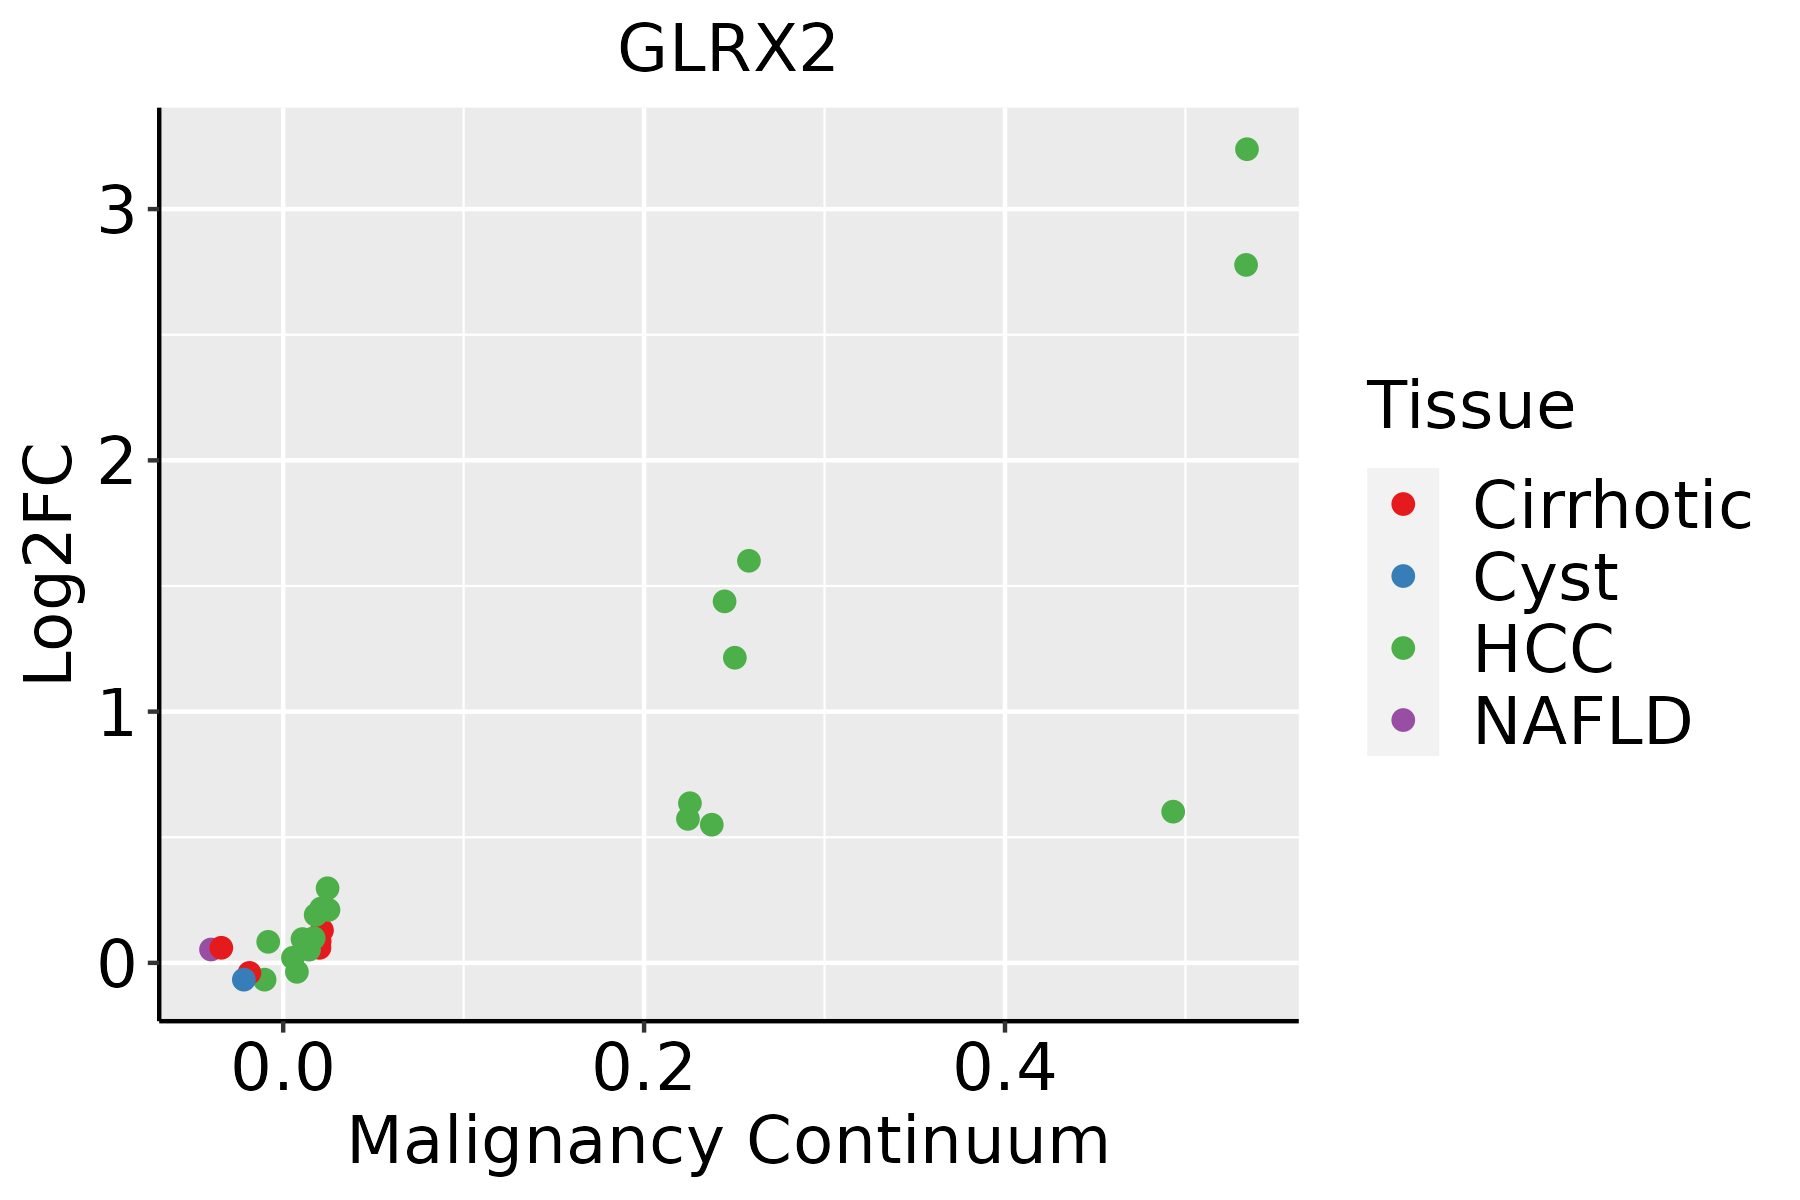
HCC: Hepatocellular carcinoma
NAFLD: Non-alcoholic fatty liver disease
Oral CavityThe image shows the transcriptomic changes along malignancy continuum.log2FC in expression of this searched gene in stem-like cells from each diseased tissue sample relative to stem-like cells in normal samples in each tissue plotted against the malignancy continuum. Samples are colored based on if they are from different disease stage.
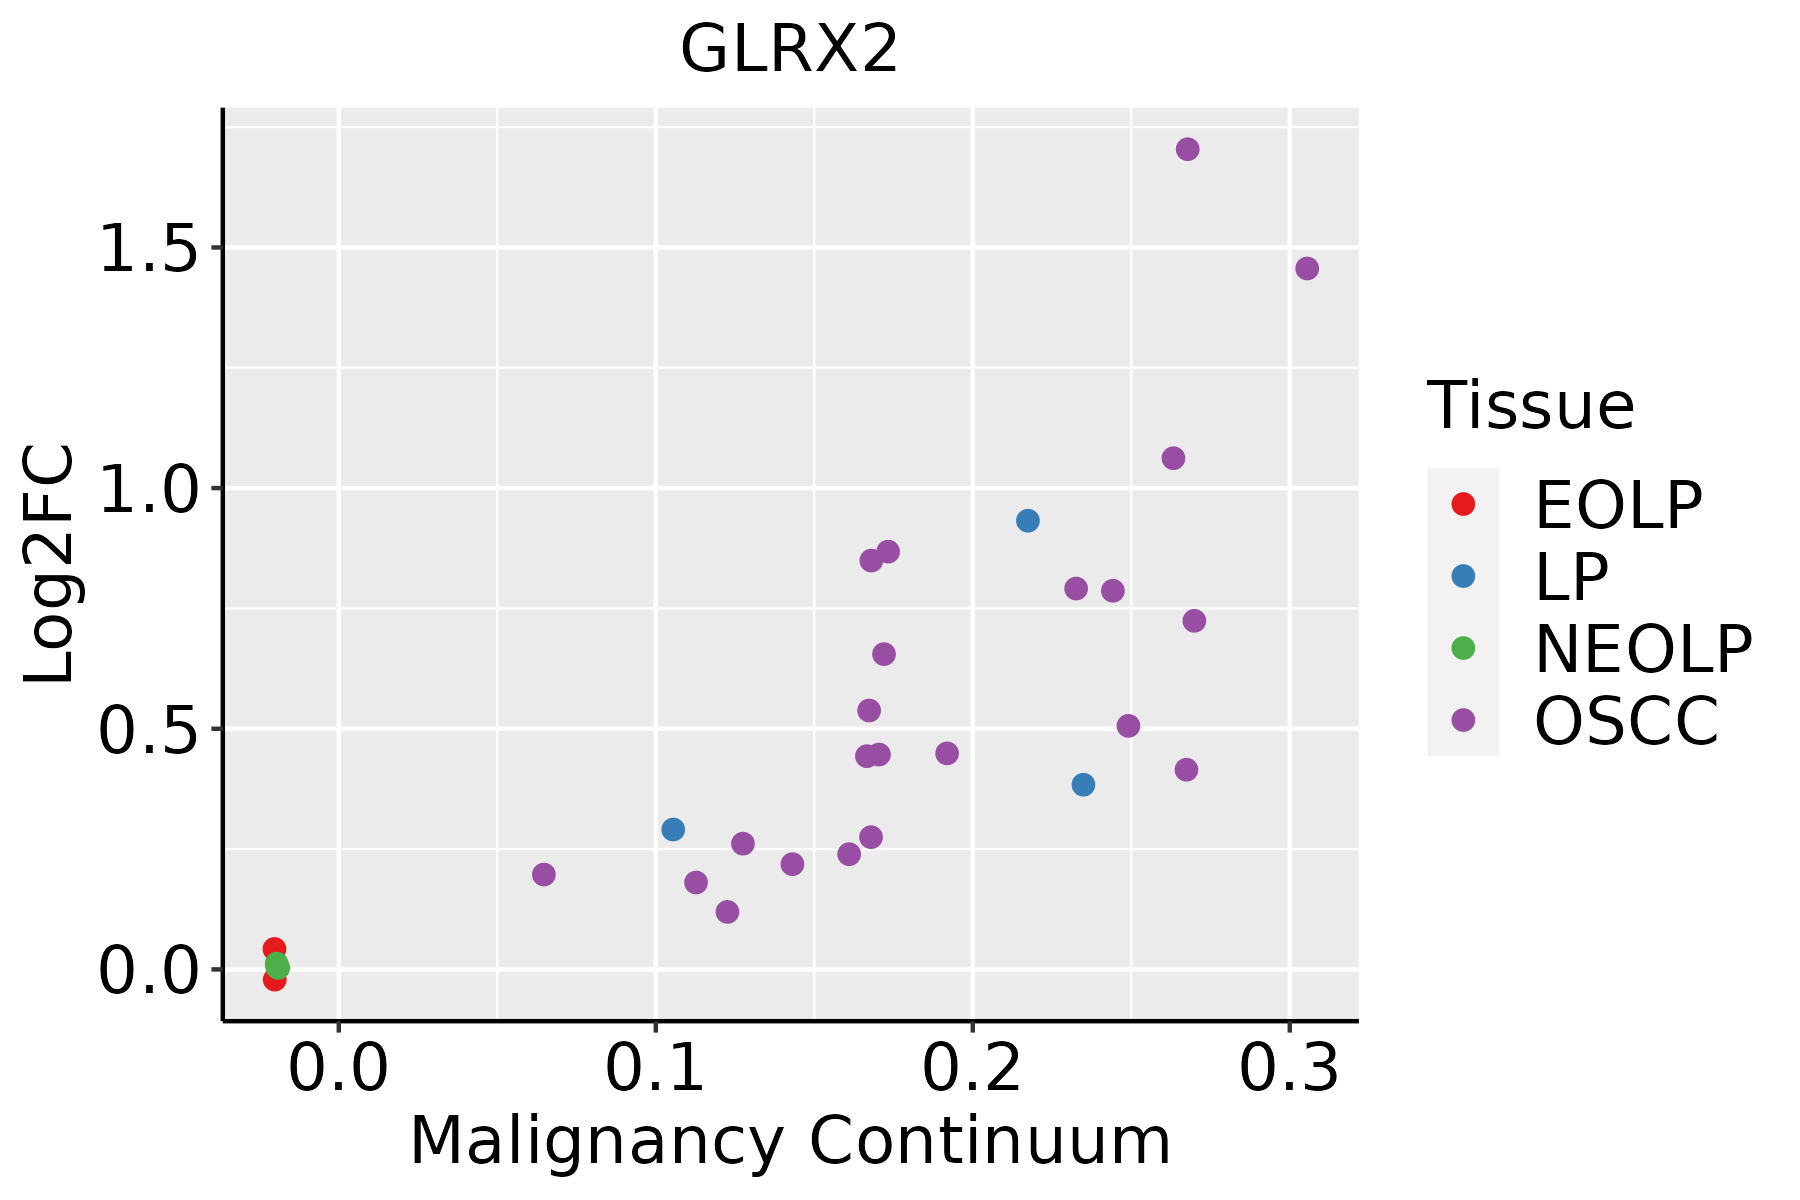
EOLP: Erosive Oral lichen planus
LP: leukoplakia
NEOLP: Non-erosive oral lichen planus
OSCC: Oral squamous cell carcinoma
ProstateThe image shows the transcriptomic changes along malignancy continuum.log2FC in expression of this searched gene in stem-like cells from each diseased tissue sample relative to stem-like cells in normal samples in each tissue plotted against the malignancy continuum. Samples are colored based on if they are from different disease stage.BPH: Benign Prostatic Hyperplasia
SkinThe image shows the transcriptomic changes along malignancy continuum.log2FC in expression of this searched gene in stem-like cells from each diseased tissue sample relative to stem-like cells in normal samples in each tissue plotted against the malignancy continuum. Samples are colored based on if they are from different disease stage.
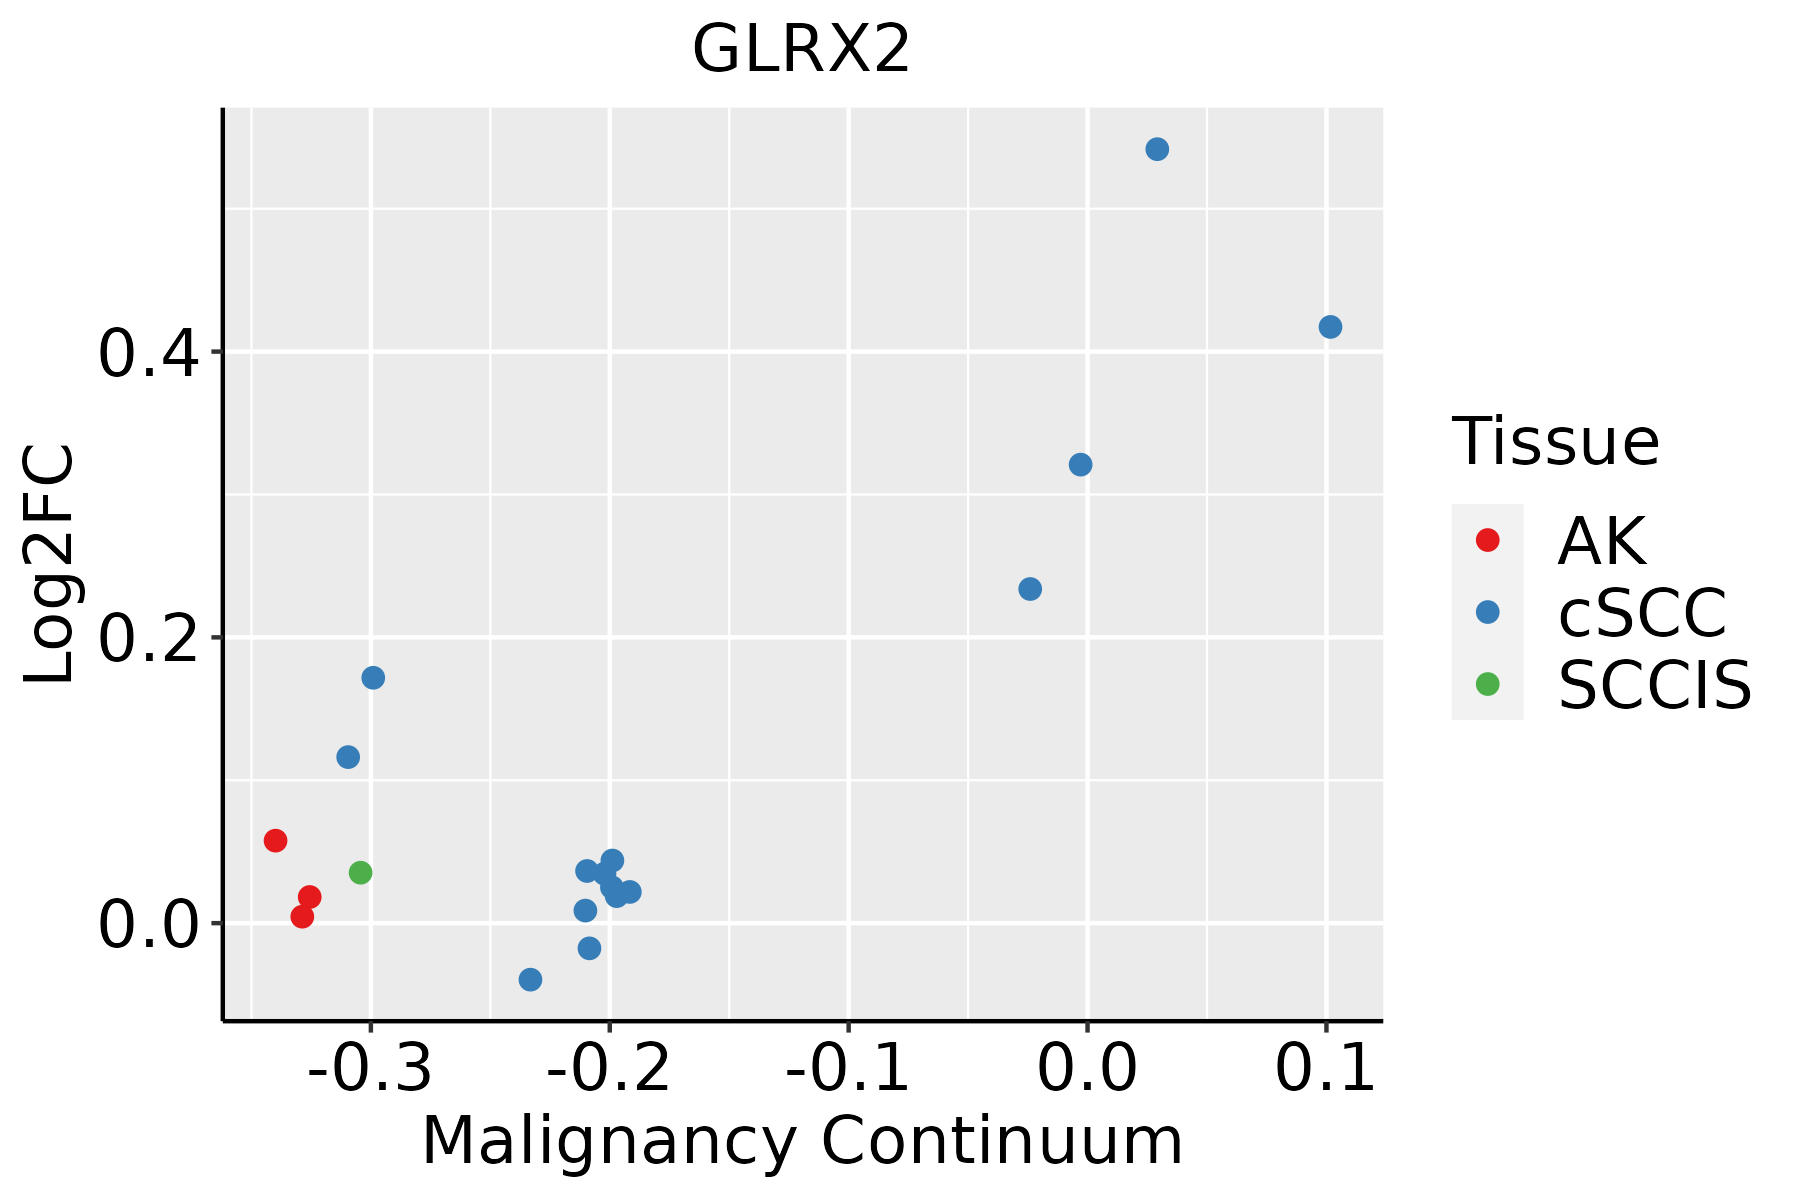
AK: Actinic keratosis
cSCC: Cutaneous squamous cell carcinoma
SCCIS:squamous cell carcinoma in situ
ThyroidThe image shows the transcriptomic changes along malignancy continuum.log2FC in expression of this searched gene in stem-like cells from each diseased tissue sample relative to stem-like cells in normal samples in each tissue plotted against the malignancy continuum. Samples are colored based on if they are from different disease stage.ATC: Anaplastic thyroid cancer
HT: Hashimoto's thyroiditis
PTC: Papillary thyroid cancer
∗log2FC in expression of this searched gene in stem-like cells from each diseased tissue sample relative to stem-like cells in normal samples in each tissue plotted against the malignancy continuum. Samples are colored based on if they are from different disease stage.

Top

Malignant transformation related pathway analysis

check buttonFind out the enriched GO biological processes and KEGG pathways involved in transition from healthy to precancer to cancer
check button Figure of enriched GO biological processes.
TissueDisease StageEnriched GO biological Processes
ColorectumADGO analysis - Figure of enriched GO biological processes: Top 15 enriched GO BP terms are showed in the bar plot of each disease state in each tissue. Each row represents a significant GO biological process which is colored according to the -log10(p.adjust).
ColorectumSERGO analysis - Figure of enriched GO biological processes: Top 15 enriched GO BP terms are showed in the bar plot of each disease state in each tissue. Each row represents a significant GO biological process which is colored according to the -log10(p.adjust).
ColorectumMSSGO analysis - Figure of enriched GO biological processes: Top 15 enriched GO BP terms are showed in the bar plot of each disease state in each tissue. Each row represents a significant GO biological process which is colored according to the -log10(p.adjust).
ColorectumMSI-HGO analysis - Figure of enriched GO biological processes: Top 15 enriched GO BP terms are showed in the bar plot of each disease state in each tissue. Each row represents a significant GO biological process which is colored according to the -log10(p.adjust).
ColorectumFAPGO analysis - Figure of enriched GO biological processes: Top 15 enriched GO BP terms are showed in the bar plot of each disease state in each tissue. Each row represents a significant GO biological process which is colored according to the -log10(p.adjust).
∗Top 15 enriched GO BP terms are showed in the bar plot of each disease state in each tissue. Each row represents a significant GO biological process which is colored according to the -log10(p.adjust).
Page: 1 2 3 4 5 6 7 8 9 

check button Enriched GO biological processes.
GO IDTissueDisease StageDescriptionGene RatioBg Ratiopvaluep.adjustCount
GO:0006091110EsophagusESCCgeneration of precursor metabolites and energy331/8552490/187233.86e-238.45e-21331
GO:0006979111EsophagusESCCresponse to oxidative stress303/8552446/187237.15e-221.30e-19303
GO:0062197111EsophagusESCCcellular response to chemical stress234/8552337/187235.37e-195.97e-17234
GO:0022900110EsophagusESCCelectron transport chain133/8552175/187232.18e-161.67e-14133
GO:0034599111EsophagusESCCcellular response to oxidative stress197/8552288/187233.76e-152.15e-13197
GO:0071496111EsophagusESCCcellular response to external stimulus215/8552320/187234.29e-152.43e-13215
GO:0031668111EsophagusESCCcellular response to extracellular stimulus168/8552246/187234.93e-132.23e-11168
GO:0000302111EsophagusESCCresponse to reactive oxygen species150/8552222/187233.06e-111.02e-09150
GO:0042542111EsophagusESCCresponse to hydrogen peroxide102/8552146/187232.64e-095.81e-08102
GO:003461420EsophagusESCCcellular response to reactive oxygen species103/8552155/187231.34e-072.17e-06103
GO:00067906EsophagusESCCsulfur compound metabolic process201/8552339/187232.64e-073.94e-06201
GO:000756820EsophagusESCCaging201/8552339/187232.64e-073.94e-06201
GO:004545419EsophagusESCCcell redox homeostasis29/855235/187236.61e-066.75e-0529
GO:00065757EsophagusESCCcellular modified amino acid metabolic process112/8552188/187238.31e-056.06e-04112
GO:000926619EsophagusESCCresponse to temperature stimulus106/8552178/187231.30e-048.84e-04106
GO:000674912EsophagusESCCglutathione metabolic process42/855264/187231.01e-035.12e-0342
GO:000609122LiverHCCgeneration of precursor metabolites and energy340/7958490/187234.04e-342.85e-31340
GO:002290022LiverHCCelectron transport chain134/7958175/187233.32e-204.68e-18134
GO:000697922LiverHCCresponse to oxidative stress281/7958446/187239.75e-191.24e-16281
GO:006219722LiverHCCcellular response to chemical stress216/7958337/187236.86e-165.44e-14216
Page: 1 2 3 4 5 6 7 

check button Enriched KEGG pathways.
Pathway IDTissueDisease StageDescriptionGene RatioBg Ratiopvaluep.adjustqvalueCount
Page: 1 

Top

Cell-cell communication analysis

check buttonIdentification of potential cell-cell interactions between two cell types and their ligand-receptor pairs for different disease states
LigandReceptorLRpairPathwayTissueDisease Stage
Page: 1 

Top

Single-cell gene regulatory network inference analysis

check buttonFind out the significant the regulons (TFs) and the target genes of each regulon across cell types for different disease states
TFCell TypeTissueDisease StageTarget GeneRSSRegulon Activity
∗The dot plots of a searched regulon are shown for all cell subpopulations in each disease state of each tissue based on the regulon specific score inferred using pySCENIC and by calculating the average expression.
Page: 1 

Top

Somatic mutation of malignant transformation related genes

check buttonAnnotation of somatic variants for genes involved in malignant transformation
Hugo SymbolVariant ClassVariant ClassificationdbSNP RSHGVScHGVSpHGVSp ShortSWISSPROTBIOTYPESIFTPolyPhenTumor Sample BarcodeTissueHistologySexAgeStageTherapy TypesDrugsOutcome
GLRX2SNVMissense_Mutationrs1075661c.40N>Gp.Leu14Valp.L14VQ9NS18protein_codingtolerated_low_confidence(0.26)benign(0.007)TCGA-D8-A1JA-01Breastbreast invasive carcinomaFemale<65III/IVChemotherapyadriamycinPD
GLRX2SNVMissense_Mutationc.169N>Tp.Pro57Serp.P57SQ9NS18protein_codingtolerated(0.15)possibly_damaging(0.786)TCGA-HM-A3JK-01Cervixcervical & endocervical cancerFemale<65I/IIChemotherapycisplatinSD
GLRX2SNVMissense_Mutationc.440T>Cp.Leu147Serp.L147SQ9NS18protein_codingdeleterious(0)probably_damaging(0.999)TCGA-WS-AB45-01Colorectumcolon adenocarcinomaFemale<65I/IIUnknownUnknownSD
GLRX2deletionFrame_Shift_Delc.475delNp.Ser159ValfsTer22p.S159Vfs*22Q9NS18protein_codingTCGA-AD-A5EJ-01Colorectumcolon adenocarcinomaFemale>=65I/IIUnknownUnknownSD
GLRX2SNVMissense_Mutationnovelc.416A>Gp.His139Argp.H139RQ9NS18protein_codingtolerated(0.45)benign(0.001)TCGA-AJ-A23O-01Endometriumuterine corpus endometrioid carcinomaFemale>=65I/IIUnknownUnknownSD
GLRX2SNVMissense_Mutationnovelc.191N>Tp.Thr64Ilep.T64IQ9NS18protein_codingtolerated(0.46)benign(0.089)TCGA-AX-A0J1-01Endometriumuterine corpus endometrioid carcinomaFemale>=65I/IIUnknownUnknownSD
GLRX2SNVMissense_Mutationnovelc.206N>Ap.Cys69Tyrp.C69YQ9NS18protein_codingdeleterious(0)possibly_damaging(0.702)TCGA-D1-A103-01Endometriumuterine corpus endometrioid carcinomaFemale>=65I/IIUnknownUnknownSD
GLRX2SNVMissense_Mutationrs371533088c.160N>Ap.Ala54Thrp.A54TQ9NS18protein_codingtolerated(0.31)benign(0)TCGA-EO-A22U-01Endometriumuterine corpus endometrioid carcinomaFemale>=65I/IIUnknownUnknownSD
GLRX2SNVMissense_Mutationnovelc.359N>Tp.Arg120Ilep.R120IQ9NS18protein_codingdeleterious(0)probably_damaging(0.953)TCGA-EY-A1GI-01Endometriumuterine corpus endometrioid carcinomaFemale<65I/IIUnknownUnknownSD
GLRX2deletionFrame_Shift_Delc.475delAp.Ser159ValfsTer22p.S159Vfs*22Q9NS18protein_codingTCGA-AJ-A3BH-01Endometriumuterine corpus endometrioid carcinomaFemaleUnknownI/IIUnknownUnknownSD
Page: 1 2 

Top

Related drugs of malignant transformation related genes

check buttonIdentification of chemicals and drugs interact with genes involved in malignant transfromation
(DGIdb 4.0)
Entrez IDSymbolCategoryInteraction TypesDrug Claim NameDrug NamePMIDs
Page: 1