
|
|||||
|
 | |
| |
| |
| |
| |
| |
|
Gene: GLOD4 |
Gene summary for GLOD4 |
| Gene information | Species | Human | Gene symbol | GLOD4 | Gene ID | 51031 |
| Gene name | glyoxalase domain containing 4 | |
| Gene Alias | C17orf25 | |
| Cytomap | 17p13.3 | |
| Gene Type | protein-coding | GO ID | GO:0005575 | UniProtAcc | Q9HC38 |
Top |
Malignant transformation analysis |
| Identification of the aberrant gene expression in precancerous and cancerous lesions by comparing the gene expression of stem-like cells in diseased tissues with normal stem cells |
| Entrez ID | Symbol | Replicates | Species | Organ | Tissue | Adj P-value | Log2FC | Malignancy |
| 51031 | GLOD4 | HTA11_1938_2000001011 | Human | Colorectum | AD | 1.39e-02 | 3.08e-01 | -0.0811 |
| 51031 | GLOD4 | HTA11_78_2000001011 | Human | Colorectum | AD | 5.06e-03 | 2.19e-01 | -0.1088 |
| 51031 | GLOD4 | HTA11_347_2000001011 | Human | Colorectum | AD | 1.26e-07 | 3.25e-01 | -0.1954 |
| 51031 | GLOD4 | HTA11_7696_3000711011 | Human | Colorectum | AD | 8.98e-06 | 2.60e-01 | 0.0674 |
| 51031 | GLOD4 | HTA11_99999970781_79442 | Human | Colorectum | MSS | 5.32e-07 | 3.93e-01 | 0.294 |
| 51031 | GLOD4 | LZE2T | Human | Esophagus | ESCC | 3.24e-03 | 6.00e-01 | 0.082 |
| 51031 | GLOD4 | LZE4T | Human | Esophagus | ESCC | 1.45e-17 | 5.64e-01 | 0.0811 |
| 51031 | GLOD4 | LZE5T | Human | Esophagus | ESCC | 1.21e-03 | 4.44e-01 | 0.0514 |
| 51031 | GLOD4 | LZE7T | Human | Esophagus | ESCC | 4.92e-18 | 8.63e-01 | 0.0667 |
| 51031 | GLOD4 | LZE8T | Human | Esophagus | ESCC | 3.67e-12 | 3.48e-01 | 0.067 |
| 51031 | GLOD4 | LZE20T | Human | Esophagus | ESCC | 5.52e-05 | 2.17e-01 | 0.0662 |
| 51031 | GLOD4 | LZE22D1 | Human | Esophagus | HGIN | 1.04e-03 | 1.61e-01 | 0.0595 |
| 51031 | GLOD4 | LZE22T | Human | Esophagus | ESCC | 9.02e-03 | 3.95e-01 | 0.068 |
| 51031 | GLOD4 | LZE24T | Human | Esophagus | ESCC | 1.64e-21 | 6.84e-01 | 0.0596 |
| 51031 | GLOD4 | LZE21T | Human | Esophagus | ESCC | 3.05e-09 | 4.90e-01 | 0.0655 |
| 51031 | GLOD4 | LZE6T | Human | Esophagus | ESCC | 3.40e-08 | 5.44e-01 | 0.0845 |
| 51031 | GLOD4 | P1T-E | Human | Esophagus | ESCC | 1.67e-08 | 6.29e-01 | 0.0875 |
| 51031 | GLOD4 | P2T-E | Human | Esophagus | ESCC | 1.39e-40 | 7.81e-01 | 0.1177 |
| 51031 | GLOD4 | P4T-E | Human | Esophagus | ESCC | 3.80e-45 | 1.15e+00 | 0.1323 |
| 51031 | GLOD4 | P5T-E | Human | Esophagus | ESCC | 2.55e-19 | 3.95e-01 | 0.1327 |
| Page: 1 2 3 4 5 6 7 |
| Tissue | Expression Dynamics | Abbreviation |
| Colorectum (GSE201348) |  | FAP: Familial adenomatous polyposis |
| CRC: Colorectal cancer | ||
| Colorectum (HTA11) |  | AD: Adenomas |
| SER: Sessile serrated lesions | ||
| MSI-H: Microsatellite-high colorectal cancer | ||
| MSS: Microsatellite stable colorectal cancer | ||
| Esophagus | 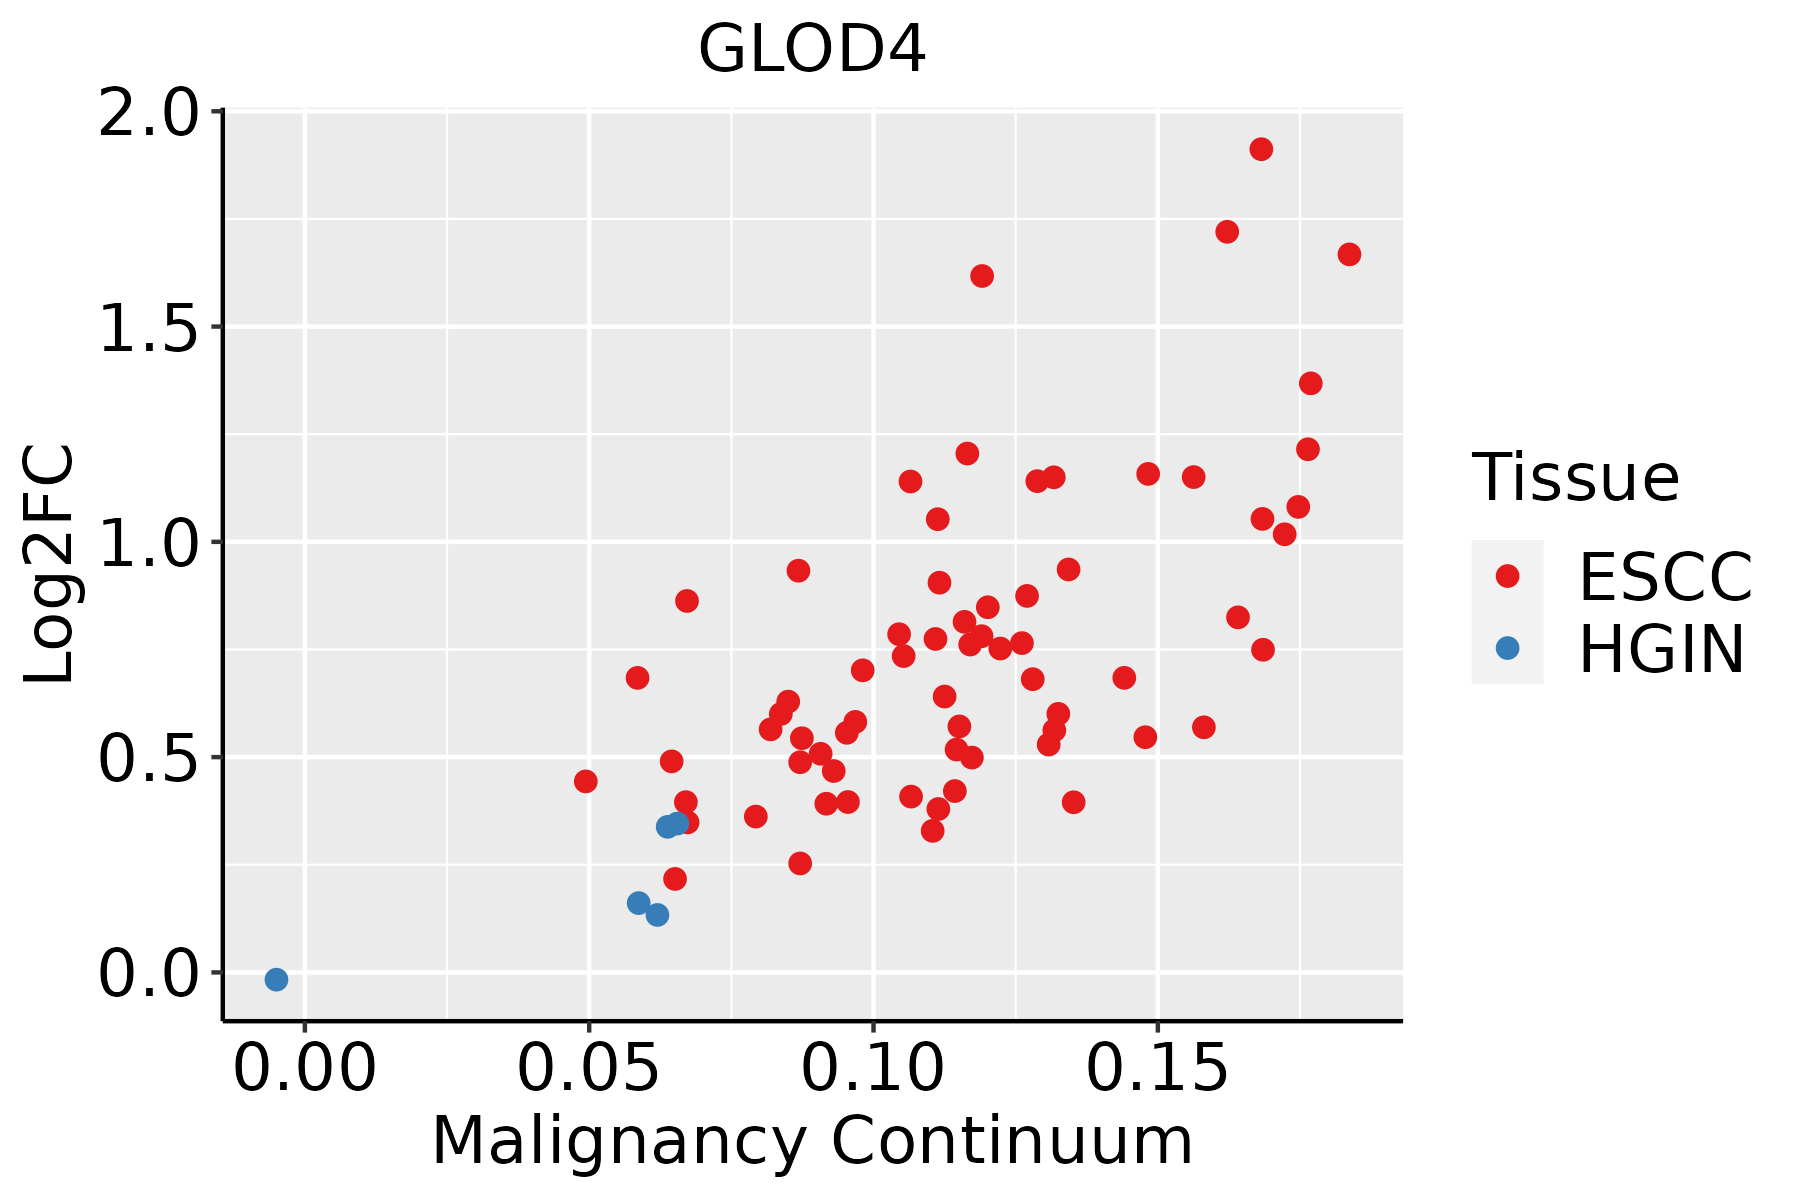 | ESCC: Esophageal squamous cell carcinoma |
| HGIN: High-grade intraepithelial neoplasias | ||
| LGIN: Low-grade intraepithelial neoplasias | ||
| Liver | 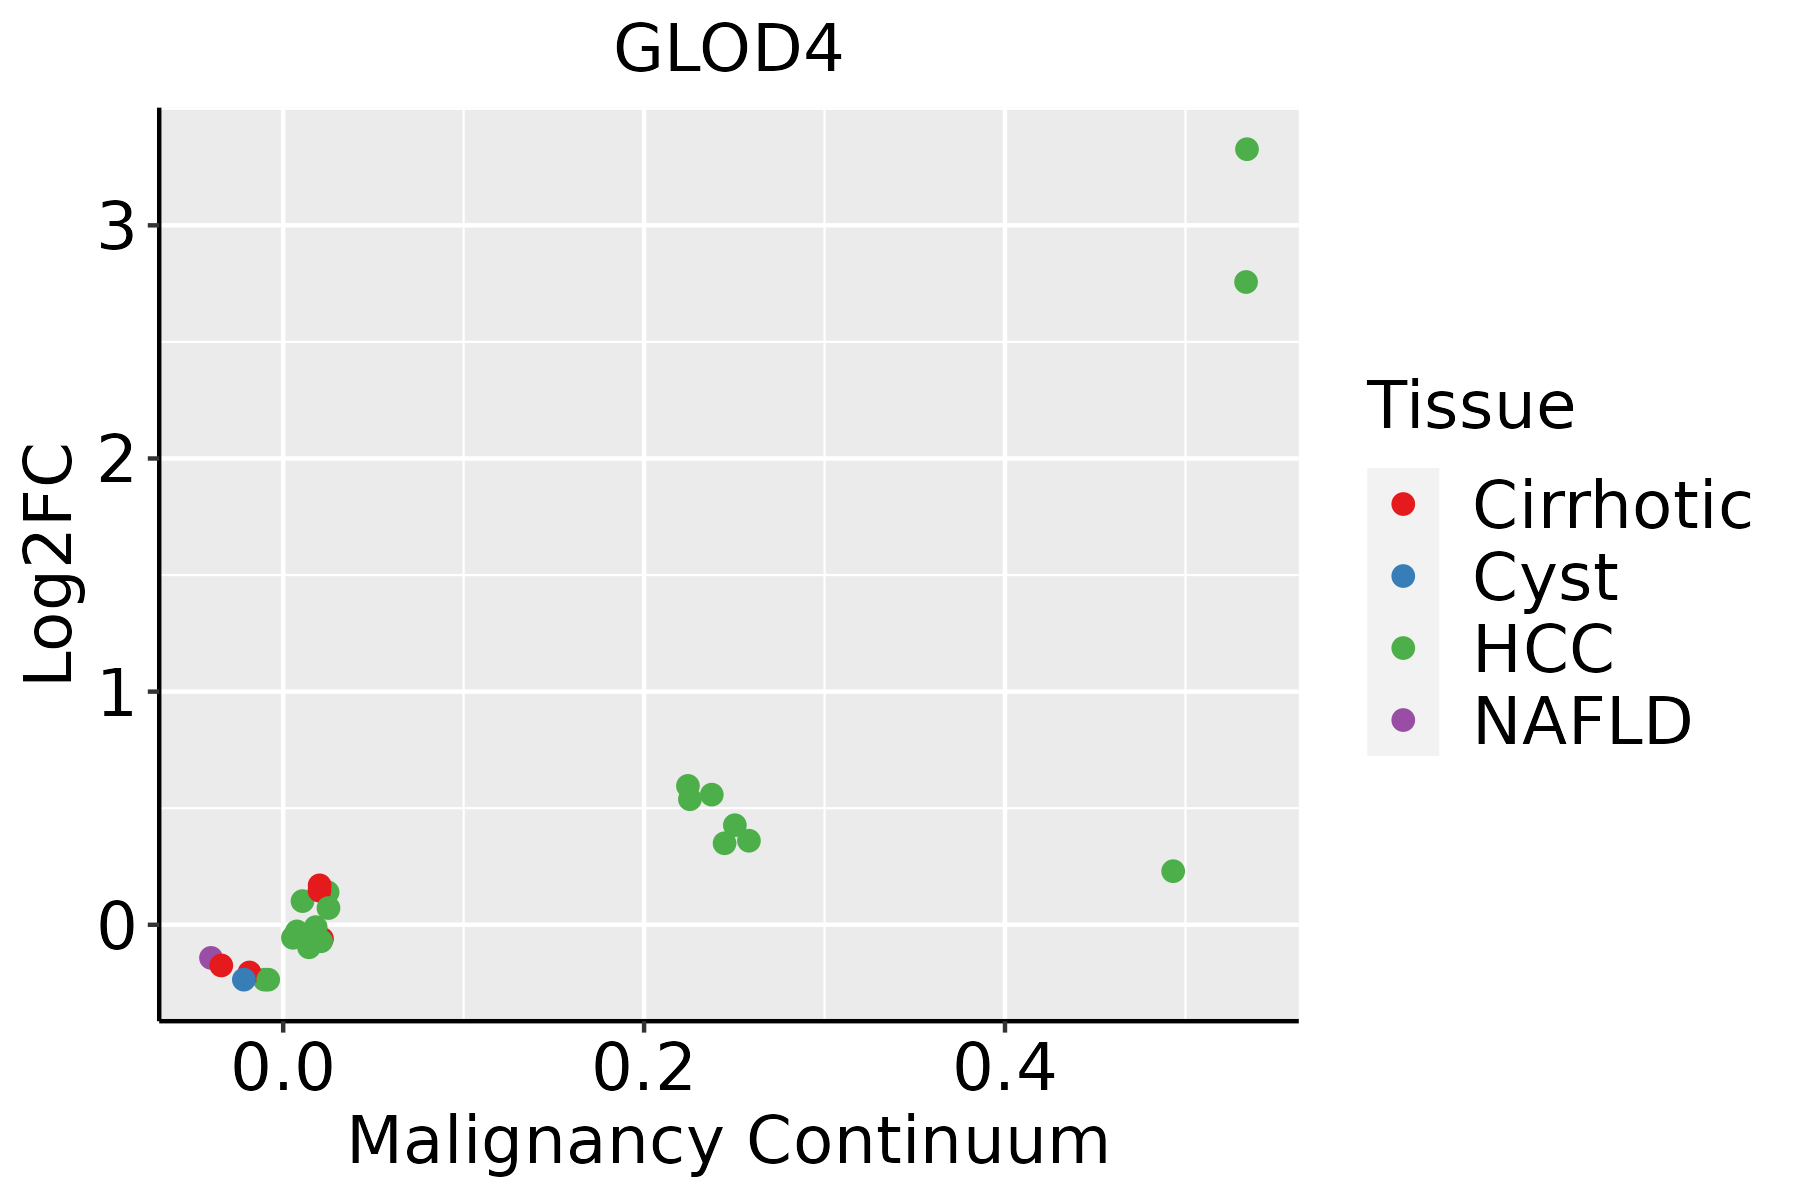 | HCC: Hepatocellular carcinoma |
| NAFLD: Non-alcoholic fatty liver disease | ||
| Oral Cavity | 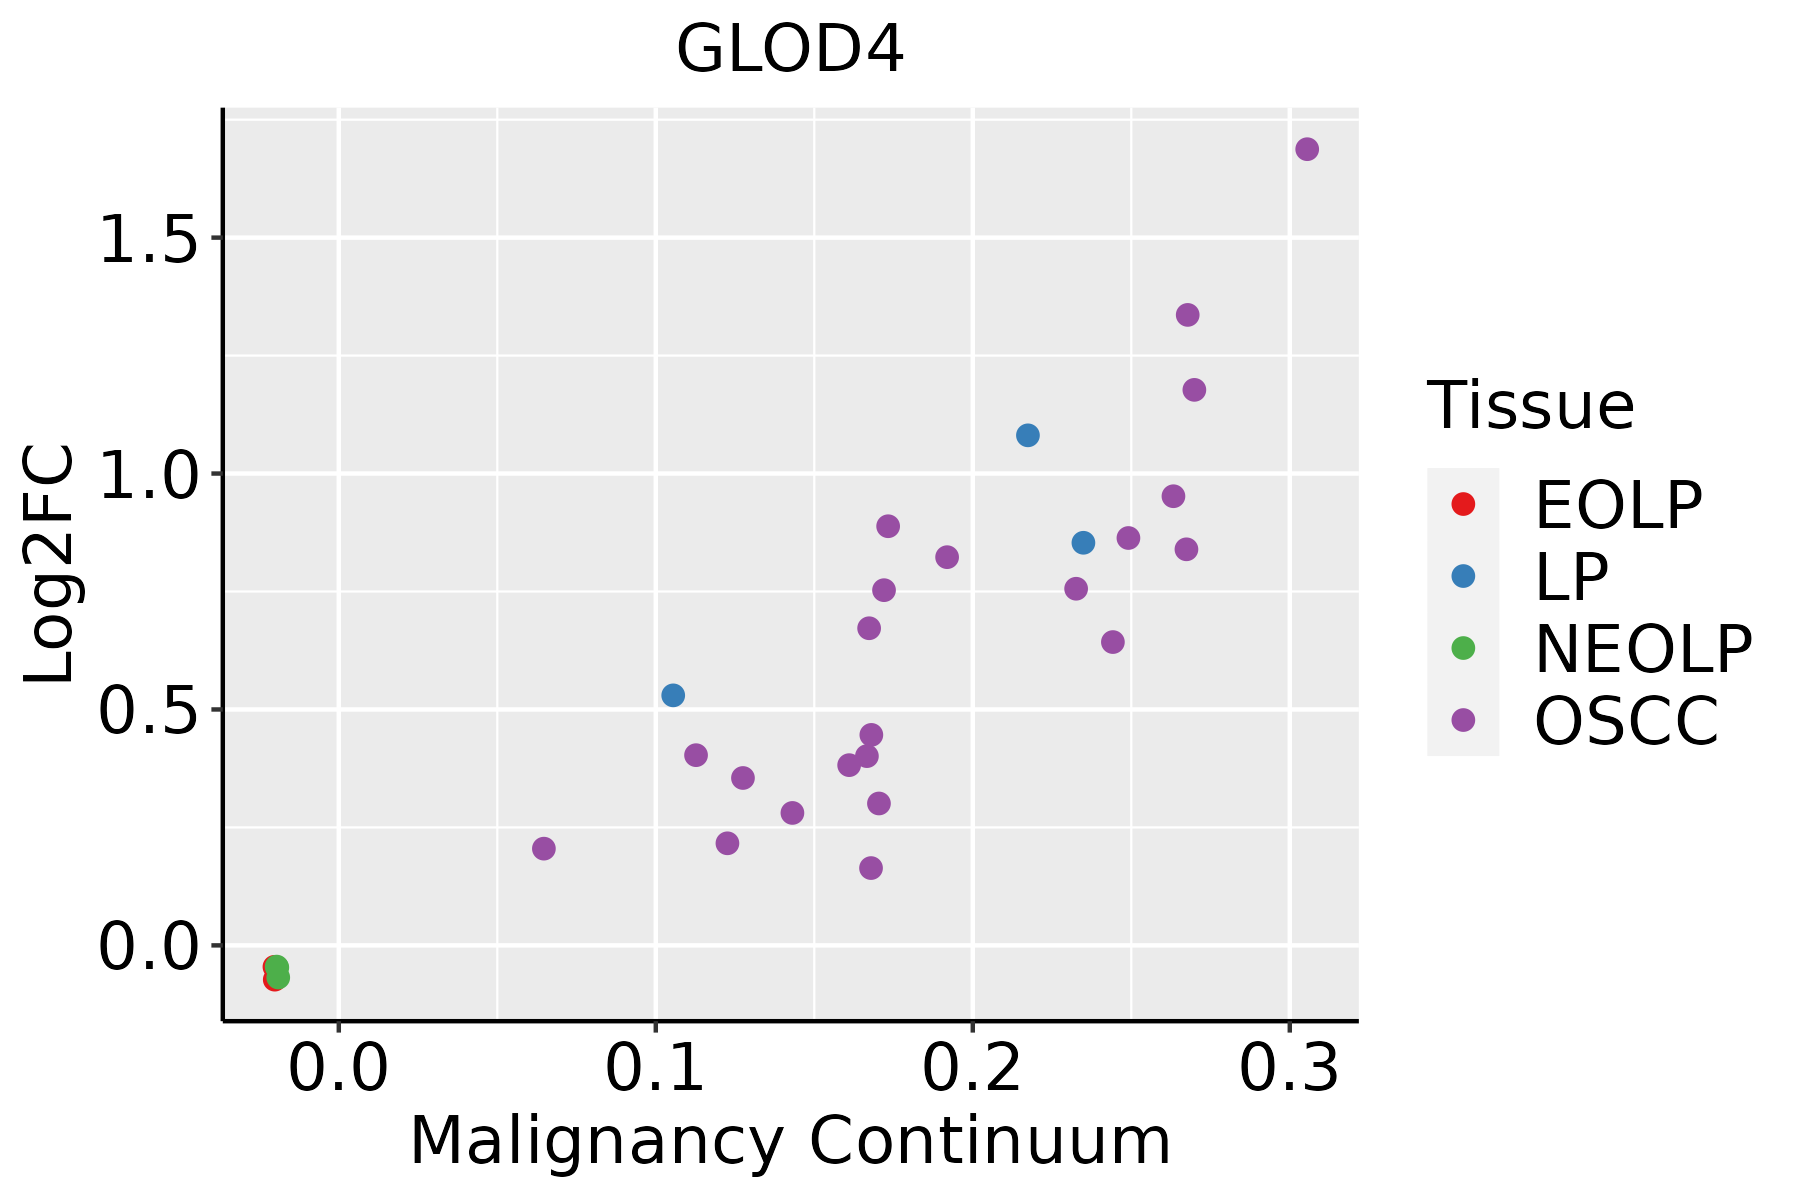 | EOLP: Erosive Oral lichen planus |
| LP: leukoplakia | ||
| NEOLP: Non-erosive oral lichen planus | ||
| OSCC: Oral squamous cell carcinoma | ||
| Skin | 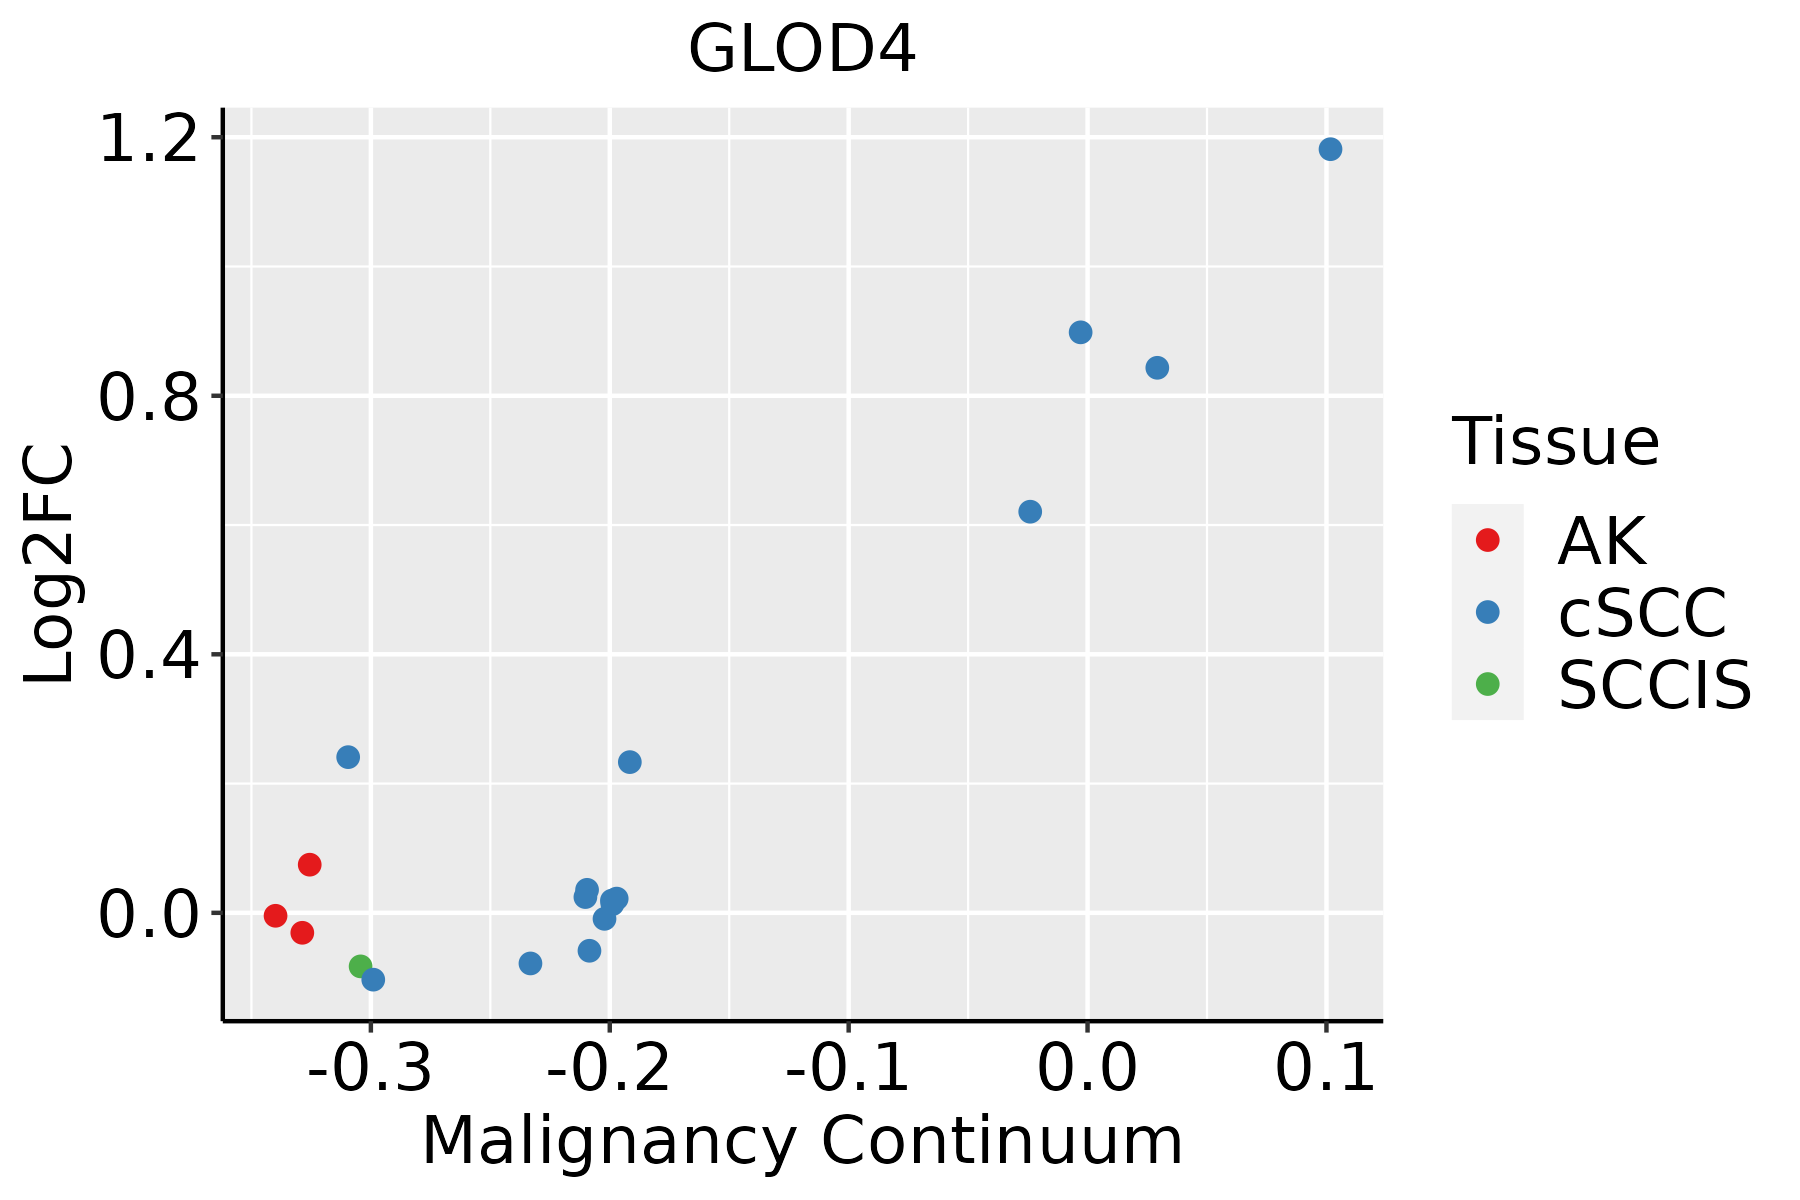 | AK: Actinic keratosis |
| cSCC: Cutaneous squamous cell carcinoma | ||
| SCCIS:squamous cell carcinoma in situ | ||
| Thyroid | 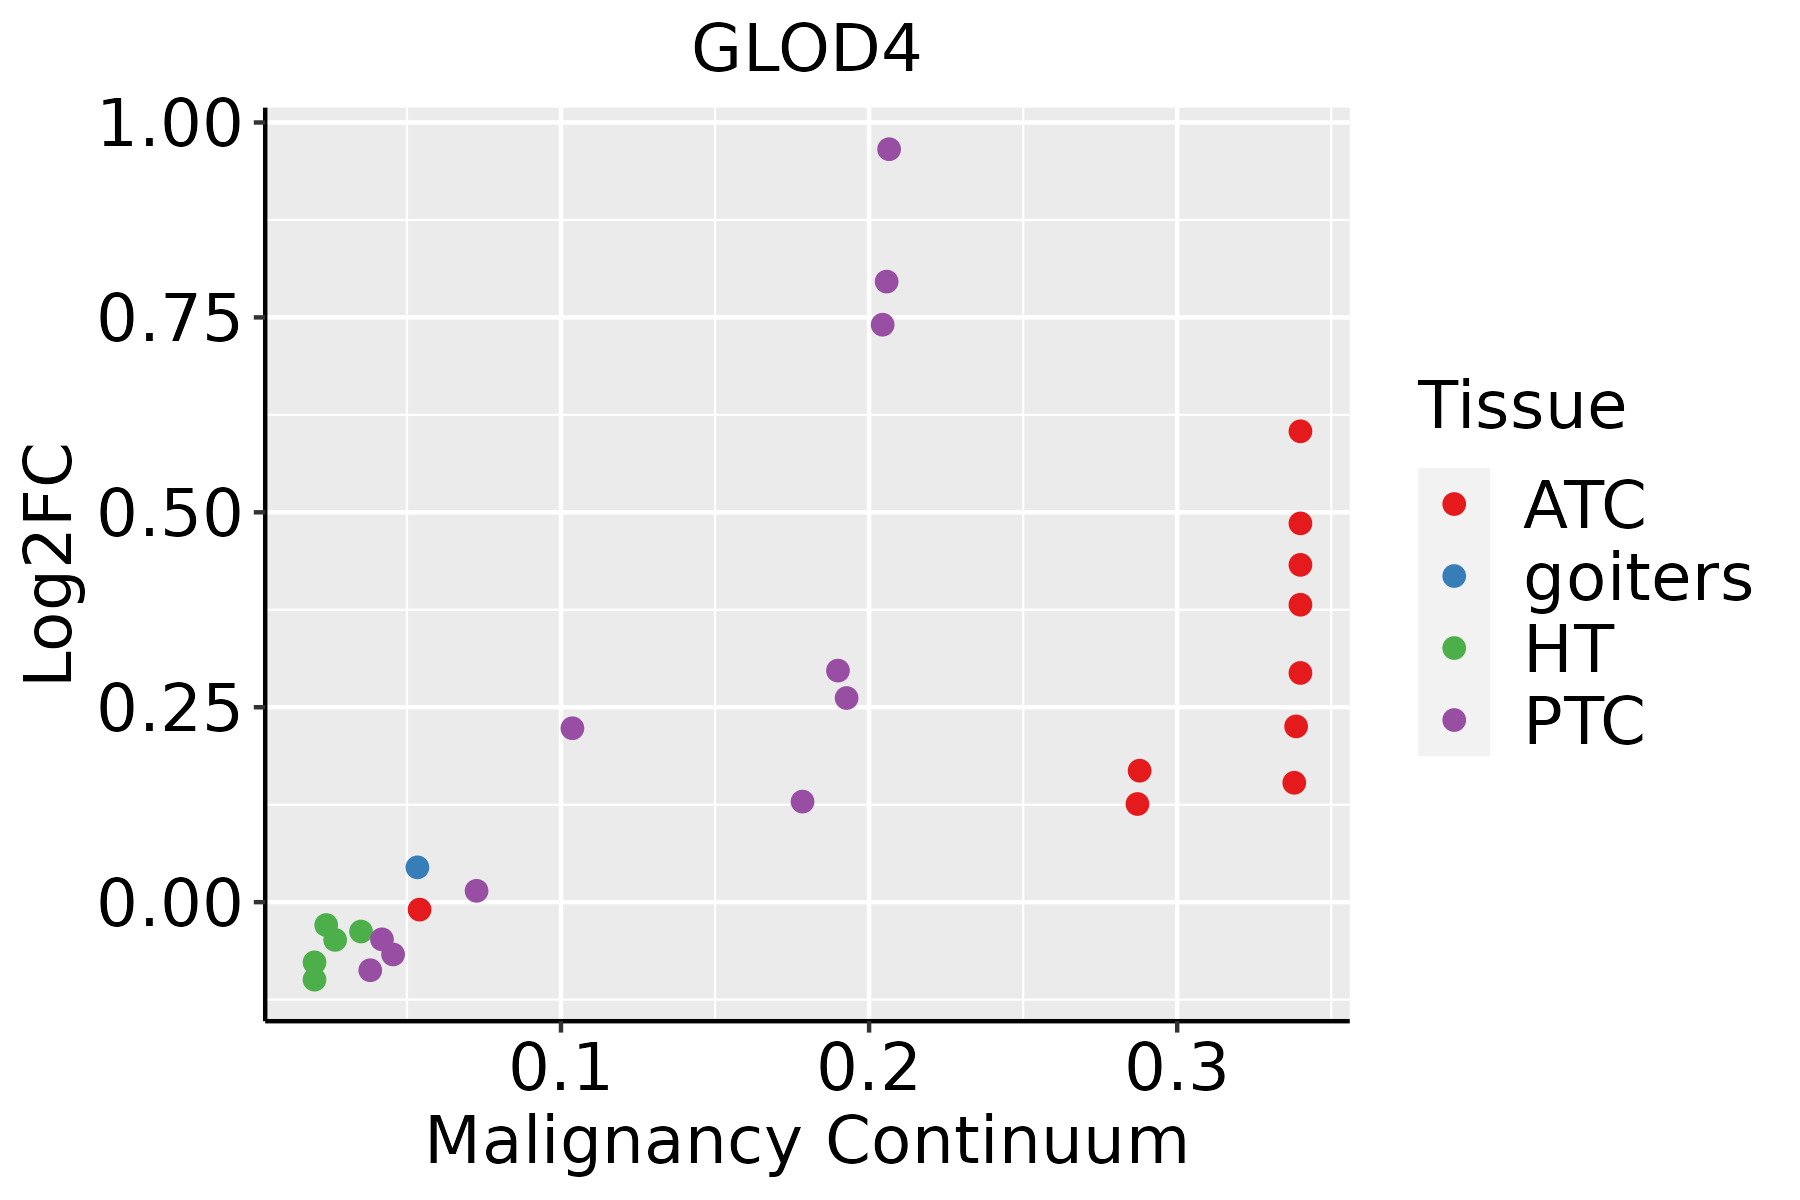 | ATC: Anaplastic thyroid cancer |
| HT: Hashimoto's thyroiditis | ||
| PTC: Papillary thyroid cancer |
| ∗log2FC in expression of this searched gene in stem-like cells from each diseased tissue sample relative to stem-like cells in normal samples in each tissue plotted against the malignancy continuum. Samples are colored based on if they are from different disease stage. |
Top |
Malignant transformation related pathway analysis |
| Find out the enriched GO biological processes and KEGG pathways involved in transition from healthy to precancer to cancer |
| Tissue | Disease Stage | Enriched GO biological Processes |
| Colorectum | AD |  |
| Colorectum | SER |  |
| Colorectum | MSS |  |
| Colorectum | MSI-H |  |
| Colorectum | FAP |  |
| ∗Top 15 enriched GO BP terms are showed in the bar plot of each disease state in each tissue. Each row represents a significant GO biological process which is colored according to the -log10(p.adjust). |
| Page: 1 2 3 4 5 6 7 8 9 |
| GO ID | Tissue | Disease Stage | Description | Gene Ratio | Bg Ratio | pvalue | p.adjust | Count |
| Page: 1 |
| Pathway ID | Tissue | Disease Stage | Description | Gene Ratio | Bg Ratio | pvalue | p.adjust | qvalue | Count |
| Page: 1 |
Top |
Cell-cell communication analysis |
| Identification of potential cell-cell interactions between two cell types and their ligand-receptor pairs for different disease states |
| Ligand | Receptor | LRpair | Pathway | Tissue | Disease Stage |
| Page: 1 |
Top |
Single-cell gene regulatory network inference analysis |
| Find out the significant the regulons (TFs) and the target genes of each regulon across cell types for different disease states |
| TF | Cell Type | Tissue | Disease Stage | Target Gene | RSS | Regulon Activity |
| ∗The dot plots of a searched regulon are shown for all cell subpopulations in each disease state of each tissue based on the regulon specific score inferred using pySCENIC and by calculating the average expression. |
| Page: 1 |
Top |
Somatic mutation of malignant transformation related genes |
| Annotation of somatic variants for genes involved in malignant transformation |
| Hugo Symbol | Variant Class | Variant Classification | dbSNP RS | HGVSc | HGVSp | HGVSp Short | SWISSPROT | BIOTYPE | SIFT | PolyPhen | Tumor Sample Barcode | Tissue | Histology | Sex | Age | Stage | Therapy Types | Drugs | Outcome |
| GLOD4 | SNV | Missense_Mutation | c.87N>A | p.Met29Ile | p.M29I | Q9HC38 | protein_coding | deleterious(0) | probably_damaging(0.997) | TCGA-AC-A23H-01 | Breast | breast invasive carcinoma | Female | >=65 | I/II | Unknown | Unknown | PD | |
| GLOD4 | SNV | Missense_Mutation | novel | c.406N>T | p.Asp136Tyr | p.D136Y | Q9HC38 | protein_coding | deleterious(0) | probably_damaging(0.988) | TCGA-2W-A8YY-01 | Cervix | cervical & endocervical cancer | Female | <65 | I/II | Chemotherapy | cisplatin | CR |
| GLOD4 | SNV | Missense_Mutation | rs752349761 | c.704C>T | p.Pro235Leu | p.P235L | Q9HC38 | protein_coding | deleterious(0) | probably_damaging(1) | TCGA-C5-A902-01 | Cervix | cervical & endocervical cancer | Female | <65 | I/II | Chemotherapy | cisplatin | SD |
| GLOD4 | SNV | Missense_Mutation | novel | c.128N>G | p.Ala43Gly | p.A43G | Q9HC38 | protein_coding | deleterious(0) | benign(0) | TCGA-AZ-4315-01 | Colorectum | colon adenocarcinoma | Male | <65 | I/II | Unknown | Unknown | SD |
| GLOD4 | SNV | Missense_Mutation | novel | c.602N>T | p.Arg201Ile | p.R201I | Q9HC38 | protein_coding | deleterious(0) | probably_damaging(1) | TCGA-CA-6717-01 | Colorectum | colon adenocarcinoma | Male | <65 | I/II | Chemotherapy | oxaliplatin | CR |
| GLOD4 | SNV | Missense_Mutation | novel | c.164N>C | p.Lys55Thr | p.K55T | Q9HC38 | protein_coding | deleterious(0) | probably_damaging(0.999) | TCGA-AG-A002-01 | Colorectum | rectum adenocarcinoma | Male | <65 | I/II | Unknown | Unknown | SD |
| GLOD4 | SNV | Missense_Mutation | novel | c.322N>G | p.Thr108Ala | p.T108A | Q9HC38 | protein_coding | tolerated(0.61) | benign(0) | TCGA-F5-6814-01 | Colorectum | rectum adenocarcinoma | Male | <65 | I/II | Unknown | Unknown | SD |
| GLOD4 | SNV | Missense_Mutation | rs768237197 | c.352G>A | p.Glu118Lys | p.E118K | Q9HC38 | protein_coding | tolerated(0.46) | benign(0.024) | TCGA-A5-A0GN-01 | Endometrium | uterine corpus endometrioid carcinoma | Female | >=65 | I/II | Unknown | Unknown | SD |
| GLOD4 | SNV | Missense_Mutation | novel | c.562N>A | p.Gly188Ser | p.G188S | Q9HC38 | protein_coding | tolerated(0.76) | benign(0.046) | TCGA-AP-A1DK-01 | Endometrium | uterine corpus endometrioid carcinoma | Female | <65 | I/II | Unknown | Unknown | SD |
| GLOD4 | SNV | Missense_Mutation | novel | c.241N>G | p.Lys81Glu | p.K81E | Q9HC38 | protein_coding | tolerated(0.63) | benign(0.029) | TCGA-AX-A1CF-01 | Endometrium | uterine corpus endometrioid carcinoma | Female | >=65 | III/IV | Hormone Therapy | tamoxifen | PD |
| Page: 1 2 3 |
Top |
Related drugs of malignant transformation related genes |
| Identification of chemicals and drugs interact with genes involved in malignant transfromation |
| (DGIdb 4.0) |
| Entrez ID | Symbol | Category | Interaction Types | Drug Claim Name | Drug Name | PMIDs |
| Page: 1 |

Copyright 2023-Present -The University of Texas Health Science Center at Houston |