
|
|||||
|
 | |
| |
| |
| |
| |
| |
|
Gene: GLO1 |
Gene summary for GLO1 |
| Gene information | Species | Human | Gene symbol | GLO1 | Gene ID | 2739 |
| Gene name | glyoxalase I | |
| Gene Alias | GLOD1 | |
| Cytomap | 6p21.2 | |
| Gene Type | protein-coding | GO ID | GO:0002376 | UniProtAcc | Q04760 |
Top |
Malignant transformation analysis |
| Identification of the aberrant gene expression in precancerous and cancerous lesions by comparing the gene expression of stem-like cells in diseased tissues with normal stem cells |
| Entrez ID | Symbol | Replicates | Species | Organ | Tissue | Adj P-value | Log2FC | Malignancy |
| 2739 | GLO1 | HTA11_347_2000001011 | Human | Colorectum | AD | 1.90e-05 | 2.15e-01 | -0.1954 |
| 2739 | GLO1 | HTA11_6801_2000001011 | Human | Colorectum | SER | 2.43e-02 | 3.76e-01 | 0.0171 |
| 2739 | GLO1 | HTA11_6818_2000001021 | Human | Colorectum | AD | 1.87e-02 | 1.31e-01 | 0.0588 |
| 2739 | GLO1 | HTA11_99999970781_79442 | Human | Colorectum | MSS | 6.91e-14 | 5.46e-01 | 0.294 |
| 2739 | GLO1 | HTA11_99999965062_69753 | Human | Colorectum | MSI-H | 1.17e-02 | 8.90e-01 | 0.3487 |
| 2739 | GLO1 | HTA11_99999965104_69814 | Human | Colorectum | MSS | 2.81e-07 | 4.52e-01 | 0.281 |
| 2739 | GLO1 | HTA11_99999971662_82457 | Human | Colorectum | MSS | 1.76e-03 | 3.65e-01 | 0.3859 |
| 2739 | GLO1 | A015-C-203 | Human | Colorectum | FAP | 3.05e-03 | -8.60e-02 | -0.1294 |
| 2739 | GLO1 | A001-C-108 | Human | Colorectum | FAP | 4.20e-02 | -5.69e-02 | -0.0272 |
| 2739 | GLO1 | A015-C-104 | Human | Colorectum | FAP | 3.90e-03 | -8.94e-02 | -0.1899 |
| 2739 | GLO1 | LZE2T | Human | Esophagus | ESCC | 1.28e-11 | 2.09e+00 | 0.082 |
| 2739 | GLO1 | LZE4T | Human | Esophagus | ESCC | 1.55e-18 | 9.45e-01 | 0.0811 |
| 2739 | GLO1 | LZE5T | Human | Esophagus | ESCC | 1.46e-02 | 6.83e-01 | 0.0514 |
| 2739 | GLO1 | LZE7T | Human | Esophagus | ESCC | 1.93e-10 | 1.13e+00 | 0.0667 |
| 2739 | GLO1 | LZE8T | Human | Esophagus | ESCC | 7.39e-14 | 4.93e-01 | 0.067 |
| 2739 | GLO1 | LZE20T | Human | Esophagus | ESCC | 4.35e-13 | 6.80e-01 | 0.0662 |
| 2739 | GLO1 | LZE22D1 | Human | Esophagus | HGIN | 7.53e-03 | 2.71e-02 | 0.0595 |
| 2739 | GLO1 | LZE22T | Human | Esophagus | ESCC | 2.31e-07 | 8.80e-01 | 0.068 |
| 2739 | GLO1 | LZE24T | Human | Esophagus | ESCC | 1.28e-22 | 9.06e-01 | 0.0596 |
| 2739 | GLO1 | LZE22D3 | Human | Esophagus | HGIN | 3.98e-02 | 3.03e-01 | 0.0653 |
| Page: 1 2 3 4 5 6 7 8 |
| Tissue | Expression Dynamics | Abbreviation |
| Colorectum (GSE201348) |  | FAP: Familial adenomatous polyposis |
| CRC: Colorectal cancer | ||
| Colorectum (HTA11) |  | AD: Adenomas |
| SER: Sessile serrated lesions | ||
| MSI-H: Microsatellite-high colorectal cancer | ||
| MSS: Microsatellite stable colorectal cancer | ||
| Esophagus | 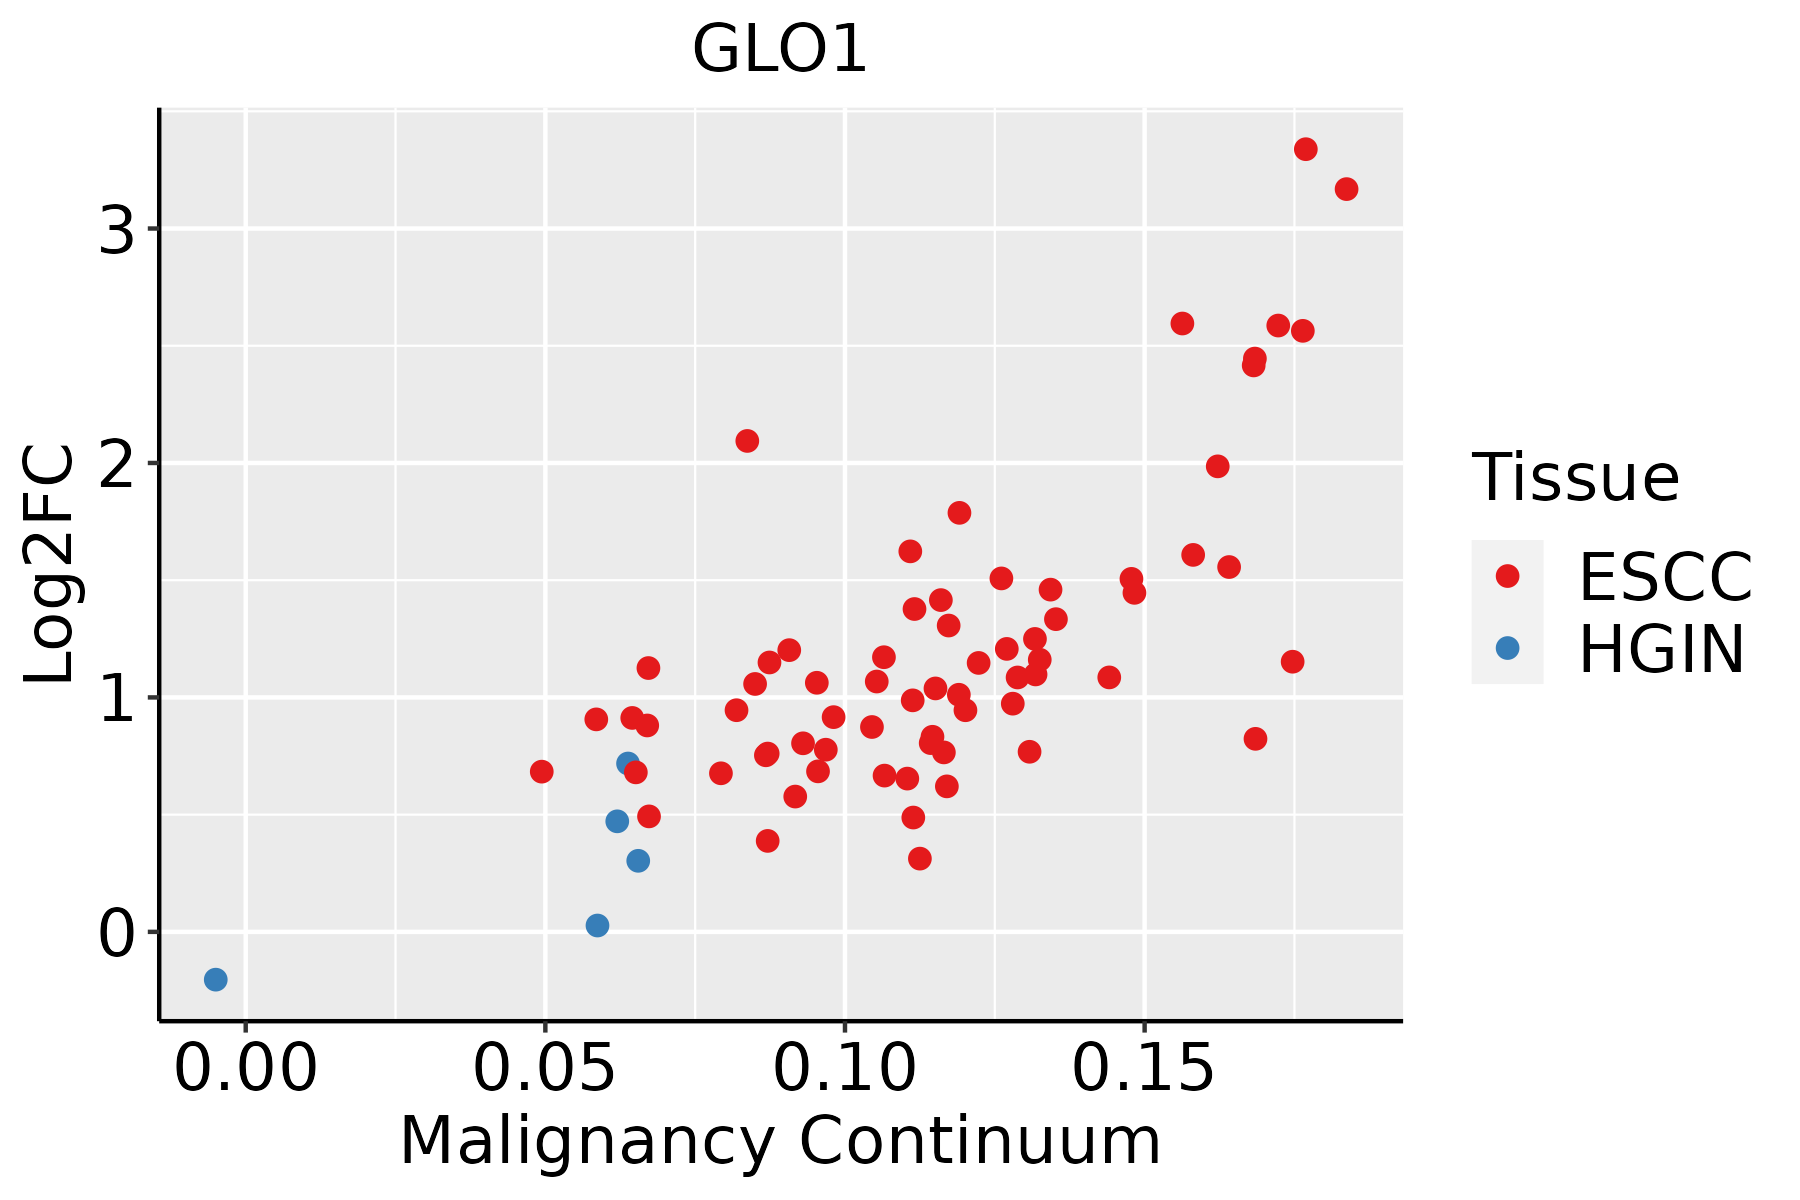 | ESCC: Esophageal squamous cell carcinoma |
| HGIN: High-grade intraepithelial neoplasias | ||
| LGIN: Low-grade intraepithelial neoplasias | ||
| Liver | 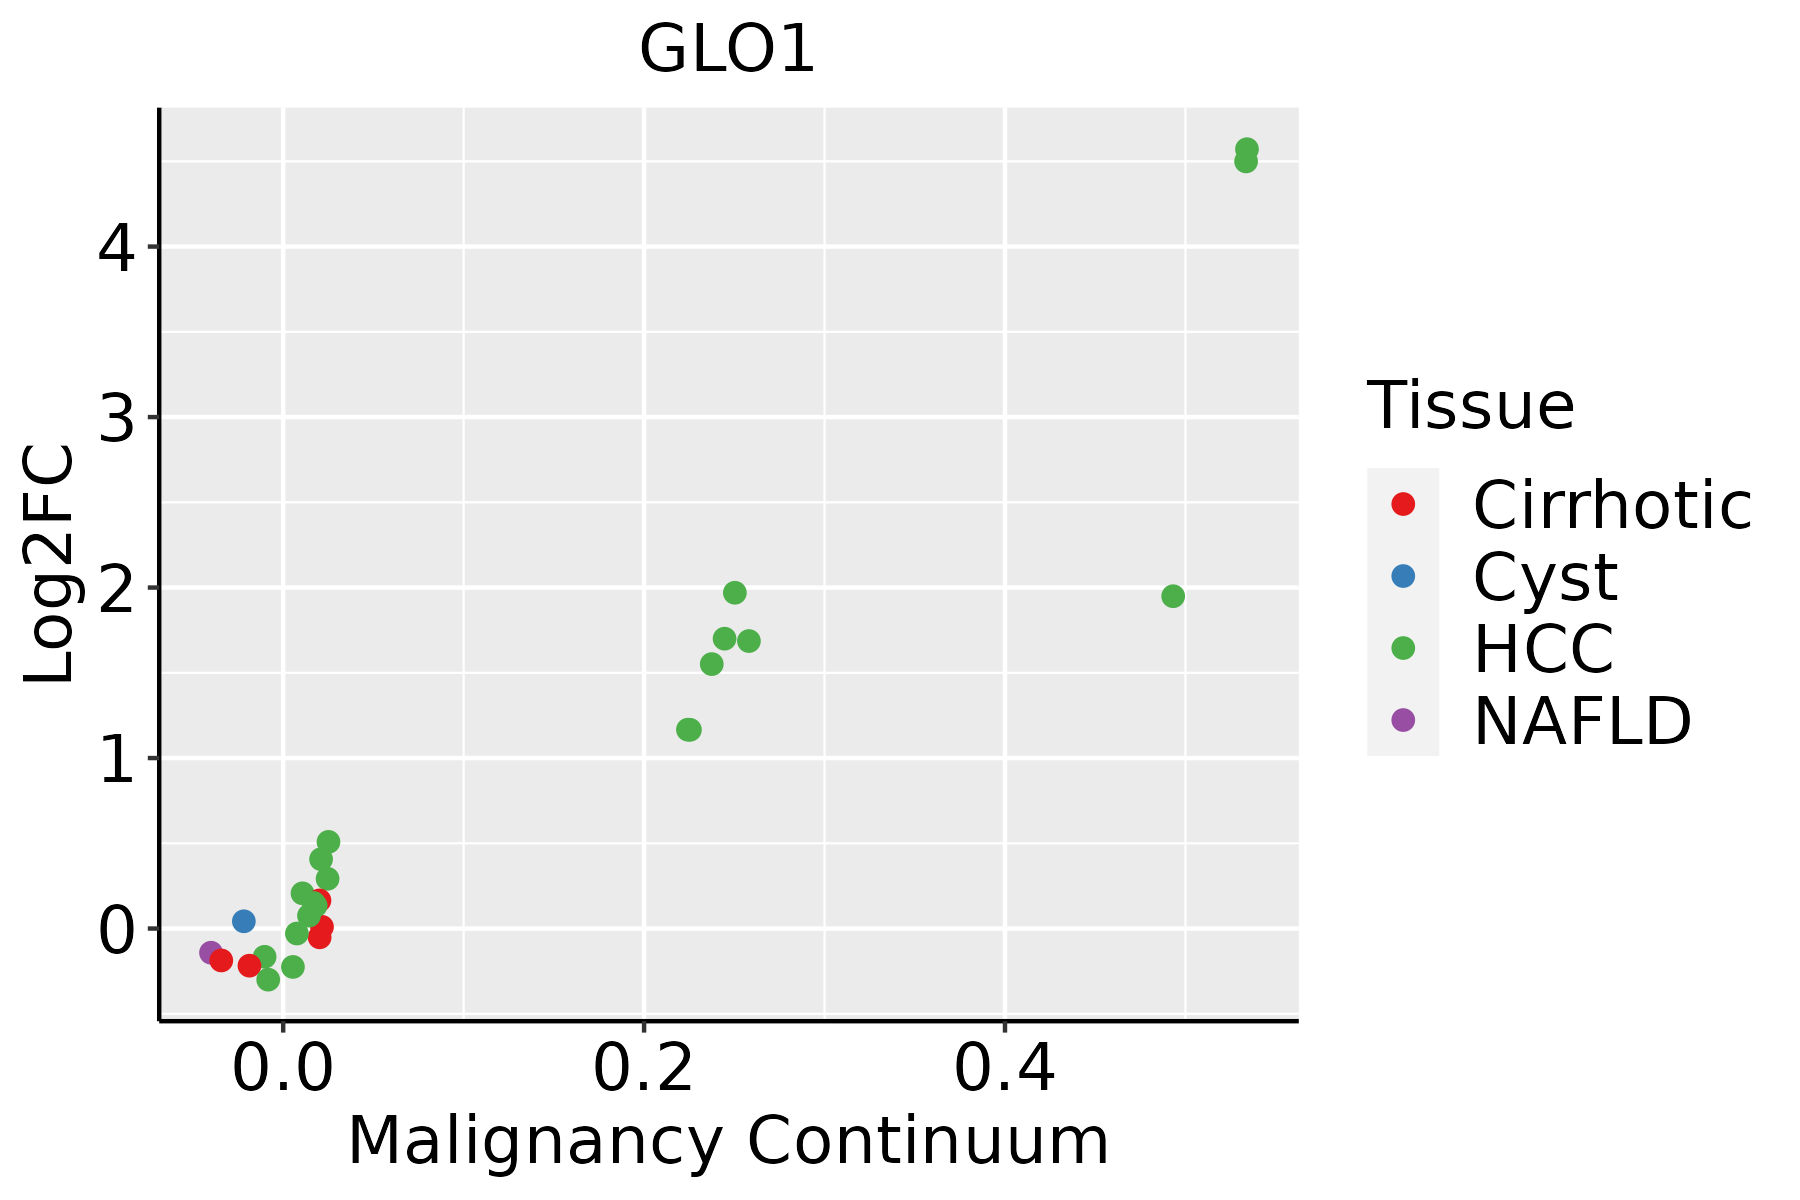 | HCC: Hepatocellular carcinoma |
| NAFLD: Non-alcoholic fatty liver disease | ||
| Oral Cavity |  | EOLP: Erosive Oral lichen planus |
| LP: leukoplakia | ||
| NEOLP: Non-erosive oral lichen planus | ||
| OSCC: Oral squamous cell carcinoma | ||
| Prostate | 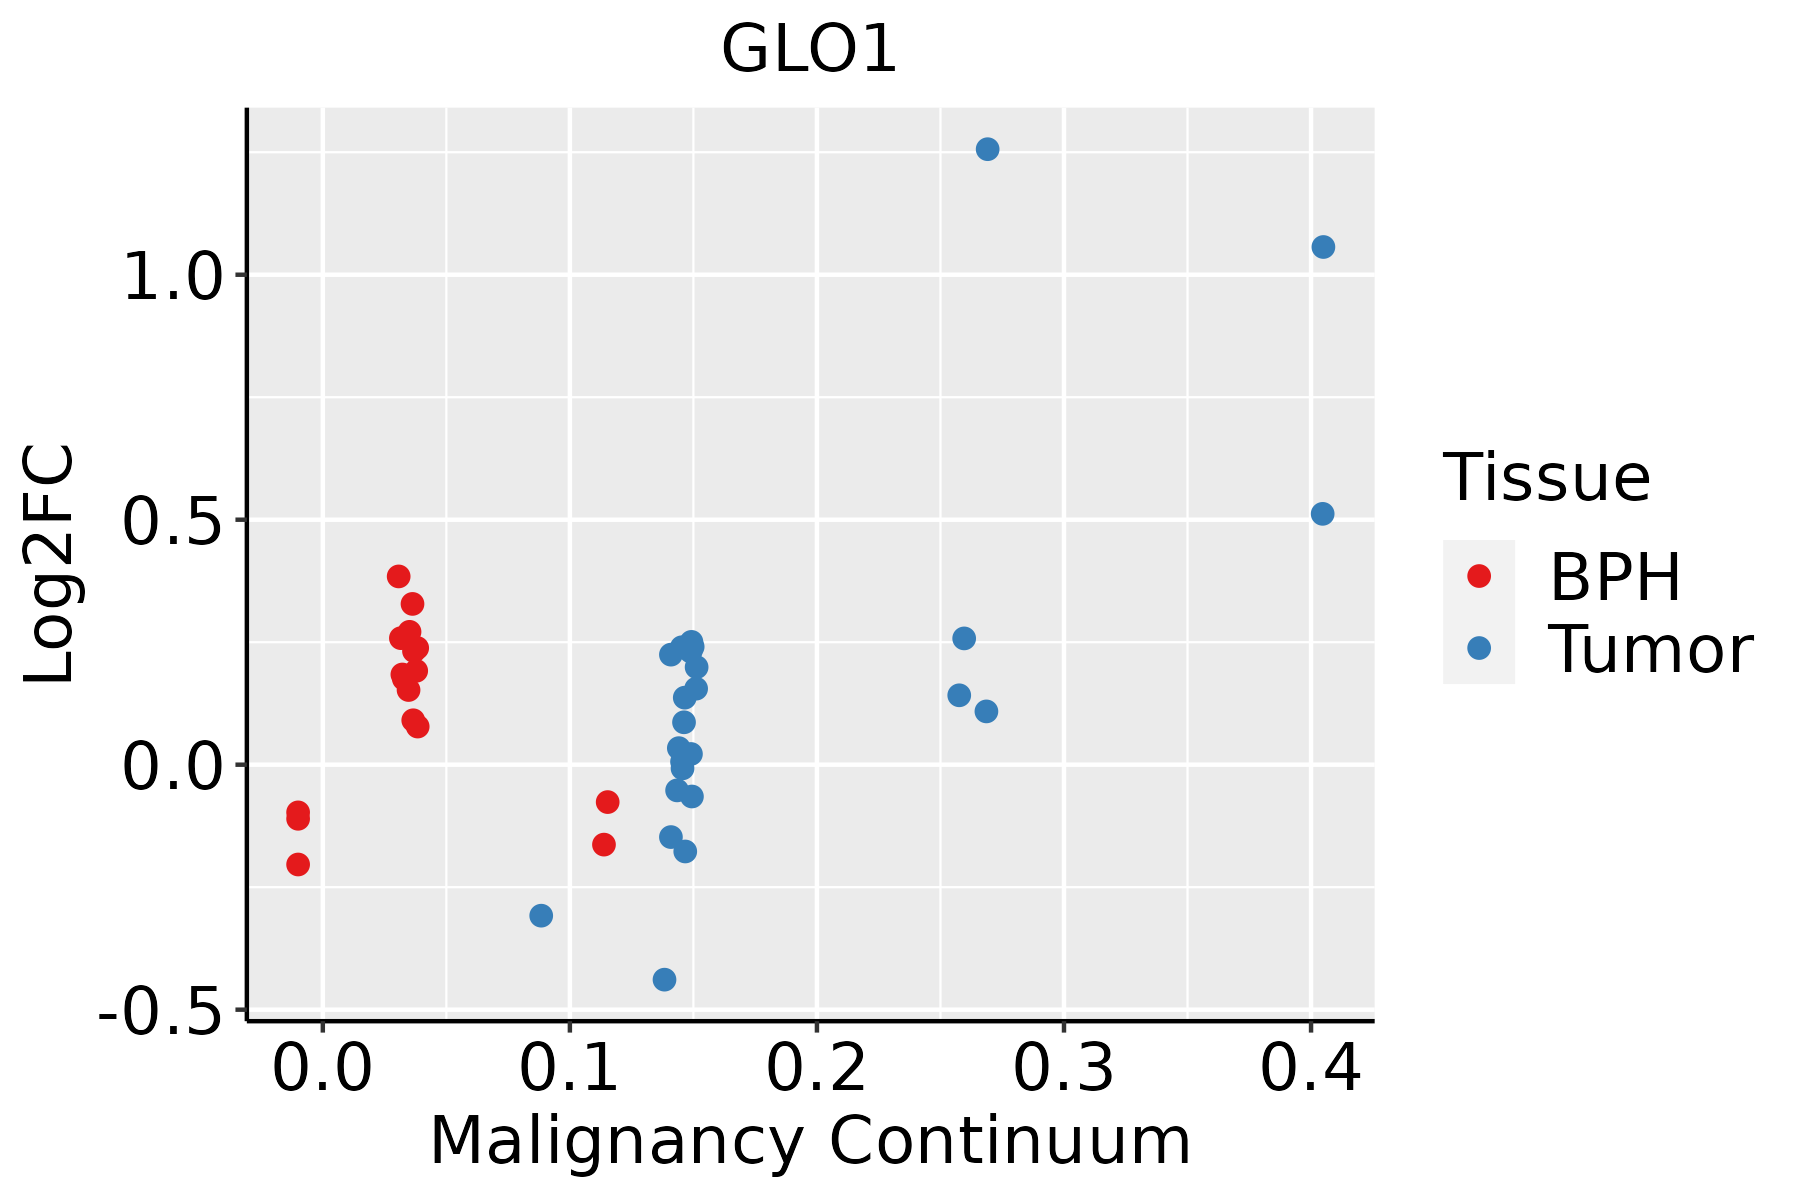 | BPH: Benign Prostatic Hyperplasia |
| Skin |  | AK: Actinic keratosis |
| cSCC: Cutaneous squamous cell carcinoma | ||
| SCCIS:squamous cell carcinoma in situ | ||
| Thyroid |  | ATC: Anaplastic thyroid cancer |
| HT: Hashimoto's thyroiditis | ||
| PTC: Papillary thyroid cancer |
| ∗log2FC in expression of this searched gene in stem-like cells from each diseased tissue sample relative to stem-like cells in normal samples in each tissue plotted against the malignancy continuum. Samples are colored based on if they are from different disease stage. |
Top |
Malignant transformation related pathway analysis |
| Find out the enriched GO biological processes and KEGG pathways involved in transition from healthy to precancer to cancer |
| Tissue | Disease Stage | Enriched GO biological Processes |
| Colorectum | AD |  |
| Colorectum | SER |  |
| Colorectum | MSS |  |
| Colorectum | MSI-H |  |
| Colorectum | FAP |  |
| ∗Top 15 enriched GO BP terms are showed in the bar plot of each disease state in each tissue. Each row represents a significant GO biological process which is colored according to the -log10(p.adjust). |
| Page: 1 2 3 4 5 6 7 8 9 |
| GO ID | Tissue | Disease Stage | Description | Gene Ratio | Bg Ratio | pvalue | p.adjust | Count |
| GO:0030099 | Colorectum | AD | myeloid cell differentiation | 119/3918 | 381/18723 | 1.24e-06 | 4.01e-05 | 119 |
| GO:0006790 | Colorectum | AD | sulfur compound metabolic process | 101/3918 | 339/18723 | 6.46e-05 | 1.07e-03 | 101 |
| GO:0006575 | Colorectum | AD | cellular modified amino acid metabolic process | 59/3918 | 188/18723 | 4.80e-04 | 5.27e-03 | 59 |
| GO:0006081 | Colorectum | AD | cellular aldehyde metabolic process | 22/3918 | 60/18723 | 3.64e-03 | 2.60e-02 | 22 |
| GO:0002573 | Colorectum | AD | myeloid leukocyte differentiation | 60/3918 | 208/18723 | 4.03e-03 | 2.81e-02 | 60 |
| GO:00067901 | Colorectum | SER | sulfur compound metabolic process | 73/2897 | 339/18723 | 1.75e-03 | 1.81e-02 | 73 |
| GO:00300991 | Colorectum | SER | myeloid cell differentiation | 80/2897 | 381/18723 | 2.28e-03 | 2.18e-02 | 80 |
| GO:00300992 | Colorectum | MSS | myeloid cell differentiation | 110/3467 | 381/18723 | 4.48e-07 | 1.75e-05 | 110 |
| GO:00065751 | Colorectum | MSS | cellular modified amino acid metabolic process | 55/3467 | 188/18723 | 2.16e-04 | 3.01e-03 | 55 |
| GO:00025731 | Colorectum | MSS | myeloid leukocyte differentiation | 57/3467 | 208/18723 | 1.01e-03 | 1.01e-02 | 57 |
| GO:00067902 | Colorectum | MSS | sulfur compound metabolic process | 85/3467 | 339/18723 | 1.52e-03 | 1.39e-02 | 85 |
| GO:00060811 | Colorectum | MSS | cellular aldehyde metabolic process | 21/3467 | 60/18723 | 1.81e-03 | 1.60e-02 | 21 |
| GO:00300993 | Colorectum | MSI-H | myeloid cell differentiation | 50/1319 | 381/18723 | 1.52e-05 | 6.62e-04 | 50 |
| GO:00060812 | Colorectum | MSI-H | cellular aldehyde metabolic process | 13/1319 | 60/18723 | 2.27e-04 | 5.94e-03 | 13 |
| GO:00065752 | Colorectum | MSI-H | cellular modified amino acid metabolic process | 25/1319 | 188/18723 | 1.61e-03 | 2.39e-02 | 25 |
| GO:00025732 | Colorectum | MSI-H | myeloid leukocyte differentiation | 26/1319 | 208/18723 | 3.15e-03 | 3.91e-02 | 26 |
| GO:00300994 | Colorectum | FAP | myeloid cell differentiation | 81/2622 | 381/18723 | 6.33e-05 | 1.22e-03 | 81 |
| GO:003009927 | Esophagus | HGIN | myeloid cell differentiation | 83/2587 | 381/18723 | 1.26e-05 | 3.52e-04 | 83 |
| GO:00067497 | Esophagus | HGIN | glutathione metabolic process | 20/2587 | 64/18723 | 2.63e-04 | 4.58e-03 | 20 |
| GO:000257316 | Esophagus | HGIN | myeloid leukocyte differentiation | 45/2587 | 208/18723 | 1.31e-03 | 1.56e-02 | 45 |
| Page: 1 2 3 4 |
| Pathway ID | Tissue | Disease Stage | Description | Gene Ratio | Bg Ratio | pvalue | p.adjust | qvalue | Count |
| hsa00620 | Colorectum | AD | Pyruvate metabolism | 28/2092 | 47/8465 | 3.71e-07 | 5.41e-06 | 3.45e-06 | 28 |
| hsa006201 | Colorectum | AD | Pyruvate metabolism | 28/2092 | 47/8465 | 3.71e-07 | 5.41e-06 | 3.45e-06 | 28 |
| hsa006204 | Colorectum | MSS | Pyruvate metabolism | 24/1875 | 47/8465 | 1.25e-05 | 1.35e-04 | 8.27e-05 | 24 |
| hsa006205 | Colorectum | MSS | Pyruvate metabolism | 24/1875 | 47/8465 | 1.25e-05 | 1.35e-04 | 8.27e-05 | 24 |
| hsa006206 | Colorectum | FAP | Pyruvate metabolism | 17/1404 | 47/8465 | 9.18e-04 | 5.20e-03 | 3.16e-03 | 17 |
| hsa006207 | Colorectum | FAP | Pyruvate metabolism | 17/1404 | 47/8465 | 9.18e-04 | 5.20e-03 | 3.16e-03 | 17 |
| hsa0062010 | Esophagus | HGIN | Pyruvate metabolism | 16/1383 | 47/8465 | 2.27e-03 | 1.95e-02 | 1.55e-02 | 16 |
| hsa0062013 | Esophagus | HGIN | Pyruvate metabolism | 16/1383 | 47/8465 | 2.27e-03 | 1.95e-02 | 1.55e-02 | 16 |
| hsa0062023 | Esophagus | ESCC | Pyruvate metabolism | 32/4205 | 47/8465 | 8.11e-03 | 1.94e-02 | 9.94e-03 | 32 |
| hsa0062033 | Esophagus | ESCC | Pyruvate metabolism | 32/4205 | 47/8465 | 8.11e-03 | 1.94e-02 | 9.94e-03 | 32 |
| hsa006208 | Liver | Cirrhotic | Pyruvate metabolism | 29/2530 | 47/8465 | 5.90e-06 | 5.95e-05 | 3.67e-05 | 29 |
| hsa0062011 | Liver | Cirrhotic | Pyruvate metabolism | 29/2530 | 47/8465 | 5.90e-06 | 5.95e-05 | 3.67e-05 | 29 |
| hsa0062021 | Liver | HCC | Pyruvate metabolism | 37/4020 | 47/8465 | 1.10e-05 | 8.03e-05 | 4.46e-05 | 37 |
| hsa0062031 | Liver | HCC | Pyruvate metabolism | 37/4020 | 47/8465 | 1.10e-05 | 8.03e-05 | 4.46e-05 | 37 |
| hsa006209 | Oral cavity | OSCC | Pyruvate metabolism | 31/3704 | 47/8465 | 1.74e-03 | 4.73e-03 | 2.41e-03 | 31 |
| hsa0062012 | Oral cavity | OSCC | Pyruvate metabolism | 31/3704 | 47/8465 | 1.74e-03 | 4.73e-03 | 2.41e-03 | 31 |
| hsa0062022 | Oral cavity | LP | Pyruvate metabolism | 22/2418 | 47/8465 | 5.88e-03 | 2.31e-02 | 1.49e-02 | 22 |
| hsa0062032 | Oral cavity | LP | Pyruvate metabolism | 22/2418 | 47/8465 | 5.88e-03 | 2.31e-02 | 1.49e-02 | 22 |
| Page: 1 |
Top |
Cell-cell communication analysis |
| Identification of potential cell-cell interactions between two cell types and their ligand-receptor pairs for different disease states |
| Ligand | Receptor | LRpair | Pathway | Tissue | Disease Stage |
| Page: 1 |
Top |
Single-cell gene regulatory network inference analysis |
| Find out the significant the regulons (TFs) and the target genes of each regulon across cell types for different disease states |
| TF | Cell Type | Tissue | Disease Stage | Target Gene | RSS | Regulon Activity |
| ∗The dot plots of a searched regulon are shown for all cell subpopulations in each disease state of each tissue based on the regulon specific score inferred using pySCENIC and by calculating the average expression. |
| Page: 1 |
Top |
Somatic mutation of malignant transformation related genes |
| Annotation of somatic variants for genes involved in malignant transformation |
| Hugo Symbol | Variant Class | Variant Classification | dbSNP RS | HGVSc | HGVSp | HGVSp Short | SWISSPROT | BIOTYPE | SIFT | PolyPhen | Tumor Sample Barcode | Tissue | Histology | Sex | Age | Stage | Therapy Types | Drugs | Outcome |
| GLO1 | SNV | Missense_Mutation | novel | c.503A>G | p.Asp168Gly | p.D168G | Q04760 | protein_coding | deleterious(0) | probably_damaging(1) | TCGA-VS-A9U6-01 | Cervix | cervical & endocervical cancer | Female | <65 | I/II | Chemotherapy | cisplatin | PD |
| GLO1 | SNV | Missense_Mutation | c.108N>A | p.Met36Ile | p.M36I | Q04760 | protein_coding | deleterious(0) | probably_damaging(1) | TCGA-A6-2686-01 | Colorectum | colon adenocarcinoma | Female | >=65 | I/II | Unknown | Unknown | SD | |
| GLO1 | SNV | Missense_Mutation | c.286N>G | p.Lys96Glu | p.K96E | Q04760 | protein_coding | tolerated(0.46) | benign(0.055) | TCGA-CK-4951-01 | Colorectum | colon adenocarcinoma | Female | >=65 | I/II | Unknown | Unknown | PD | |
| GLO1 | SNV | Missense_Mutation | novel | c.180N>C | p.Lys60Asn | p.K60N | Q04760 | protein_coding | deleterious(0) | probably_damaging(0.991) | TCGA-EF-5831-01 | Colorectum | rectum adenocarcinoma | Male | >=65 | I/II | Unknown | Unknown | SD |
| GLO1 | SNV | Missense_Mutation | novel | c.256G>T | p.Asp86Tyr | p.D86Y | Q04760 | protein_coding | deleterious(0.04) | benign(0.013) | TCGA-AP-A1DV-01 | Endometrium | uterine corpus endometrioid carcinoma | Female | <65 | I/II | Unknown | Unknown | SD |
| GLO1 | SNV | Missense_Mutation | novel | c.232N>C | p.Lys78Gln | p.K78Q | Q04760 | protein_coding | tolerated(0.45) | benign(0.014) | TCGA-BK-A6W3-01 | Endometrium | uterine corpus endometrioid carcinoma | Female | <65 | I/II | Unknown | Unknown | SD |
| GLO1 | SNV | Missense_Mutation | novel | c.157N>A | p.Leu53Ile | p.L53I | Q04760 | protein_coding | deleterious(0.02) | possibly_damaging(0.725) | TCGA-EY-A1G8-01 | Endometrium | uterine corpus endometrioid carcinoma | Female | >=65 | I/II | Unknown | Unknown | SD |
| GLO1 | SNV | Missense_Mutation | novel | c.177A>C | p.Gln59His | p.Q59H | Q04760 | protein_coding | tolerated(0.13) | benign(0.047) | TCGA-QS-A5YQ-01 | Endometrium | uterine corpus endometrioid carcinoma | Female | <65 | III/IV | Chemotherapy | cisplatin | CR |
| GLO1 | SNV | Missense_Mutation | c.47N>T | p.Ala16Val | p.A16V | Q04760 | protein_coding | tolerated(0.36) | benign(0.013) | TCGA-BC-A10R-01 | Liver | liver hepatocellular carcinoma | Female | >=65 | III/IV | Other, specify in noteschemoembolization | unknown | PD | |
| GLO1 | SNV | Missense_Mutation | rs11544279 | c.245N>A | p.Pro82His | p.P82H | Q04760 | protein_coding | deleterious(0) | probably_damaging(0.995) | TCGA-78-8655-01 | Lung | lung adenocarcinoma | Female | >=65 | I/II | Unknown | Unknown | SD |
| Page: 1 2 |
Top |
Related drugs of malignant transformation related genes |
| Identification of chemicals and drugs interact with genes involved in malignant transfromation |
| (DGIdb 4.0) |
| Entrez ID | Symbol | Category | Interaction Types | Drug Claim Name | Drug Name | PMIDs |
| 2739 | GLO1 | ENZYME, DRUGGABLE GENOME | 2-(4-METHOXYBENZAMIDO)BENZOIC ACID | CHEMBL1701911 | 21669529 | |
| 2739 | GLO1 | ENZYME, DRUGGABLE GENOME | N-METHYLFORMAMIDE | 3480403 | ||
| 2739 | GLO1 | ENZYME, DRUGGABLE GENOME | NARINGENIN | NARINGENIN |
| Page: 1 |

Copyright 2023-Present -The University of Texas Health Science Center at Houston |