
|
|||||
|
 | |
| |
| |
| |
| |
| |
|
Gene: GLMP |
Gene summary for GLMP |
| Gene information | Species | Human | Gene symbol | GLMP | Gene ID | 112770 |
| Gene name | glycosylated lysosomal membrane protein | |
| Gene Alias | C1orf85 | |
| Cytomap | 1q22 | |
| Gene Type | protein-coding | GO ID | GO:0006139 | UniProtAcc | A0A087WV34 |
Top |
Malignant transformation analysis |
| Identification of the aberrant gene expression in precancerous and cancerous lesions by comparing the gene expression of stem-like cells in diseased tissues with normal stem cells |
| Entrez ID | Symbol | Replicates | Species | Organ | Tissue | Adj P-value | Log2FC | Malignancy |
| 112770 | GLMP | LZE4T | Human | Esophagus | ESCC | 5.95e-08 | 1.20e-01 | 0.0811 |
| 112770 | GLMP | LZE7T | Human | Esophagus | ESCC | 2.22e-10 | 4.70e-01 | 0.0667 |
| 112770 | GLMP | LZE8T | Human | Esophagus | ESCC | 3.77e-05 | 4.51e-02 | 0.067 |
| 112770 | GLMP | LZE20T | Human | Esophagus | ESCC | 1.42e-03 | 1.18e-01 | 0.0662 |
| 112770 | GLMP | LZE22D1 | Human | Esophagus | HGIN | 1.86e-02 | 5.98e-02 | 0.0595 |
| 112770 | GLMP | LZE22T | Human | Esophagus | ESCC | 9.13e-08 | 3.68e-01 | 0.068 |
| 112770 | GLMP | LZE24T | Human | Esophagus | ESCC | 2.02e-24 | 5.77e-01 | 0.0596 |
| 112770 | GLMP | LZE6T | Human | Esophagus | ESCC | 1.73e-06 | 3.02e-01 | 0.0845 |
| 112770 | GLMP | P1T-E | Human | Esophagus | ESCC | 3.90e-10 | 6.92e-01 | 0.0875 |
| 112770 | GLMP | P2T-E | Human | Esophagus | ESCC | 9.74e-27 | 6.44e-01 | 0.1177 |
| 112770 | GLMP | P4T-E | Human | Esophagus | ESCC | 3.51e-33 | 6.85e-01 | 0.1323 |
| 112770 | GLMP | P5T-E | Human | Esophagus | ESCC | 6.82e-19 | 4.78e-01 | 0.1327 |
| 112770 | GLMP | P8T-E | Human | Esophagus | ESCC | 3.75e-18 | 4.51e-01 | 0.0889 |
| 112770 | GLMP | P9T-E | Human | Esophagus | ESCC | 5.97e-32 | 7.03e-01 | 0.1131 |
| 112770 | GLMP | P10T-E | Human | Esophagus | ESCC | 2.16e-13 | 3.12e-01 | 0.116 |
| 112770 | GLMP | P11T-E | Human | Esophagus | ESCC | 1.16e-26 | 9.45e-01 | 0.1426 |
| 112770 | GLMP | P12T-E | Human | Esophagus | ESCC | 5.97e-15 | 2.80e-01 | 0.1122 |
| 112770 | GLMP | P15T-E | Human | Esophagus | ESCC | 1.11e-38 | 8.29e-01 | 0.1149 |
| 112770 | GLMP | P16T-E | Human | Esophagus | ESCC | 7.97e-29 | 4.45e-01 | 0.1153 |
| 112770 | GLMP | P17T-E | Human | Esophagus | ESCC | 6.21e-21 | 6.15e-01 | 0.1278 |
| Page: 1 2 3 4 5 |
| Tissue | Expression Dynamics | Abbreviation |
| Esophagus | 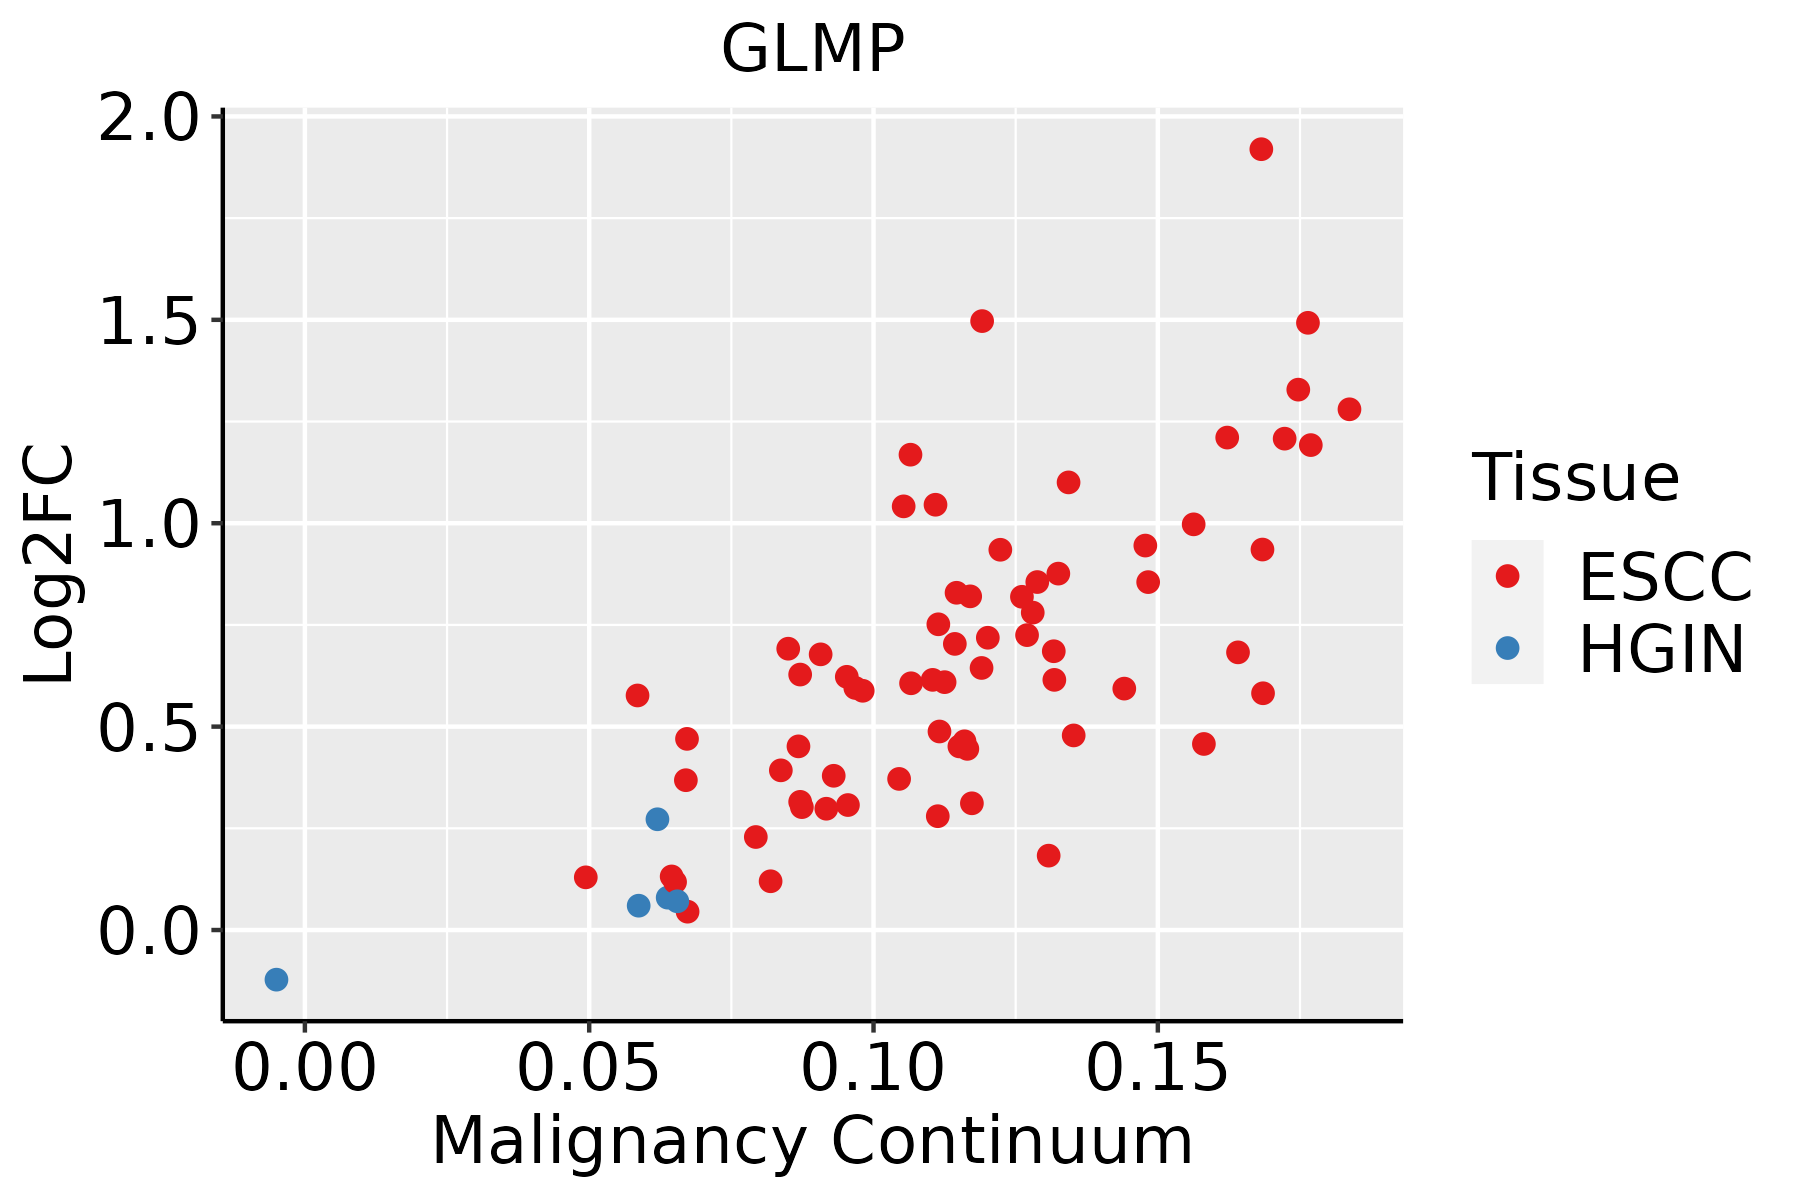 | ESCC: Esophageal squamous cell carcinoma |
| HGIN: High-grade intraepithelial neoplasias | ||
| LGIN: Low-grade intraepithelial neoplasias | ||
| Liver | 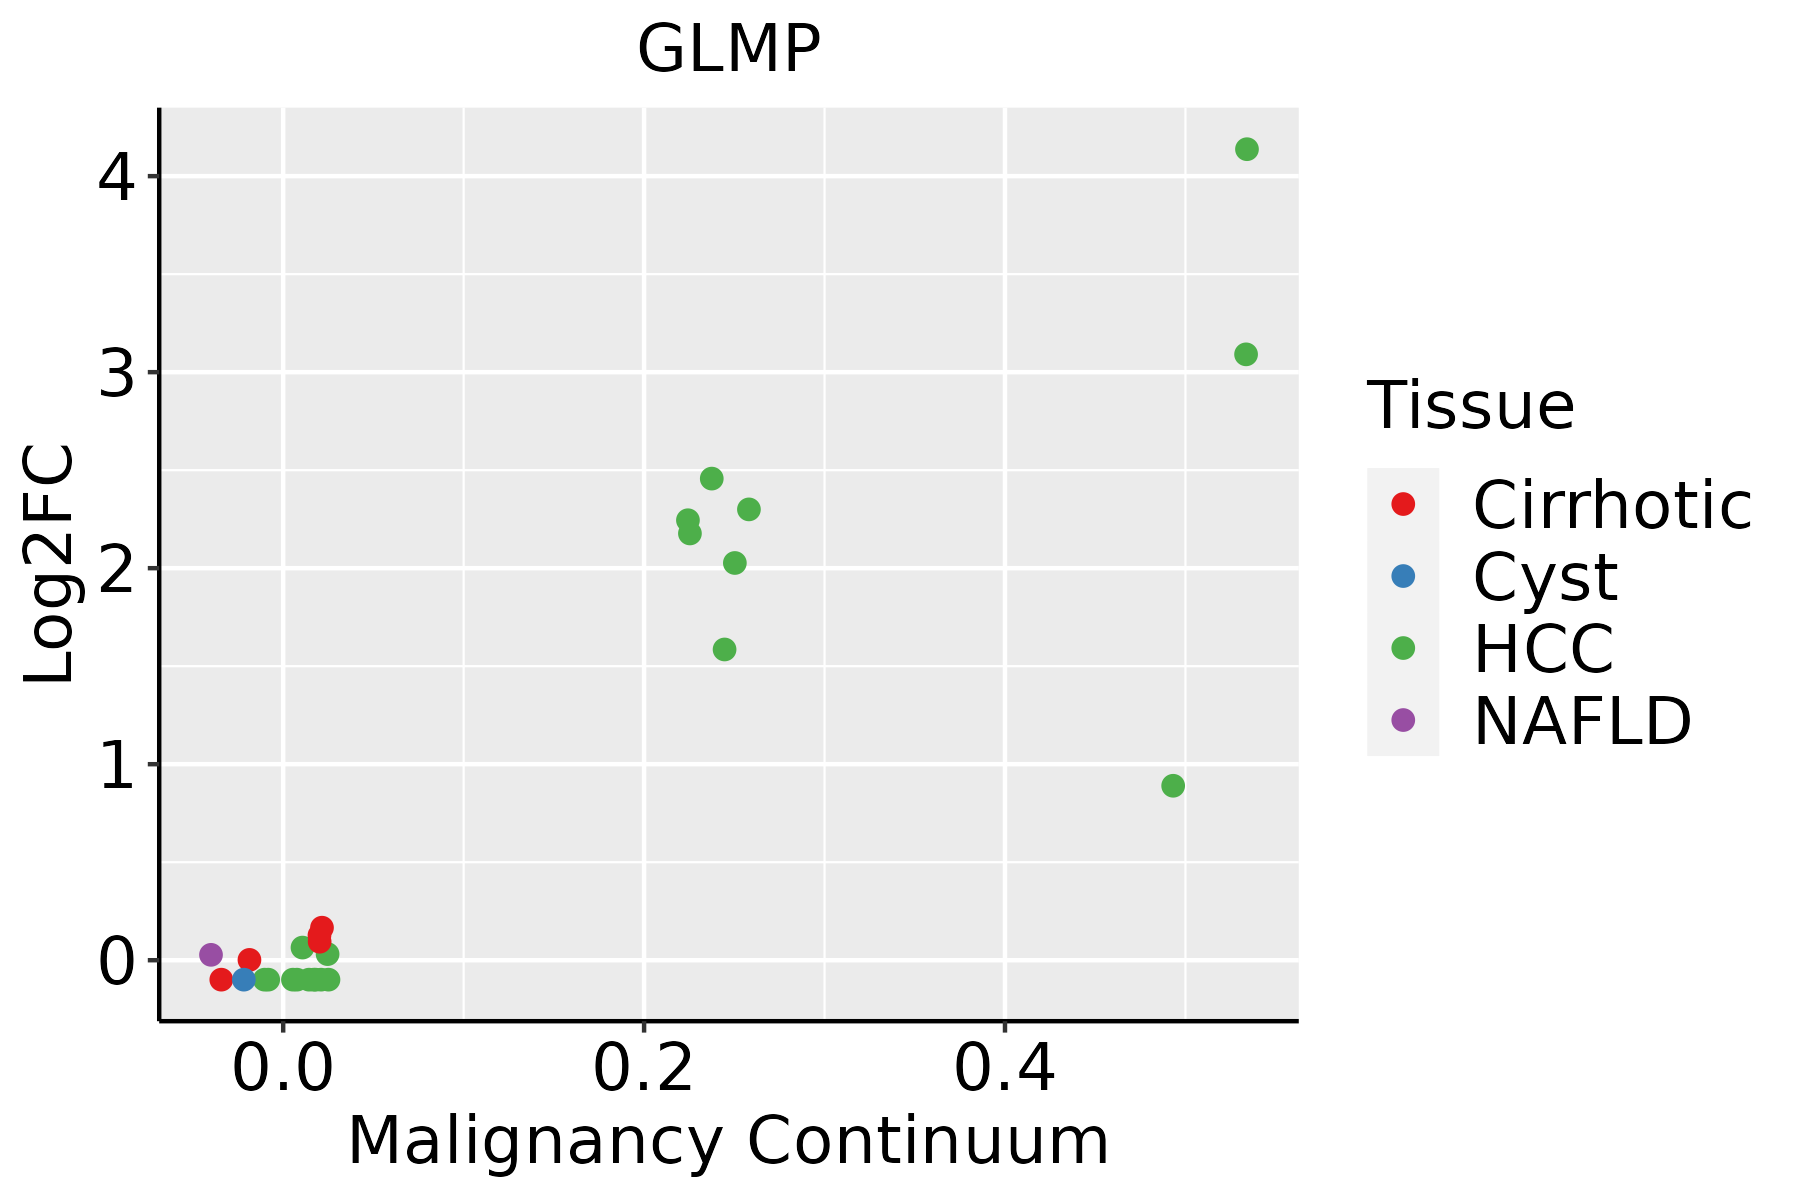 | HCC: Hepatocellular carcinoma |
| NAFLD: Non-alcoholic fatty liver disease | ||
| Oral Cavity | 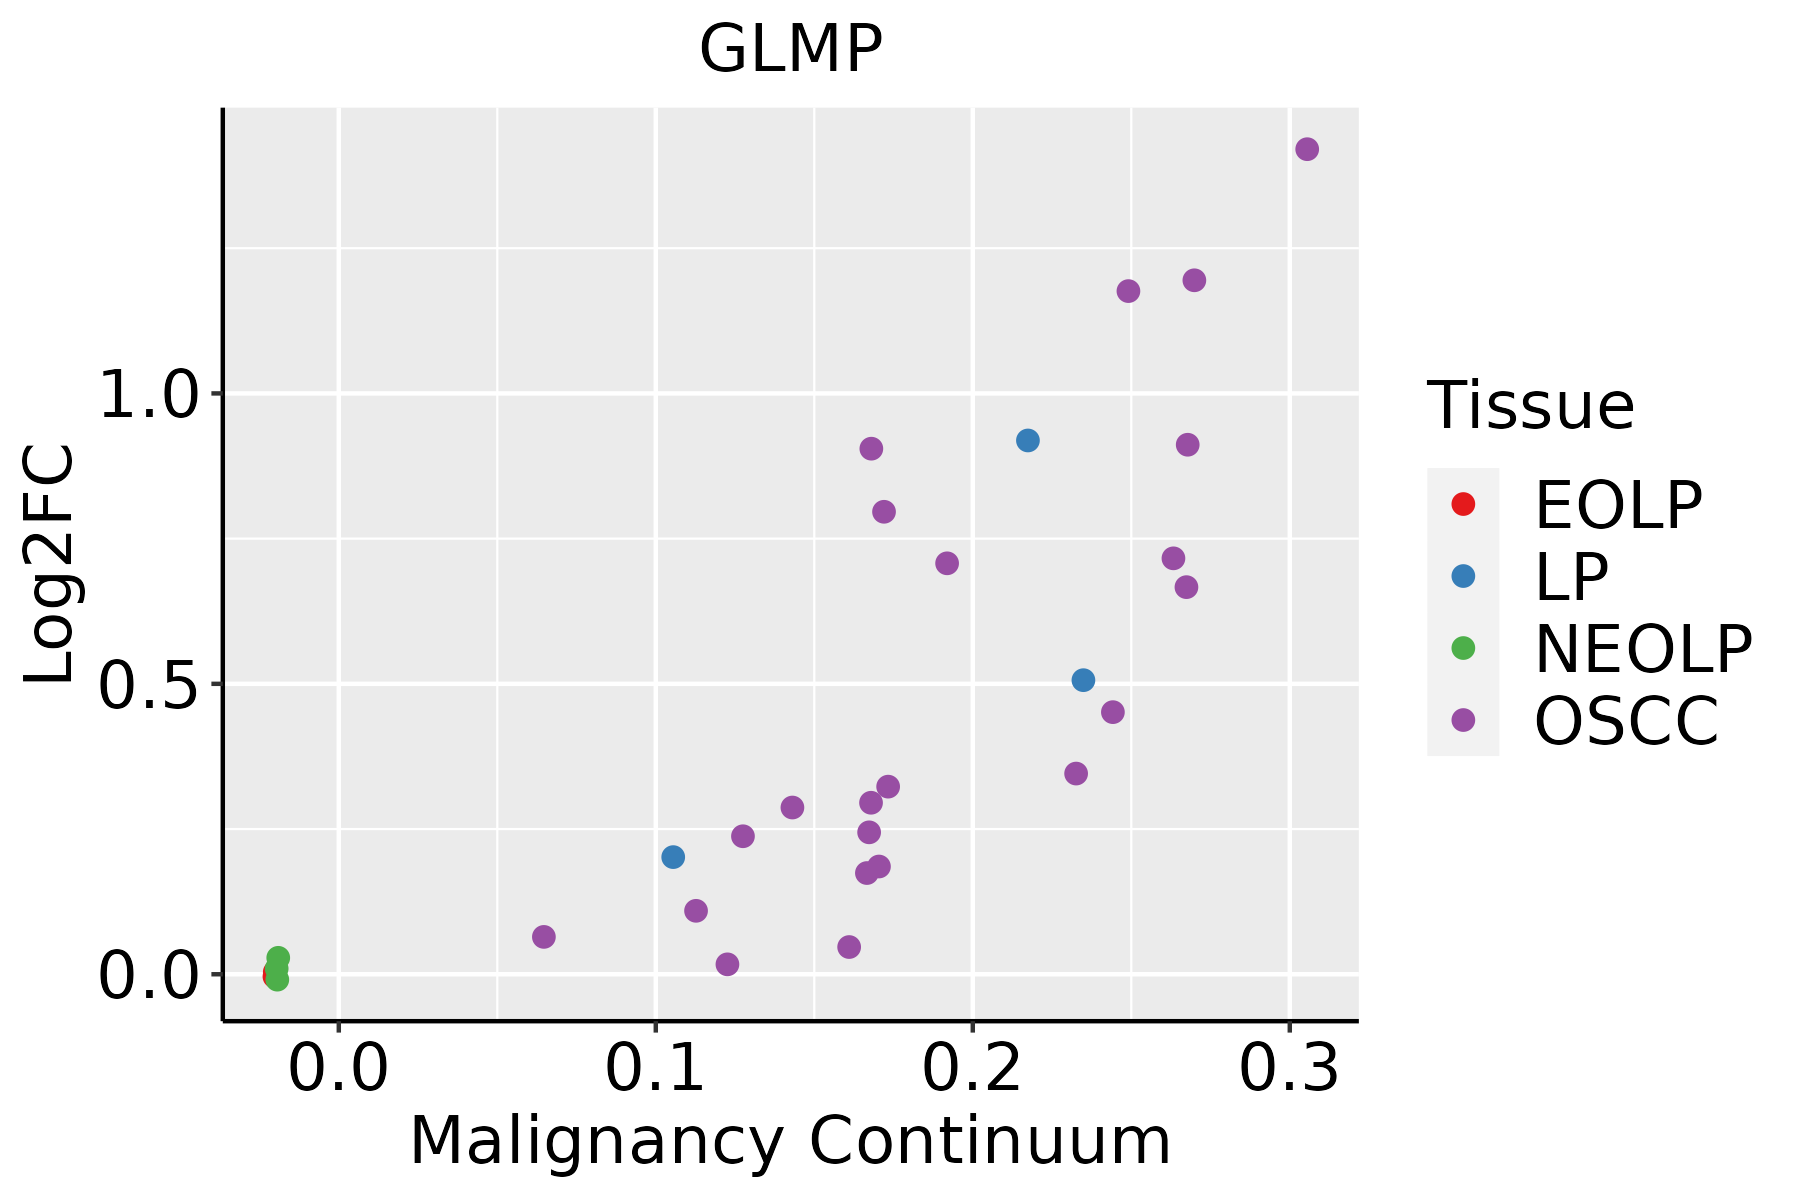 | EOLP: Erosive Oral lichen planus |
| LP: leukoplakia | ||
| NEOLP: Non-erosive oral lichen planus | ||
| OSCC: Oral squamous cell carcinoma | ||
| Prostate | 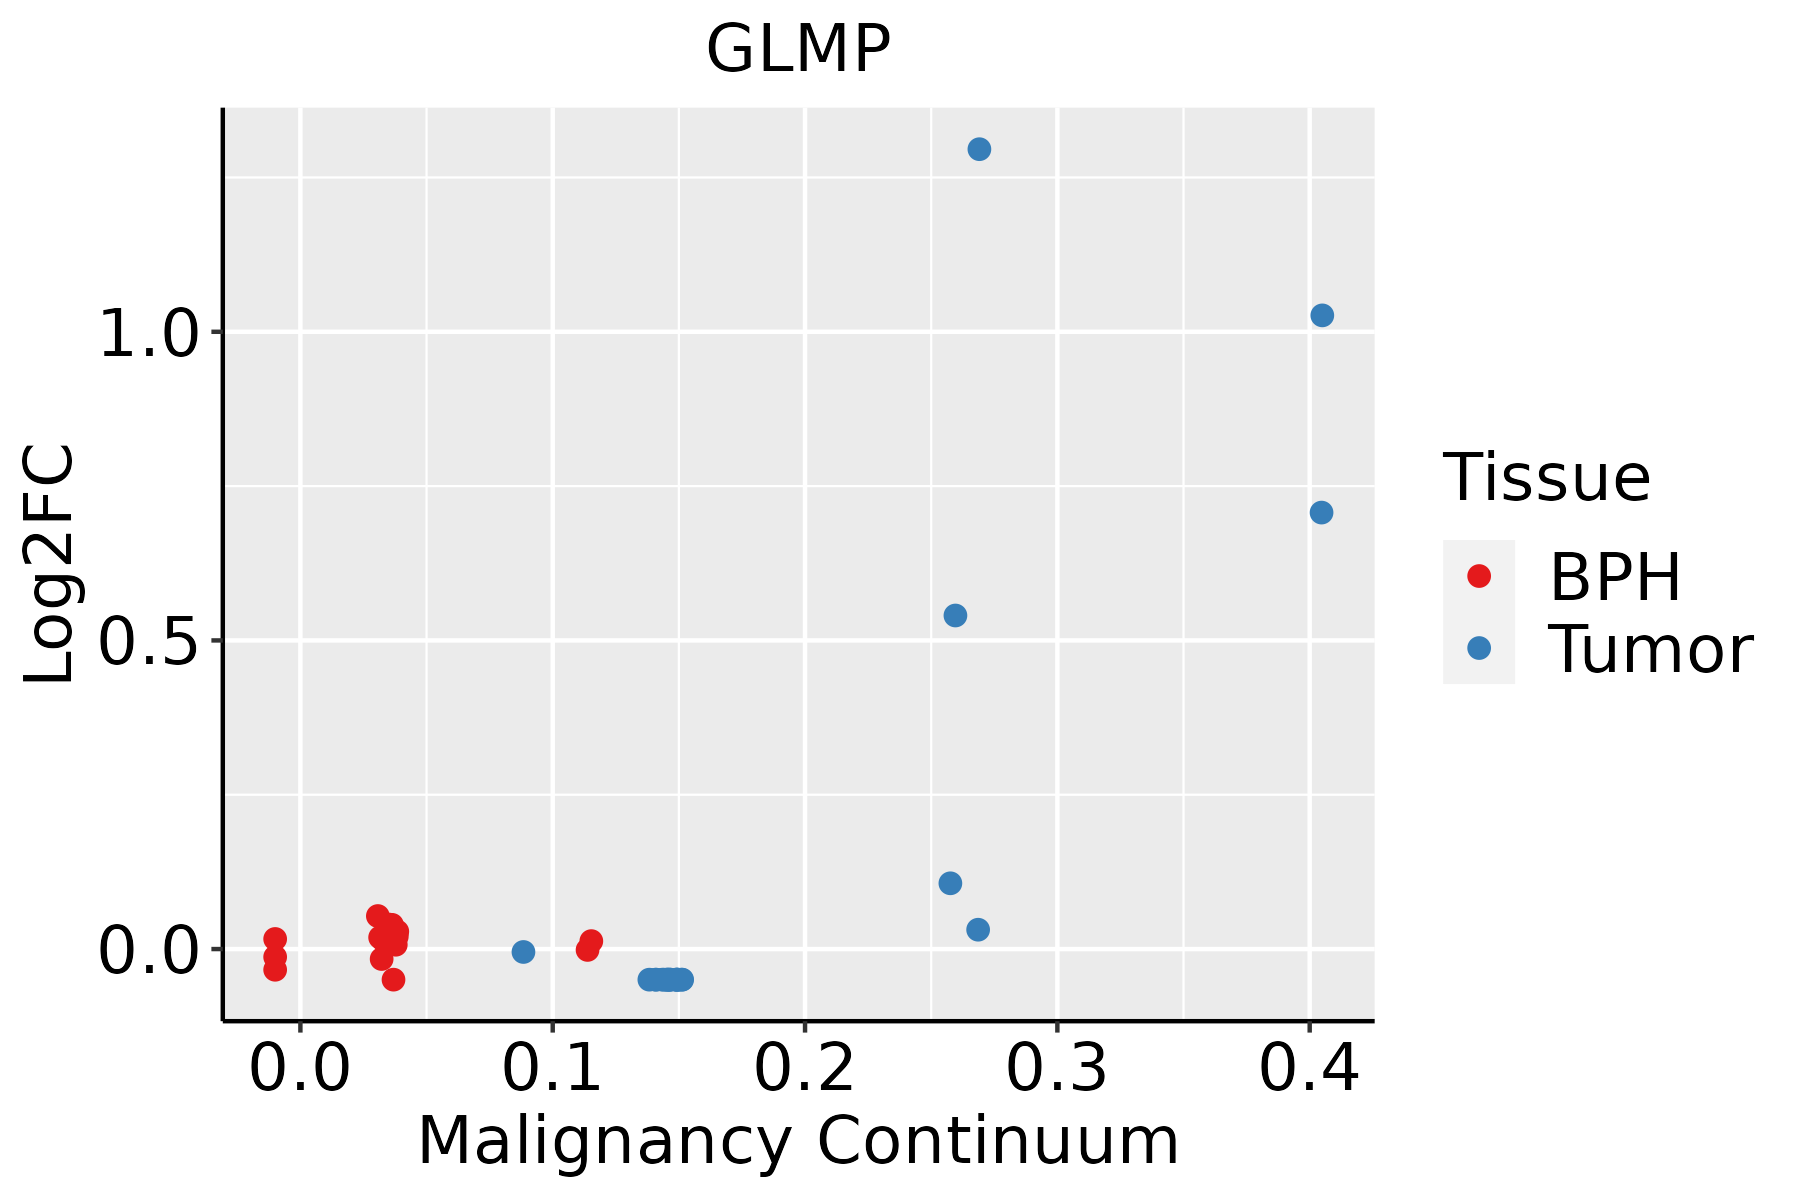 | BPH: Benign Prostatic Hyperplasia |
| ∗log2FC in expression of this searched gene in stem-like cells from each diseased tissue sample relative to stem-like cells in normal samples in each tissue plotted against the malignancy continuum. Samples are colored based on if they are from different disease stage. |
Top |
Malignant transformation related pathway analysis |
| Find out the enriched GO biological processes and KEGG pathways involved in transition from healthy to precancer to cancer |
| Tissue | Disease Stage | Enriched GO biological Processes |
| Colorectum | AD |  |
| Colorectum | SER |  |
| Colorectum | MSS |  |
| Colorectum | MSI-H |  |
| Colorectum | FAP |  |
| ∗Top 15 enriched GO BP terms are showed in the bar plot of each disease state in each tissue. Each row represents a significant GO biological process which is colored according to the -log10(p.adjust). |
| Page: 1 2 3 4 5 6 7 8 9 |
| GO ID | Tissue | Disease Stage | Description | Gene Ratio | Bg Ratio | pvalue | p.adjust | Count |
| GO:003164727 | Esophagus | HGIN | regulation of protein stability | 96/2587 | 298/18723 | 2.21e-16 | 5.76e-14 | 96 |
| GO:005082127 | Esophagus | HGIN | protein stabilization | 64/2587 | 191/18723 | 3.11e-12 | 4.24e-10 | 64 |
| GO:0031647111 | Esophagus | ESCC | regulation of protein stability | 223/8552 | 298/18723 | 5.76e-25 | 1.52e-22 | 223 |
| GO:0050821111 | Esophagus | ESCC | protein stabilization | 140/8552 | 191/18723 | 6.50e-15 | 3.61e-13 | 140 |
| GO:00726659 | Esophagus | ESCC | protein localization to vacuole | 52/8552 | 67/18723 | 9.14e-08 | 1.52e-06 | 52 |
| GO:00614626 | Esophagus | ESCC | protein localization to lysosome | 34/8552 | 46/18723 | 9.39e-05 | 6.70e-04 | 34 |
| GO:003164712 | Liver | Cirrhotic | regulation of protein stability | 144/4634 | 298/18723 | 6.74e-19 | 1.28e-16 | 144 |
| GO:005082112 | Liver | Cirrhotic | protein stabilization | 97/4634 | 191/18723 | 6.67e-15 | 6.97e-13 | 97 |
| GO:007266511 | Liver | Cirrhotic | protein localization to vacuole | 37/4634 | 67/18723 | 9.11e-08 | 2.66e-06 | 37 |
| GO:00614622 | Liver | Cirrhotic | protein localization to lysosome | 24/4634 | 46/18723 | 5.75e-05 | 6.58e-04 | 24 |
| GO:003164722 | Liver | HCC | regulation of protein stability | 211/7958 | 298/18723 | 2.29e-23 | 5.01e-21 | 211 |
| GO:005082122 | Liver | HCC | protein stabilization | 139/7958 | 191/18723 | 1.61e-17 | 1.71e-15 | 139 |
| GO:007266521 | Liver | HCC | protein localization to vacuole | 48/7958 | 67/18723 | 1.27e-06 | 1.85e-05 | 48 |
| GO:00614621 | Liver | HCC | protein localization to lysosome | 33/7958 | 46/18723 | 5.63e-05 | 5.26e-04 | 33 |
| GO:003164720 | Oral cavity | OSCC | regulation of protein stability | 193/7305 | 298/18723 | 1.30e-19 | 1.95e-17 | 193 |
| GO:005082120 | Oral cavity | OSCC | protein stabilization | 122/7305 | 191/18723 | 2.69e-12 | 1.09e-10 | 122 |
| GO:00726658 | Oral cavity | OSCC | protein localization to vacuole | 44/7305 | 67/18723 | 8.92e-06 | 9.44e-05 | 44 |
| GO:00614625 | Oral cavity | OSCC | protein localization to lysosome | 28/7305 | 46/18723 | 2.19e-03 | 9.95e-03 | 28 |
| GO:0031647110 | Oral cavity | LP | regulation of protein stability | 132/4623 | 298/18723 | 8.16e-14 | 7.99e-12 | 132 |
| GO:0050821110 | Oral cavity | LP | protein stabilization | 88/4623 | 191/18723 | 9.15e-11 | 5.51e-09 | 88 |
| Page: 1 2 |
| Pathway ID | Tissue | Disease Stage | Description | Gene Ratio | Bg Ratio | pvalue | p.adjust | qvalue | Count |
| Page: 1 |
Top |
Cell-cell communication analysis |
| Identification of potential cell-cell interactions between two cell types and their ligand-receptor pairs for different disease states |
| Ligand | Receptor | LRpair | Pathway | Tissue | Disease Stage |
| Page: 1 |
Top |
Single-cell gene regulatory network inference analysis |
| Find out the significant the regulons (TFs) and the target genes of each regulon across cell types for different disease states |
| TF | Cell Type | Tissue | Disease Stage | Target Gene | RSS | Regulon Activity |
| ∗The dot plots of a searched regulon are shown for all cell subpopulations in each disease state of each tissue based on the regulon specific score inferred using pySCENIC and by calculating the average expression. |
| Page: 1 |
Top |
Somatic mutation of malignant transformation related genes |
| Annotation of somatic variants for genes involved in malignant transformation |
| Hugo Symbol | Variant Class | Variant Classification | dbSNP RS | HGVSc | HGVSp | HGVSp Short | SWISSPROT | BIOTYPE | SIFT | PolyPhen | Tumor Sample Barcode | Tissue | Histology | Sex | Age | Stage | Therapy Types | Drugs | Outcome |
| GLMP | SNV | Missense_Mutation | c.856N>A | p.Ala286Thr | p.A286T | Q8WWB7 | protein_coding | deleterious(0) | probably_damaging(0.974) | TCGA-A7-A26I-01 | Breast | breast invasive carcinoma | Female | >=65 | I/II | Chemotherapy | cytoxan | SD | |
| GLMP | SNV | Missense_Mutation | c.1009G>A | p.Gly337Arg | p.G337R | Q8WWB7 | protein_coding | deleterious(0) | probably_damaging(1) | TCGA-A8-A07O-01 | Breast | breast invasive carcinoma | Female | <65 | I/II | Chemotherapy | CR | ||
| GLMP | SNV | Missense_Mutation | c.1191N>T | p.Lys397Asn | p.K397N | Q8WWB7 | protein_coding | deleterious(0.04) | benign(0.429) | TCGA-AN-A0XW-01 | Breast | breast invasive carcinoma | Female | <65 | III/IV | Unknown | Unknown | SD | |
| GLMP | insertion | In_Frame_Ins | novel | c.863_864insTATGTT | p.Ser288_Gln289insMetPhe | p.S288_Q289insMF | Q8WWB7 | protein_coding | TCGA-AO-A03T-01 | Breast | breast invasive carcinoma | Female | <65 | I/II | Chemotherapy | cyclophosphamide | SD | ||
| GLMP | insertion | Frame_Shift_Ins | novel | c.862_863insTTTCGATTTATTTTTATTTTTTTAGAGACATGGTCTTG | p.Ser288PhefsTer35 | p.S288Ffs*35 | Q8WWB7 | protein_coding | TCGA-AO-A03T-01 | Breast | breast invasive carcinoma | Female | <65 | I/II | Chemotherapy | cyclophosphamide | SD | ||
| GLMP | insertion | Nonsense_Mutation | novel | c.741_742insACCACAAGAAGTACTCAGAGTACCAGTCCATAAATTAAGG | p.Pro248ThrfsTer11 | p.P248Tfs*11 | Q8WWB7 | protein_coding | TCGA-BH-A0B1-01 | Breast | breast invasive carcinoma | Female | >=65 | I/II | Chemotherapy | adriamycin | SD | ||
| GLMP | SNV | Missense_Mutation | c.830N>T | p.Ser277Leu | p.S277L | Q8WWB7 | protein_coding | tolerated(0.26) | benign(0.003) | TCGA-IR-A3LA-01 | Cervix | cervical & endocervical cancer | Female | <65 | I/II | Chemotherapy | cisplatin | CR | |
| GLMP | SNV | Missense_Mutation | rs749570618 | c.1058C>T | p.Ser353Leu | p.S353L | Q8WWB7 | protein_coding | deleterious(0) | probably_damaging(0.947) | TCGA-AZ-4315-01 | Colorectum | colon adenocarcinoma | Male | <65 | I/II | Unknown | Unknown | SD |
| GLMP | SNV | Missense_Mutation | novel | c.1045N>G | p.Tyr349Asp | p.Y349D | Q8WWB7 | protein_coding | deleterious(0) | probably_damaging(0.976) | TCGA-CA-6717-01 | Colorectum | colon adenocarcinoma | Male | <65 | I/II | Chemotherapy | oxaliplatin | CR |
| GLMP | SNV | Missense_Mutation | c.119N>G | p.Gln40Arg | p.Q40R | Q8WWB7 | protein_coding | tolerated(0.1) | benign(0.013) | TCGA-G4-6588-01 | Colorectum | colon adenocarcinoma | Female | <65 | I/II | Unknown | Unknown | SD |
| Page: 1 2 3 4 5 |
Top |
Related drugs of malignant transformation related genes |
| Identification of chemicals and drugs interact with genes involved in malignant transfromation |
| (DGIdb 4.0) |
| Entrez ID | Symbol | Category | Interaction Types | Drug Claim Name | Drug Name | PMIDs |
| Page: 1 |

Copyright 2023-Present -The University of Texas Health Science Center at Houston |