
|
|||||
|
 | |
| |
| |
| |
| |
| |
|
Gene: GLIS3 |
Gene summary for GLIS3 |
| Gene information | Species | Human | Gene symbol | GLIS3 | Gene ID | 169792 |
| Gene name | GLIS family zinc finger 3 | |
| Gene Alias | NDH | |
| Cytomap | 9p24.2 | |
| Gene Type | protein-coding | GO ID | GO:0000122 | UniProtAcc | Q1PHJ8 |
Top |
Malignant transformation analysis |
| Identification of the aberrant gene expression in precancerous and cancerous lesions by comparing the gene expression of stem-like cells in diseased tissues with normal stem cells |
| Entrez ID | Symbol | Replicates | Species | Organ | Tissue | Adj P-value | Log2FC | Malignancy |
| 169792 | GLIS3 | HTA11_3410_2000001011 | Human | Colorectum | AD | 2.24e-30 | -8.62e-01 | 0.0155 |
| 169792 | GLIS3 | HTA11_2487_2000001011 | Human | Colorectum | SER | 5.75e-12 | -7.89e-01 | -0.1808 |
| 169792 | GLIS3 | HTA11_347_2000001011 | Human | Colorectum | AD | 1.08e-05 | -4.66e-01 | -0.1954 |
| 169792 | GLIS3 | HTA11_2112_2000001011 | Human | Colorectum | SER | 4.11e-05 | -9.25e-01 | -0.2196 |
| 169792 | GLIS3 | HTA11_3361_2000001011 | Human | Colorectum | AD | 6.44e-12 | -8.39e-01 | -0.1207 |
| 169792 | GLIS3 | HTA11_696_2000001011 | Human | Colorectum | AD | 7.09e-18 | -6.83e-01 | -0.1464 |
| 169792 | GLIS3 | HTA11_866_2000001011 | Human | Colorectum | AD | 5.71e-05 | -3.99e-01 | -0.1001 |
| 169792 | GLIS3 | HTA11_1391_2000001011 | Human | Colorectum | AD | 2.64e-03 | -4.53e-01 | -0.059 |
| 169792 | GLIS3 | HTA11_5212_2000001011 | Human | Colorectum | AD | 1.81e-08 | -9.99e-01 | -0.2061 |
| 169792 | GLIS3 | HTA11_5216_2000001011 | Human | Colorectum | SER | 2.90e-06 | -9.76e-01 | -0.1462 |
| 169792 | GLIS3 | HTA11_7862_2000001011 | Human | Colorectum | AD | 1.25e-03 | -5.98e-01 | -0.0179 |
| 169792 | GLIS3 | HTA11_866_3004761011 | Human | Colorectum | AD | 7.48e-22 | -7.88e-01 | 0.096 |
| 169792 | GLIS3 | HTA11_4255_2000001011 | Human | Colorectum | SER | 5.97e-08 | -1.10e+00 | 0.0446 |
| 169792 | GLIS3 | HTA11_8622_2000001021 | Human | Colorectum | SER | 3.65e-09 | -1.01e+00 | 0.0528 |
| 169792 | GLIS3 | HTA11_10623_2000001011 | Human | Colorectum | AD | 1.90e-04 | -7.65e-01 | -0.0177 |
| 169792 | GLIS3 | HTA11_10711_2000001011 | Human | Colorectum | AD | 1.53e-03 | -5.51e-01 | 0.0338 |
| 169792 | GLIS3 | HTA11_7696_3000711011 | Human | Colorectum | AD | 1.69e-16 | -5.65e-01 | 0.0674 |
| 169792 | GLIS3 | HTA11_7469_2000001011 | Human | Colorectum | AD | 1.17e-02 | -1.02e+00 | -0.0124 |
| 169792 | GLIS3 | HTA11_6818_2000001021 | Human | Colorectum | AD | 3.66e-02 | -5.11e-01 | 0.0588 |
| 169792 | GLIS3 | HTA11_99999970781_79442 | Human | Colorectum | MSS | 4.40e-59 | -1.11e+00 | 0.294 |
| Page: 1 2 3 4 5 6 7 8 |
| Tissue | Expression Dynamics | Abbreviation |
| Colorectum (GSE201348) |  | FAP: Familial adenomatous polyposis |
| CRC: Colorectal cancer | ||
| Colorectum (HTA11) |  | AD: Adenomas |
| SER: Sessile serrated lesions | ||
| MSI-H: Microsatellite-high colorectal cancer | ||
| MSS: Microsatellite stable colorectal cancer | ||
| Endometrium | 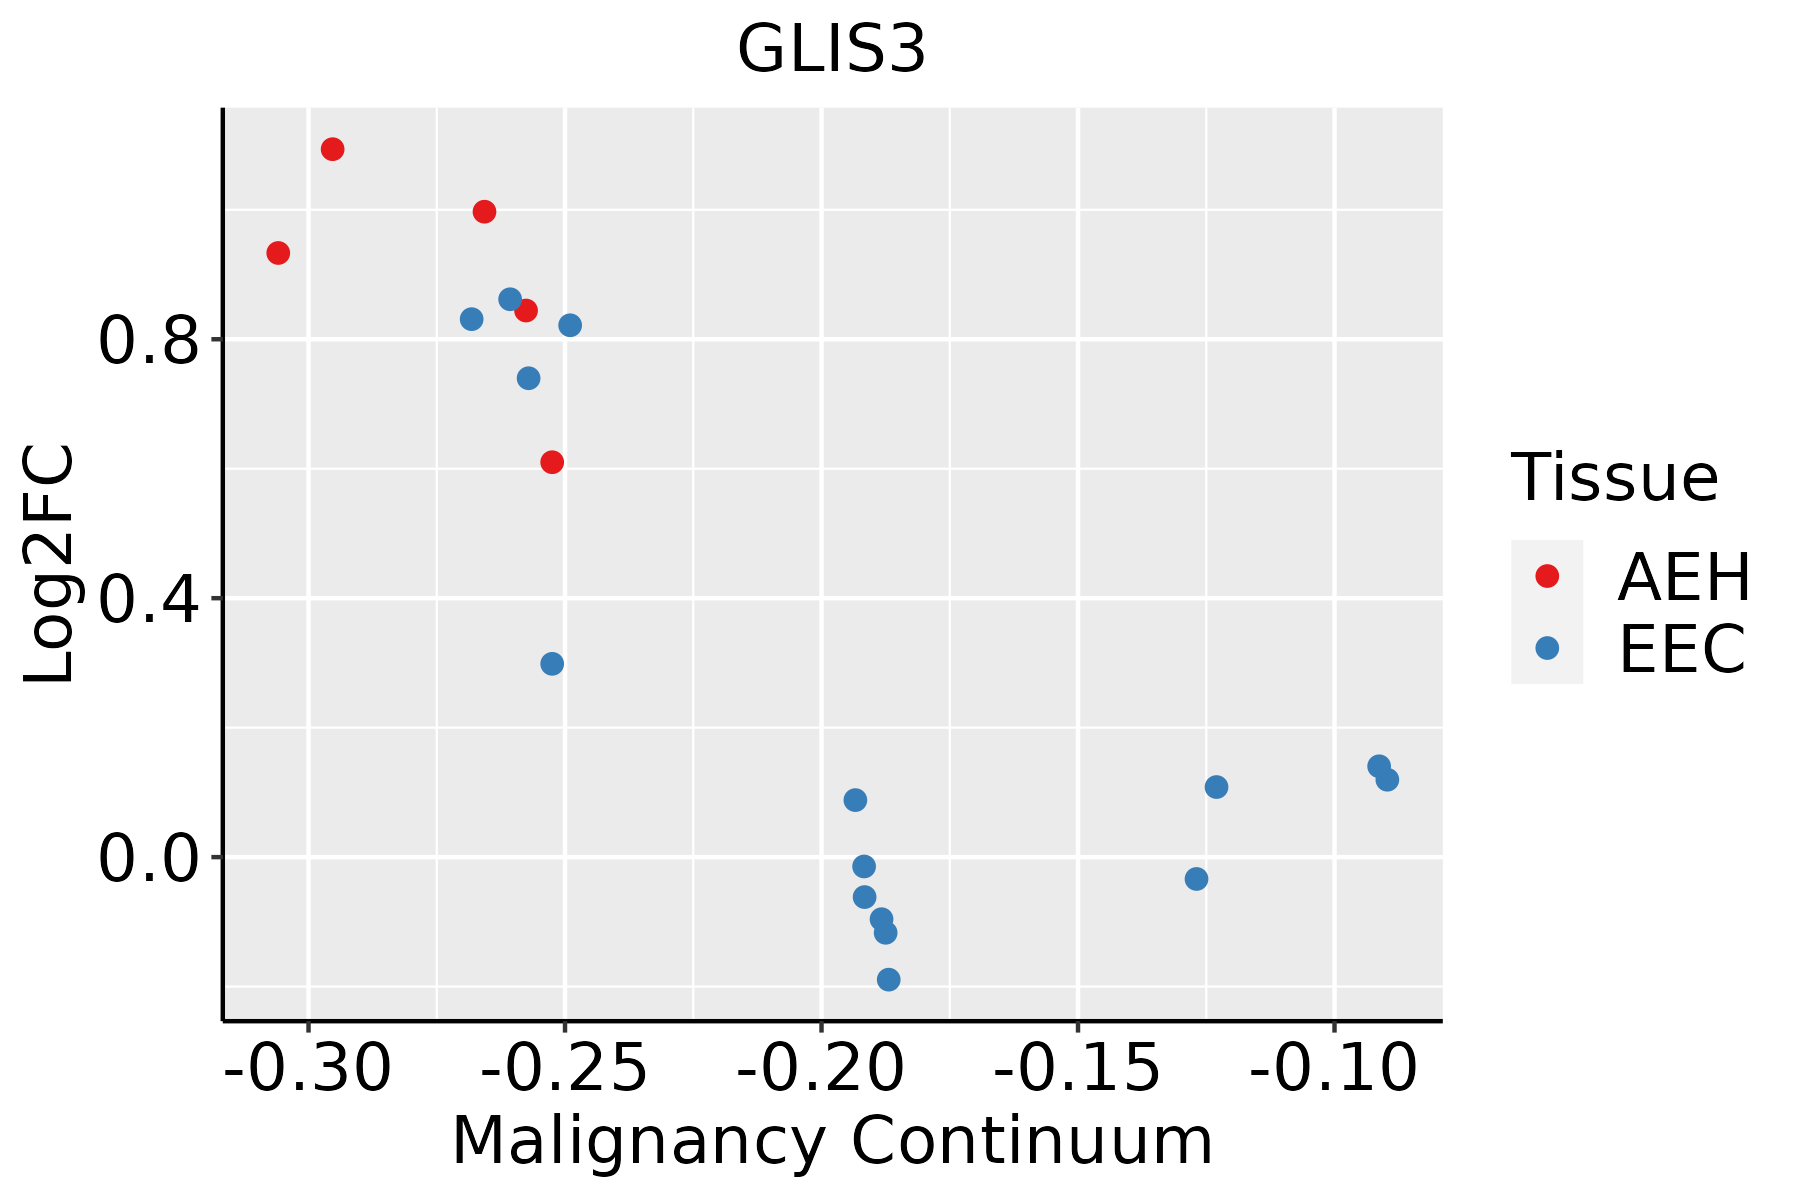 | AEH: Atypical endometrial hyperplasia |
| EEC: Endometrioid Cancer | ||
| Liver |  | HCC: Hepatocellular carcinoma |
| NAFLD: Non-alcoholic fatty liver disease | ||
| Lung |  | AAH: Atypical adenomatous hyperplasia |
| AIS: Adenocarcinoma in situ | ||
| IAC: Invasive lung adenocarcinoma | ||
| MIA: Minimally invasive adenocarcinoma | ||
| Prostate | 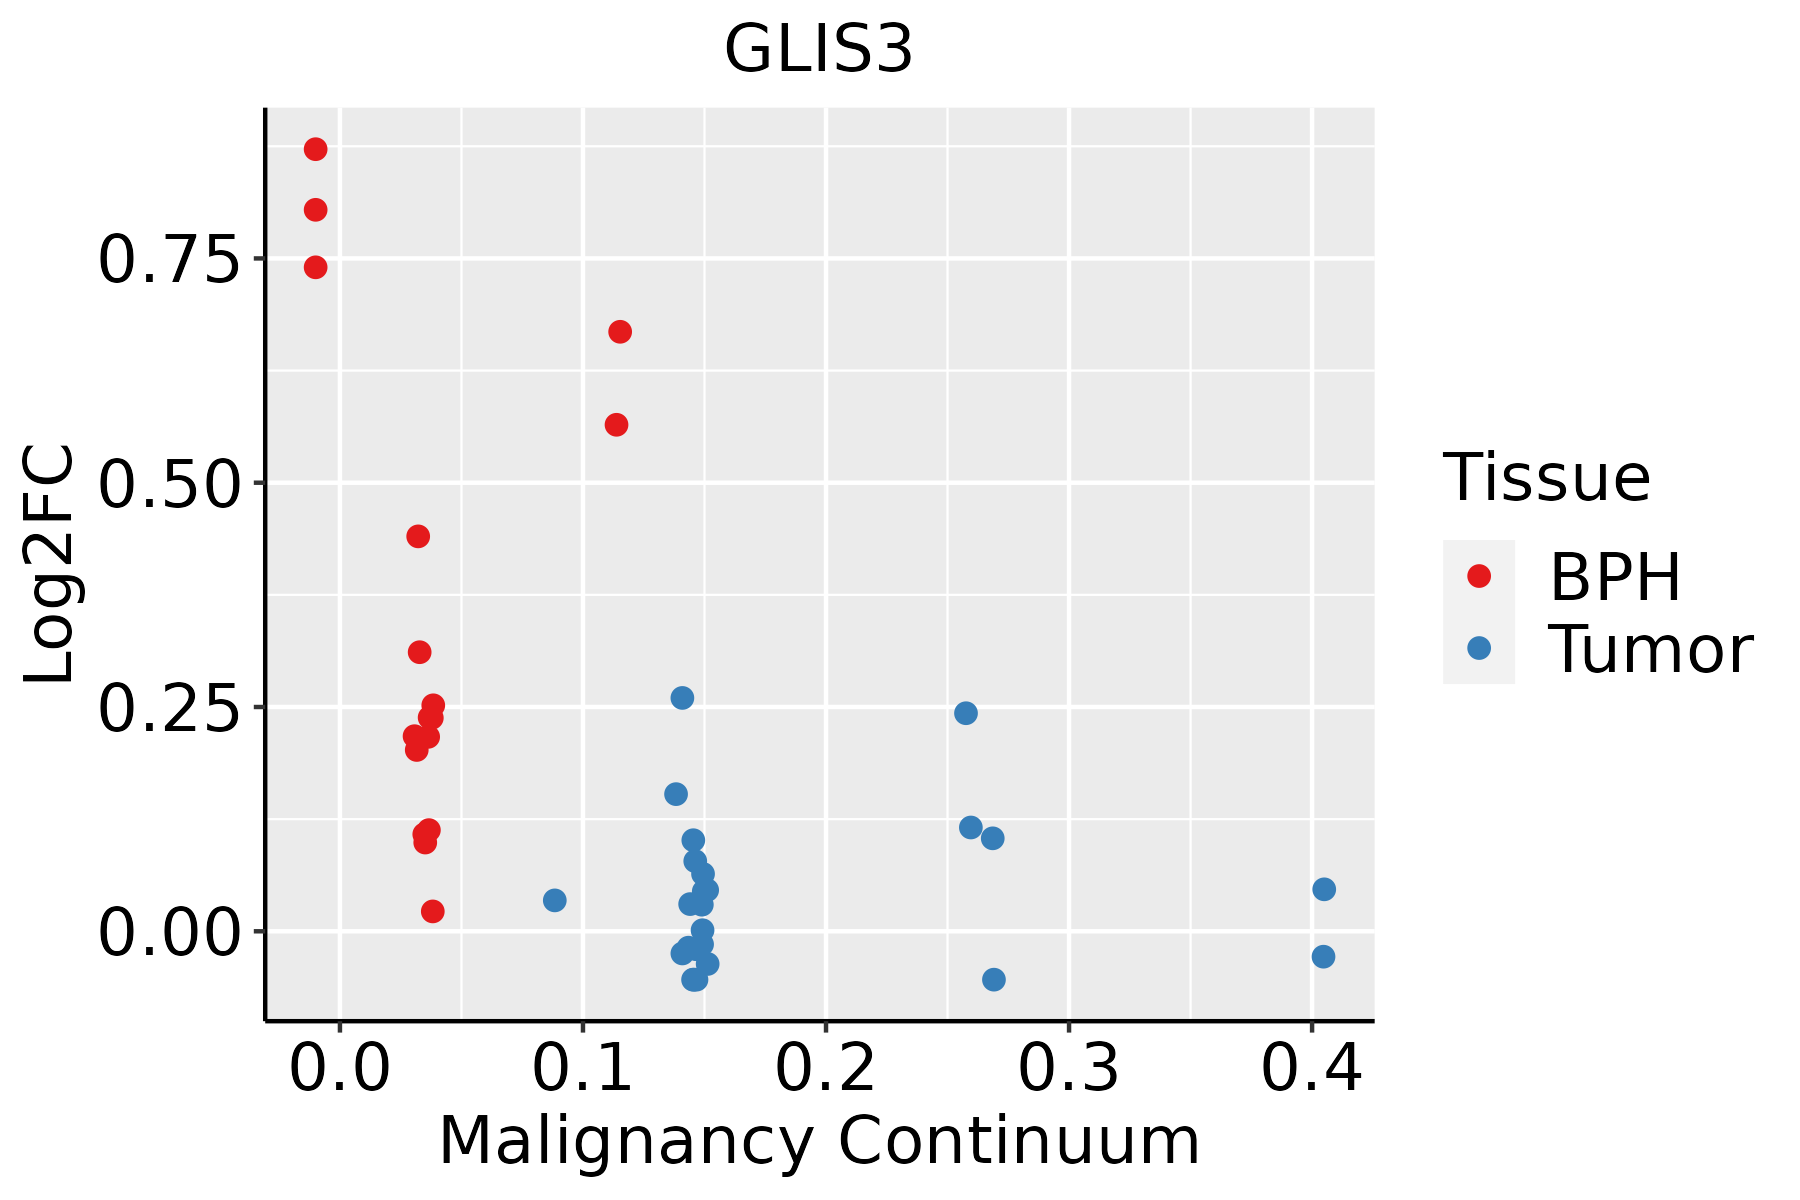 | BPH: Benign Prostatic Hyperplasia |
| Thyroid |  | ATC: Anaplastic thyroid cancer |
| HT: Hashimoto's thyroiditis | ||
| PTC: Papillary thyroid cancer |
| ∗log2FC in expression of this searched gene in stem-like cells from each diseased tissue sample relative to stem-like cells in normal samples in each tissue plotted against the malignancy continuum. Samples are colored based on if they are from different disease stage. |
Top |
Malignant transformation related pathway analysis |
| Find out the enriched GO biological processes and KEGG pathways involved in transition from healthy to precancer to cancer |
| Tissue | Disease Stage | Enriched GO biological Processes |
| Colorectum | AD |  |
| Colorectum | SER |  |
| Colorectum | MSS |  |
| Colorectum | MSI-H |  |
| Colorectum | FAP |  |
| ∗Top 15 enriched GO BP terms are showed in the bar plot of each disease state in each tissue. Each row represents a significant GO biological process which is colored according to the -log10(p.adjust). |
| Page: 1 2 3 4 5 6 7 8 9 |
| GO ID | Tissue | Disease Stage | Description | Gene Ratio | Bg Ratio | pvalue | p.adjust | Count |
| Page: 1 |
| Pathway ID | Tissue | Disease Stage | Description | Gene Ratio | Bg Ratio | pvalue | p.adjust | qvalue | Count |
| Page: 1 |
Top |
Cell-cell communication analysis |
| Identification of potential cell-cell interactions between two cell types and their ligand-receptor pairs for different disease states |
| Ligand | Receptor | LRpair | Pathway | Tissue | Disease Stage |
| Page: 1 |
Top |
Single-cell gene regulatory network inference analysis |
| Find out the significant the regulons (TFs) and the target genes of each regulon across cell types for different disease states |
| TF | Cell Type | Tissue | Disease Stage | Target Gene | RSS | Regulon Activity |
| GLIS3 | COL | Cervix | Healthy | LRFN3,UACA,LINC00493, etc. | 3.11e-01 |  |
| GLIS3 | MAC | Colorectum | CRC | NAV2,CCDC141,MPPED2, etc. | 3.37e-01 |  |
| GLIS3 | cDC | Oral cavity | ADJ | COL1A1,COL1A2,PRRX1, etc. | 4.99e-01 |  |
| GLIS3 | CD8TEFF | Oral cavity | EOLP | COL1A1,COL1A2,PRRX1, etc. | 9.80e-03 |  |
| GLIS3 | cDC | Oral cavity | EOLP | COL1A1,COL1A2,PRRX1, etc. | 7.72e-02 | |
| GLIS3 | MDSCs | Oral cavity | EOLP | COL1A1,COL1A2,PRRX1, etc. | 0.00e+00 | |
| GLIS3 | pDC | Oral cavity | EOLP | COL1A1,COL1A2,PRRX1, etc. | 0.00e+00 | |
| GLIS3 | NK | Oral cavity | EOLP | COL1A1,COL1A2,PRRX1, etc. | 9.74e-03 | |
| GLIS3 | cDC | Oral cavity | Healthy | COL1A1,COL1A2,PRRX1, etc. | 1.80e-01 |  |
| GLIS3 | PLA | Oral cavity | LP | COL1A1,COL1A2,PRRX1, etc. | 6.15e-01 |  |
| ∗The dot plots of a searched regulon are shown for all cell subpopulations in each disease state of each tissue based on the regulon specific score inferred using pySCENIC and by calculating the average expression. |
| Page: 1 2 3 4 |
Top |
Somatic mutation of malignant transformation related genes |
| Annotation of somatic variants for genes involved in malignant transformation |
| Hugo Symbol | Variant Class | Variant Classification | dbSNP RS | HGVSc | HGVSp | HGVSp Short | SWISSPROT | BIOTYPE | SIFT | PolyPhen | Tumor Sample Barcode | Tissue | Histology | Sex | Age | Stage | Therapy Types | Drugs | Outcome |
| GLIS3 | SNV | Missense_Mutation | c.2357C>T | p.Ser786Phe | p.S786F | Q8NEA6 | protein_coding | tolerated(0.08) | possibly_damaging(0.568) | TCGA-A8-A07U-01 | Breast | breast invasive carcinoma | Female | >=65 | III/IV | Chemotherapy | 5-fluorouracil | SD | |
| GLIS3 | SNV | Missense_Mutation | novel | c.1468G>A | p.Asp490Asn | p.D490N | Q8NEA6 | protein_coding | deleterious(0.02) | benign(0.278) | TCGA-A8-A09D-01 | Breast | breast invasive carcinoma | Female | <65 | I/II | Chemotherapy | doxorubicin | CR |
| GLIS3 | SNV | Missense_Mutation | c.79N>T | p.His27Tyr | p.H27Y | Q8NEA6 | protein_coding | deleterious(0.02) | benign(0.167) | TCGA-AR-A0TX-01 | Breast | breast invasive carcinoma | Female | <65 | I/II | Unknown | Unknown | SD | |
| GLIS3 | SNV | Missense_Mutation | c.1841G>A | p.Arg614His | p.R614H | Q8NEA6 | protein_coding | deleterious(0) | probably_damaging(0.984) | TCGA-E2-A1IN-01 | Breast | breast invasive carcinoma | Female | <65 | I/II | Hormone Therapy | arimidex | SD | |
| GLIS3 | SNV | Missense_Mutation | rs760138568 | c.2614G>C | p.Asp872His | p.D872H | Q8NEA6 | protein_coding | tolerated(0.34) | probably_damaging(0.988) | TCGA-S3-AA15-01 | Breast | breast invasive carcinoma | Female | <65 | I/II | Chemotherapy | adriamycin | CR |
| GLIS3 | insertion | Nonsense_Mutation | novel | c.797_798insCATCAGTGAGTAATAGGGGTTGCCAAAAAGGAAAAATAA | p.Ser266_Asn267insIleSerGluTerTerGlyLeuProLysArgLysAsnAsn | p.S266_N267insISE**GLPKRKNN | Q8NEA6 | protein_coding | TCGA-A2-A0EM-01 | Breast | breast invasive carcinoma | Female | >=65 | I/II | Hormone Therapy | tamoxiphen | SD | ||
| GLIS3 | insertion | In_Frame_Ins | novel | c.1632_1633insGGTTATATGAGTGAAAAGAATAATTAC | p.Arg544_Tyr545insGlyTyrMetSerGluLysAsnAsnTyr | p.R544_Y545insGYMSEKNNY | Q8NEA6 | protein_coding | TCGA-A8-A08L-01 | Breast | breast invasive carcinoma | Female | >=65 | III/IV | Unknown | Unknown | SD | ||
| GLIS3 | insertion | Nonsense_Mutation | novel | c.1450_1451insGTTGATGT | p.Gln484ArgfsTer2 | p.Q484Rfs*2 | Q8NEA6 | protein_coding | TCGA-AO-A0JC-01 | Breast | breast invasive carcinoma | Female | <65 | I/II | Chemotherapy | fluorouracil | SD | ||
| GLIS3 | insertion | Nonsense_Mutation | novel | c.1580_1581insAAGGCCTCTGTAGACAGACAGGCAGACCT | p.Asp527GlufsTer5 | p.D527Efs*5 | Q8NEA6 | protein_coding | TCGA-BH-A0HU-01 | Breast | breast invasive carcinoma | Female | <65 | I/II | Chemotherapy | docetaxel | SD | ||
| GLIS3 | SNV | Missense_Mutation | c.1934G>A | p.Arg645Lys | p.R645K | Q8NEA6 | protein_coding | deleterious(0) | possibly_damaging(0.831) | TCGA-EA-A3QD-01 | Cervix | cervical & endocervical cancer | Female | <65 | III/IV | Chemotherapy | cisplatin | CR |
| Page: 1 2 3 4 5 6 7 8 9 10 |
Top |
Related drugs of malignant transformation related genes |
| Identification of chemicals and drugs interact with genes involved in malignant transfromation |
| (DGIdb 4.0) |
| Entrez ID | Symbol | Category | Interaction Types | Drug Claim Name | Drug Name | PMIDs |
| Page: 1 |

Copyright 2023-Present -The University of Texas Health Science Center at Houston |