
|
|||||
|
 | |
| |
| |
| |
| |
| |
|
Gene: GLIS2 |
Gene summary for GLIS2 |
| Gene information | Species | Human | Gene symbol | GLIS2 | Gene ID | 84662 |
| Gene name | GLIS family zinc finger 2 | |
| Gene Alias | NKL | |
| Cytomap | 16p13.3 | |
| Gene Type | protein-coding | GO ID | GO:0000122 | UniProtAcc | B3KTH4 |
Top |
Malignant transformation analysis |
| Identification of the aberrant gene expression in precancerous and cancerous lesions by comparing the gene expression of stem-like cells in diseased tissues with normal stem cells |
| Entrez ID | Symbol | Replicates | Species | Organ | Tissue | Adj P-value | Log2FC | Malignancy |
| 84662 | GLIS2 | HCC1_Meng | Human | Liver | HCC | 3.41e-02 | -2.21e-02 | 0.0246 |
| 84662 | GLIS2 | HCC2 | Human | Liver | HCC | 2.82e-03 | 2.13e+00 | 0.5341 |
| 84662 | GLIS2 | S014 | Human | Liver | HCC | 4.51e-10 | 4.95e-01 | 0.2254 |
| 84662 | GLIS2 | S015 | Human | Liver | HCC | 9.77e-06 | 4.15e-01 | 0.2375 |
| 84662 | GLIS2 | S016 | Human | Liver | HCC | 1.74e-10 | 4.84e-01 | 0.2243 |
| 84662 | GLIS2 | S028 | Human | Liver | HCC | 2.67e-11 | 4.65e-01 | 0.2503 |
| 84662 | GLIS2 | S029 | Human | Liver | HCC | 6.35e-13 | 5.57e-01 | 0.2581 |
| 84662 | GLIS2 | male-WTA | Human | Thyroid | PTC | 2.78e-18 | 2.13e-01 | 0.1037 |
| 84662 | GLIS2 | PTC04 | Human | Thyroid | PTC | 1.45e-05 | 1.17e-01 | 0.1927 |
| 84662 | GLIS2 | PTC05 | Human | Thyroid | PTC | 1.20e-04 | 1.59e-01 | 0.2065 |
| 84662 | GLIS2 | PTC06 | Human | Thyroid | PTC | 2.68e-12 | 1.74e-01 | 0.2057 |
| 84662 | GLIS2 | PTC07 | Human | Thyroid | PTC | 8.66e-05 | 7.12e-02 | 0.2044 |
| 84662 | GLIS2 | ATC12 | Human | Thyroid | ATC | 1.75e-06 | 1.98e-01 | 0.34 |
| 84662 | GLIS2 | ATC13 | Human | Thyroid | ATC | 1.02e-19 | 5.17e-01 | 0.34 |
| 84662 | GLIS2 | ATC2 | Human | Thyroid | ATC | 1.29e-06 | 6.96e-01 | 0.34 |
| 84662 | GLIS2 | ATC4 | Human | Thyroid | ATC | 4.68e-09 | 2.36e-01 | 0.34 |
| 84662 | GLIS2 | ATC5 | Human | Thyroid | ATC | 7.64e-30 | 5.61e-01 | 0.34 |
| Page: 1 |
| Tissue | Expression Dynamics | Abbreviation |
| Liver | 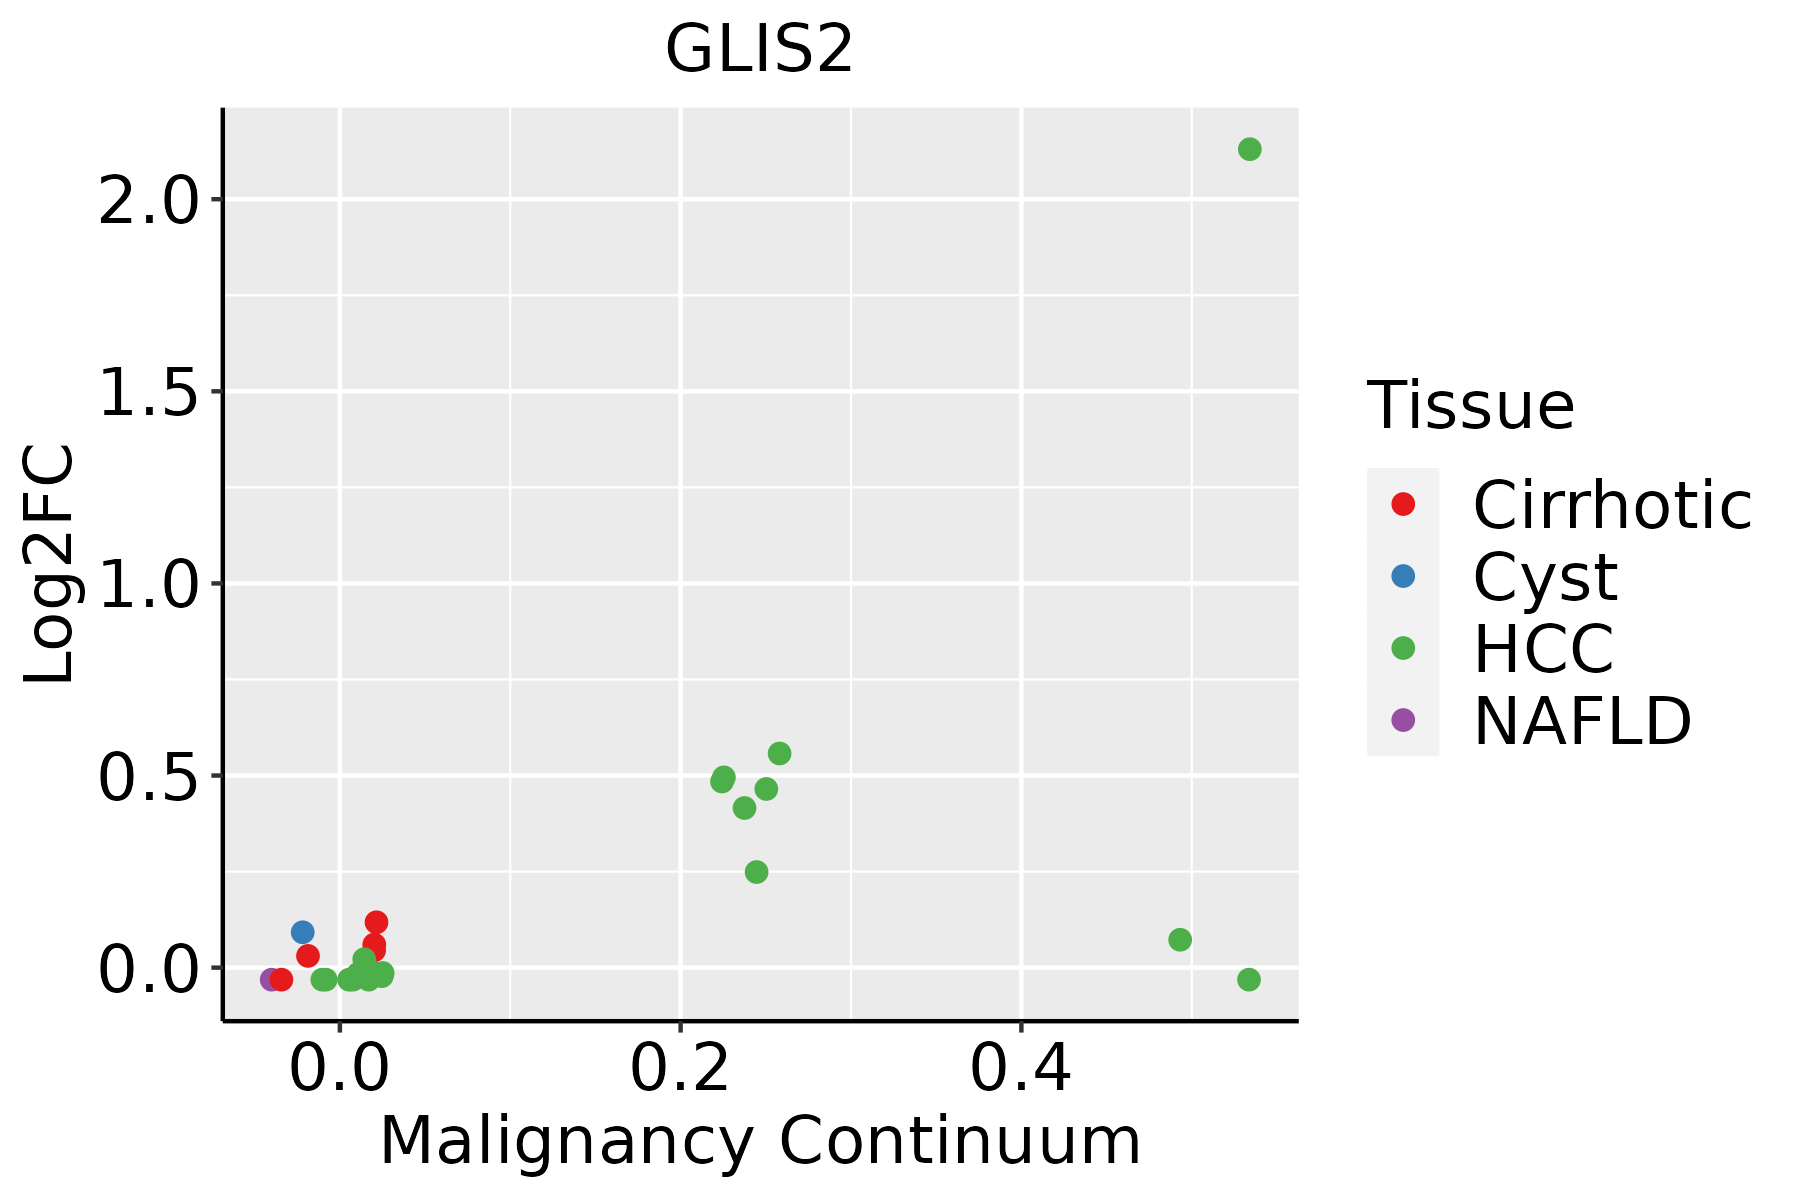 | HCC: Hepatocellular carcinoma |
| NAFLD: Non-alcoholic fatty liver disease | ||
| Thyroid | 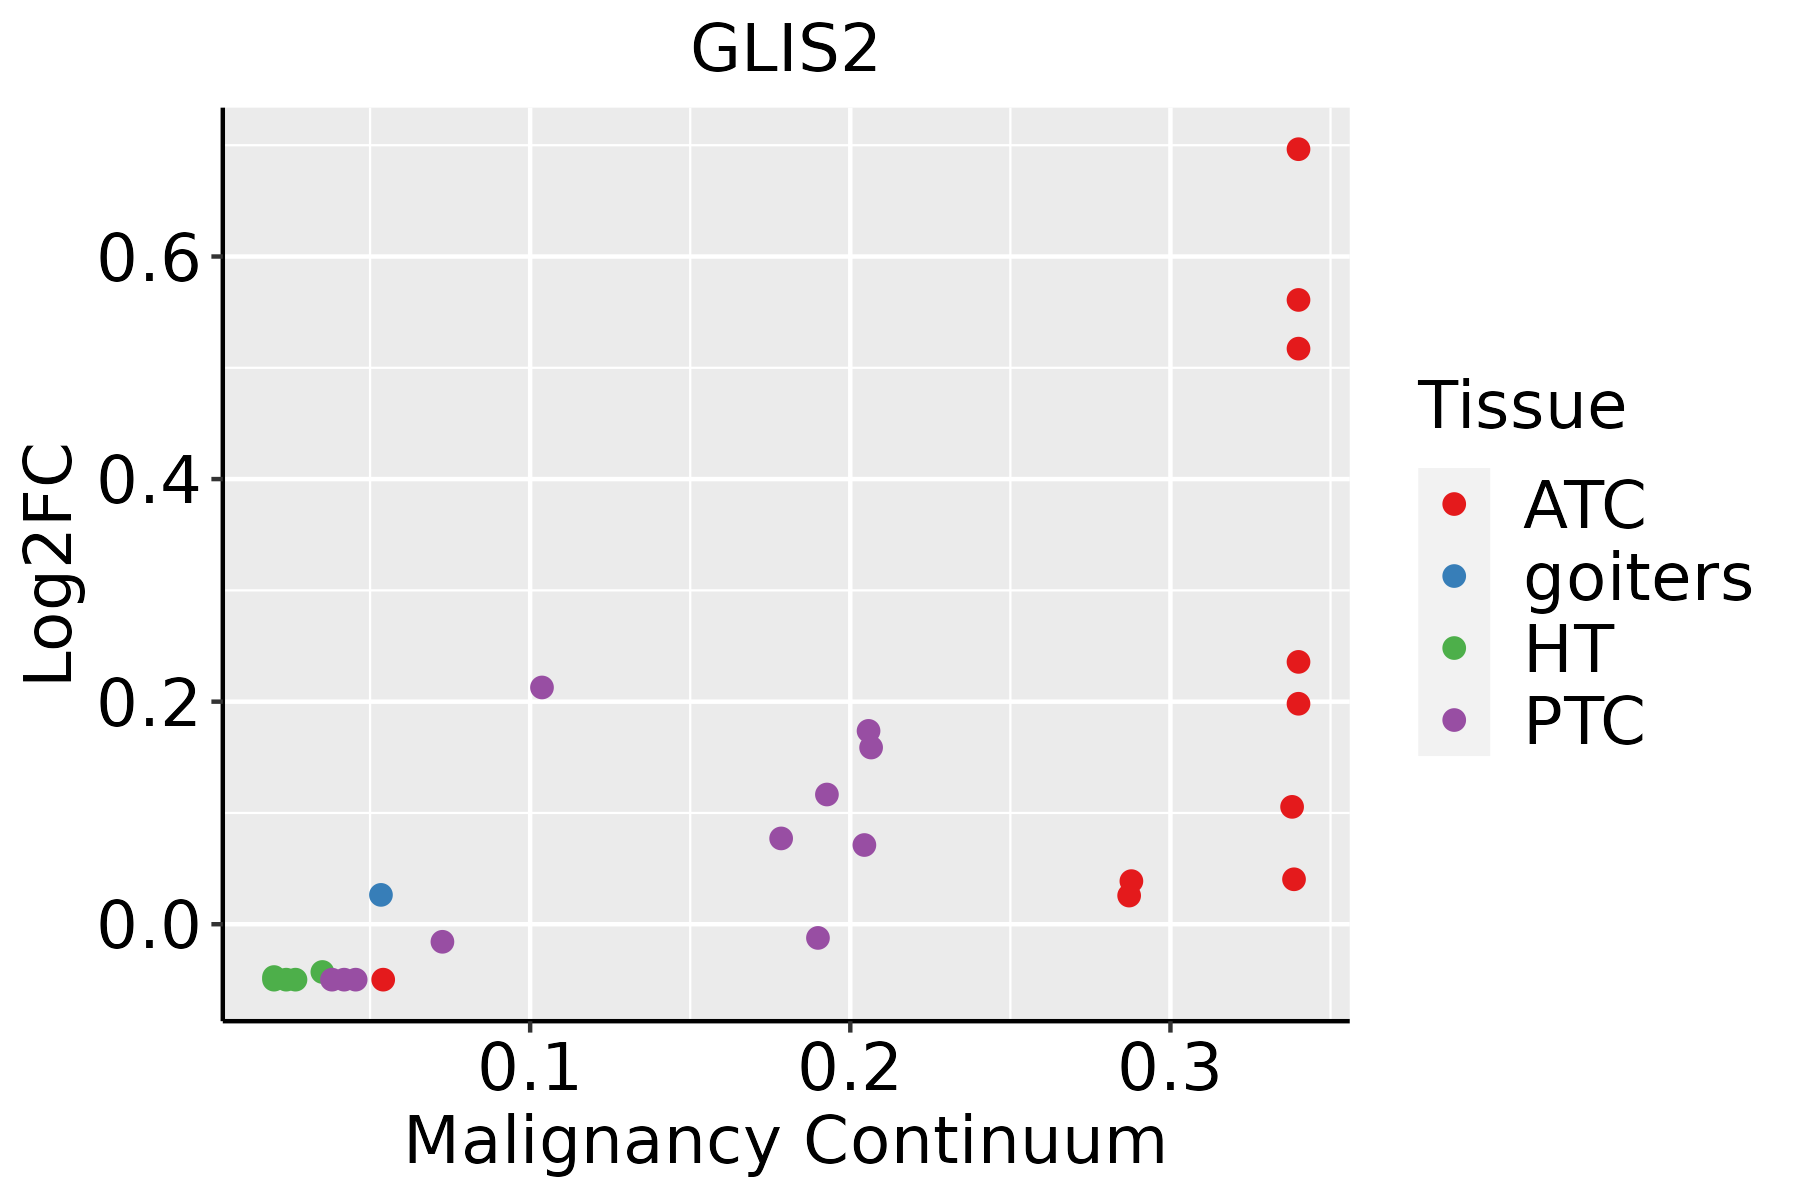 | ATC: Anaplastic thyroid cancer |
| HT: Hashimoto's thyroiditis | ||
| PTC: Papillary thyroid cancer |
| ∗log2FC in expression of this searched gene in stem-like cells from each diseased tissue sample relative to stem-like cells in normal samples in each tissue plotted against the malignancy continuum. Samples are colored based on if they are from different disease stage. |
Top |
Malignant transformation related pathway analysis |
| Find out the enriched GO biological processes and KEGG pathways involved in transition from healthy to precancer to cancer |
| Tissue | Disease Stage | Enriched GO biological Processes |
| Colorectum | AD |  |
| Colorectum | SER |  |
| Colorectum | MSS |  |
| Colorectum | MSI-H |  |
| Colorectum | FAP |  |
| ∗Top 15 enriched GO BP terms are showed in the bar plot of each disease state in each tissue. Each row represents a significant GO biological process which is colored according to the -log10(p.adjust). |
| Page: 1 2 3 4 5 6 7 8 9 |
| GO ID | Tissue | Disease Stage | Description | Gene Ratio | Bg Ratio | pvalue | p.adjust | Count |
| GO:190382922 | Liver | HCC | positive regulation of cellular protein localization | 199/7958 | 276/18723 | 1.15e-23 | 2.62e-21 | 199 |
| GO:003450421 | Liver | HCC | protein localization to nucleus | 194/7958 | 290/18723 | 2.84e-17 | 2.85e-15 | 194 |
| GO:190018212 | Liver | HCC | positive regulation of protein localization to nucleus | 67/7958 | 87/18723 | 5.43e-11 | 2.00e-09 | 67 |
| GO:190018012 | Liver | HCC | regulation of protein localization to nucleus | 95/7958 | 136/18723 | 9.26e-11 | 3.26e-09 | 95 |
| GO:004887222 | Liver | HCC | homeostasis of number of cells | 147/7958 | 272/18723 | 7.48e-05 | 6.70e-04 | 147 |
| GO:00510902 | Liver | HCC | regulation of DNA-binding transcription factor activity | 220/7958 | 440/18723 | 8.04e-04 | 4.82e-03 | 220 |
| GO:00016553 | Liver | HCC | urogenital system development | 170/7958 | 338/18723 | 2.15e-03 | 1.08e-02 | 170 |
| GO:00018222 | Liver | HCC | kidney development | 148/7958 | 293/18723 | 3.25e-03 | 1.49e-02 | 148 |
| GO:00720012 | Liver | HCC | renal system development | 152/7958 | 302/18723 | 3.45e-03 | 1.56e-02 | 152 |
| GO:0034504111 | Thyroid | PTC | protein localization to nucleus | 170/5968 | 290/18723 | 3.34e-21 | 6.38e-19 | 170 |
| GO:1903829113 | Thyroid | PTC | positive regulation of cellular protein localization | 162/5968 | 276/18723 | 2.40e-20 | 3.52e-18 | 162 |
| GO:1900180111 | Thyroid | PTC | regulation of protein localization to nucleus | 84/5968 | 136/18723 | 6.52e-13 | 3.08e-11 | 84 |
| GO:1900182110 | Thyroid | PTC | positive regulation of protein localization to nucleus | 59/5968 | 87/18723 | 6.13e-12 | 2.61e-10 | 59 |
| GO:0048872113 | Thyroid | PTC | homeostasis of number of cells | 125/5968 | 272/18723 | 7.25e-07 | 1.14e-05 | 125 |
| GO:000182215 | Thyroid | PTC | kidney development | 133/5968 | 293/18723 | 7.57e-07 | 1.18e-05 | 133 |
| GO:000165517 | Thyroid | PTC | urogenital system development | 149/5968 | 338/18723 | 1.41e-06 | 2.01e-05 | 149 |
| GO:007200114 | Thyroid | PTC | renal system development | 135/5968 | 302/18723 | 1.76e-06 | 2.43e-05 | 135 |
| GO:005109016 | Thyroid | PTC | regulation of DNA-binding transcription factor activity | 178/5968 | 440/18723 | 7.63e-05 | 6.54e-04 | 178 |
| GO:00614841 | Thyroid | PTC | hematopoietic stem cell homeostasis | 11/5968 | 18/18723 | 1.00e-02 | 4.07e-02 | 11 |
| GO:0045879 | Thyroid | PTC | negative regulation of smoothened signaling pathway | 17/5968 | 32/18723 | 1.02e-02 | 4.11e-02 | 17 |
| Page: 1 2 |
| Pathway ID | Tissue | Disease Stage | Description | Gene Ratio | Bg Ratio | pvalue | p.adjust | qvalue | Count |
| Page: 1 |
Top |
Cell-cell communication analysis |
| Identification of potential cell-cell interactions between two cell types and their ligand-receptor pairs for different disease states |
| Ligand | Receptor | LRpair | Pathway | Tissue | Disease Stage |
| Page: 1 |
Top |
Single-cell gene regulatory network inference analysis |
| Find out the significant the regulons (TFs) and the target genes of each regulon across cell types for different disease states |
| TF | Cell Type | Tissue | Disease Stage | Target Gene | RSS | Regulon Activity |
| GLIS2 | LUMP | Breast | Precancer | VASN,HMOX1,RASD2, etc. | 2.02e-01 |  |
| GLIS2 | ECM | Cervix | CC | VASN,PODN,IER3, etc. | 3.49e-02 |  |
| GLIS2 | MYOFIB | Prostate | ADJ | ASTN2,VASN,FOXQ1, etc. | 4.15e-01 |  |
| GLIS2 | SMC | Prostate | Healthy | ASTN2,VASN,FOXQ1, etc. | 3.19e-01 |  |
| GLIS2 | INCAF | Prostate | Tumor | ASTN2,VASN,FOXQ1, etc. | 2.91e-01 |  |
| ∗The dot plots of a searched regulon are shown for all cell subpopulations in each disease state of each tissue based on the regulon specific score inferred using pySCENIC and by calculating the average expression. |
| Page: 1 |
Top |
Somatic mutation of malignant transformation related genes |
| Annotation of somatic variants for genes involved in malignant transformation |
| Hugo Symbol | Variant Class | Variant Classification | dbSNP RS | HGVSc | HGVSp | HGVSp Short | SWISSPROT | BIOTYPE | SIFT | PolyPhen | Tumor Sample Barcode | Tissue | Histology | Sex | Age | Stage | Therapy Types | Drugs | Outcome |
| GLIS2 | SNV | Missense_Mutation | c.632N>A | p.Arg211His | p.R211H | Q9BZE0 | protein_coding | deleterious(0) | probably_damaging(0.992) | TCGA-AN-A0FZ-01 | Breast | breast invasive carcinoma | Female | <65 | III/IV | Unknown | Unknown | SD | |
| GLIS2 | SNV | Missense_Mutation | novel | c.386C>A | p.Ser129Tyr | p.S129Y | Q9BZE0 | protein_coding | deleterious(0) | possibly_damaging(0.527) | TCGA-C8-A27A-01 | Breast | breast invasive carcinoma | Female | <65 | I/II | Chemotherapy | 5-fluorouracil | CR |
| GLIS2 | SNV | Missense_Mutation | novel | c.170C>T | p.Ser57Leu | p.S57L | Q9BZE0 | protein_coding | deleterious(0.01) | benign(0.003) | TCGA-C5-A8XK-01 | Cervix | cervical & endocervical cancer | Female | <65 | I/II | Chemotherapy | cisplatin | SD |
| GLIS2 | SNV | Missense_Mutation | novel | c.942N>G | p.Ile314Met | p.I314M | Q9BZE0 | protein_coding | deleterious(0.02) | probably_damaging(0.932) | TCGA-HM-A4S6-01 | Cervix | cervical & endocervical cancer | Female | <65 | III/IV | Chemotherapy | cisplatin | CR |
| GLIS2 | SNV | Missense_Mutation | c.734C>T | p.Ser245Phe | p.S245F | Q9BZE0 | protein_coding | deleterious(0) | probably_damaging(1) | TCGA-Q1-A73O-01 | Cervix | cervical & endocervical cancer | Female | <65 | I/II | Chemotherapy | cisplatin | CR | |
| GLIS2 | SNV | Missense_Mutation | rs779142808 | c.1123N>C | p.Ala375Pro | p.A375P | Q9BZE0 | protein_coding | tolerated(0.32) | benign(0) | TCGA-AA-3492-01 | Colorectum | colon adenocarcinoma | Female | >=65 | I/II | Unknown | Unknown | SD |
| GLIS2 | SNV | Missense_Mutation | rs377037409 | c.101N>A | p.Arg34His | p.R34H | Q9BZE0 | protein_coding | tolerated(0.05) | benign(0) | TCGA-A5-A1OF-01 | Endometrium | uterine corpus endometrioid carcinoma | Female | <65 | I/II | Unknown | Unknown | SD |
| GLIS2 | SNV | Missense_Mutation | novel | c.646N>A | p.Phe216Ile | p.F216I | Q9BZE0 | protein_coding | deleterious(0.01) | probably_damaging(0.998) | TCGA-AX-A2HD-01 | Endometrium | uterine corpus endometrioid carcinoma | Female | >=65 | III/IV | Unknown | Unknown | SD |
| GLIS2 | SNV | Missense_Mutation | novel | c.955N>A | p.His319Asn | p.H319N | Q9BZE0 | protein_coding | deleterious(0.01) | benign(0.345) | TCGA-AX-A2HD-01 | Endometrium | uterine corpus endometrioid carcinoma | Female | >=65 | III/IV | Unknown | Unknown | SD |
| GLIS2 | SNV | Missense_Mutation | c.125T>C | p.Leu42Pro | p.L42P | Q9BZE0 | protein_coding | deleterious(0.02) | possibly_damaging(0.795) | TCGA-B5-A0K9-01 | Endometrium | uterine corpus endometrioid carcinoma | Female | >=65 | I/II | Unknown | Unknown | SD |
| Page: 1 2 3 4 |
Top |
Related drugs of malignant transformation related genes |
| Identification of chemicals and drugs interact with genes involved in malignant transfromation |
| (DGIdb 4.0) |
| Entrez ID | Symbol | Category | Interaction Types | Drug Claim Name | Drug Name | PMIDs |
| Page: 1 |

Copyright 2023-Present -The University of Texas Health Science Center at Houston |