
|
|||||
|
 | |
| |
| |
| |
| |
| |
|
Gene: GLIS1 |
Gene summary for GLIS1 |
| Gene information | Species | Human | Gene symbol | GLIS1 | Gene ID | 148979 |
| Gene name | GLIS family zinc finger 1 | |
| Gene Alias | GLIS1 | |
| Cytomap | 1p32.3 | |
| Gene Type | protein-coding | GO ID | GO:0000122 | UniProtAcc | Q8NBF1 |
Top |
Malignant transformation analysis |
| Identification of the aberrant gene expression in precancerous and cancerous lesions by comparing the gene expression of stem-like cells in diseased tissues with normal stem cells |
| Entrez ID | Symbol | Replicates | Species | Organ | Tissue | Adj P-value | Log2FC | Malignancy |
| 148979 | GLIS1 | C30 | Human | Oral cavity | OSCC | 5.10e-11 | 6.74e-01 | 0.3055 |
| 148979 | GLIS1 | C51 | Human | Oral cavity | OSCC | 1.10e-19 | 1.20e+00 | 0.2674 |
| Page: 1 |
| Tissue | Expression Dynamics | Abbreviation |
| Oral Cavity | 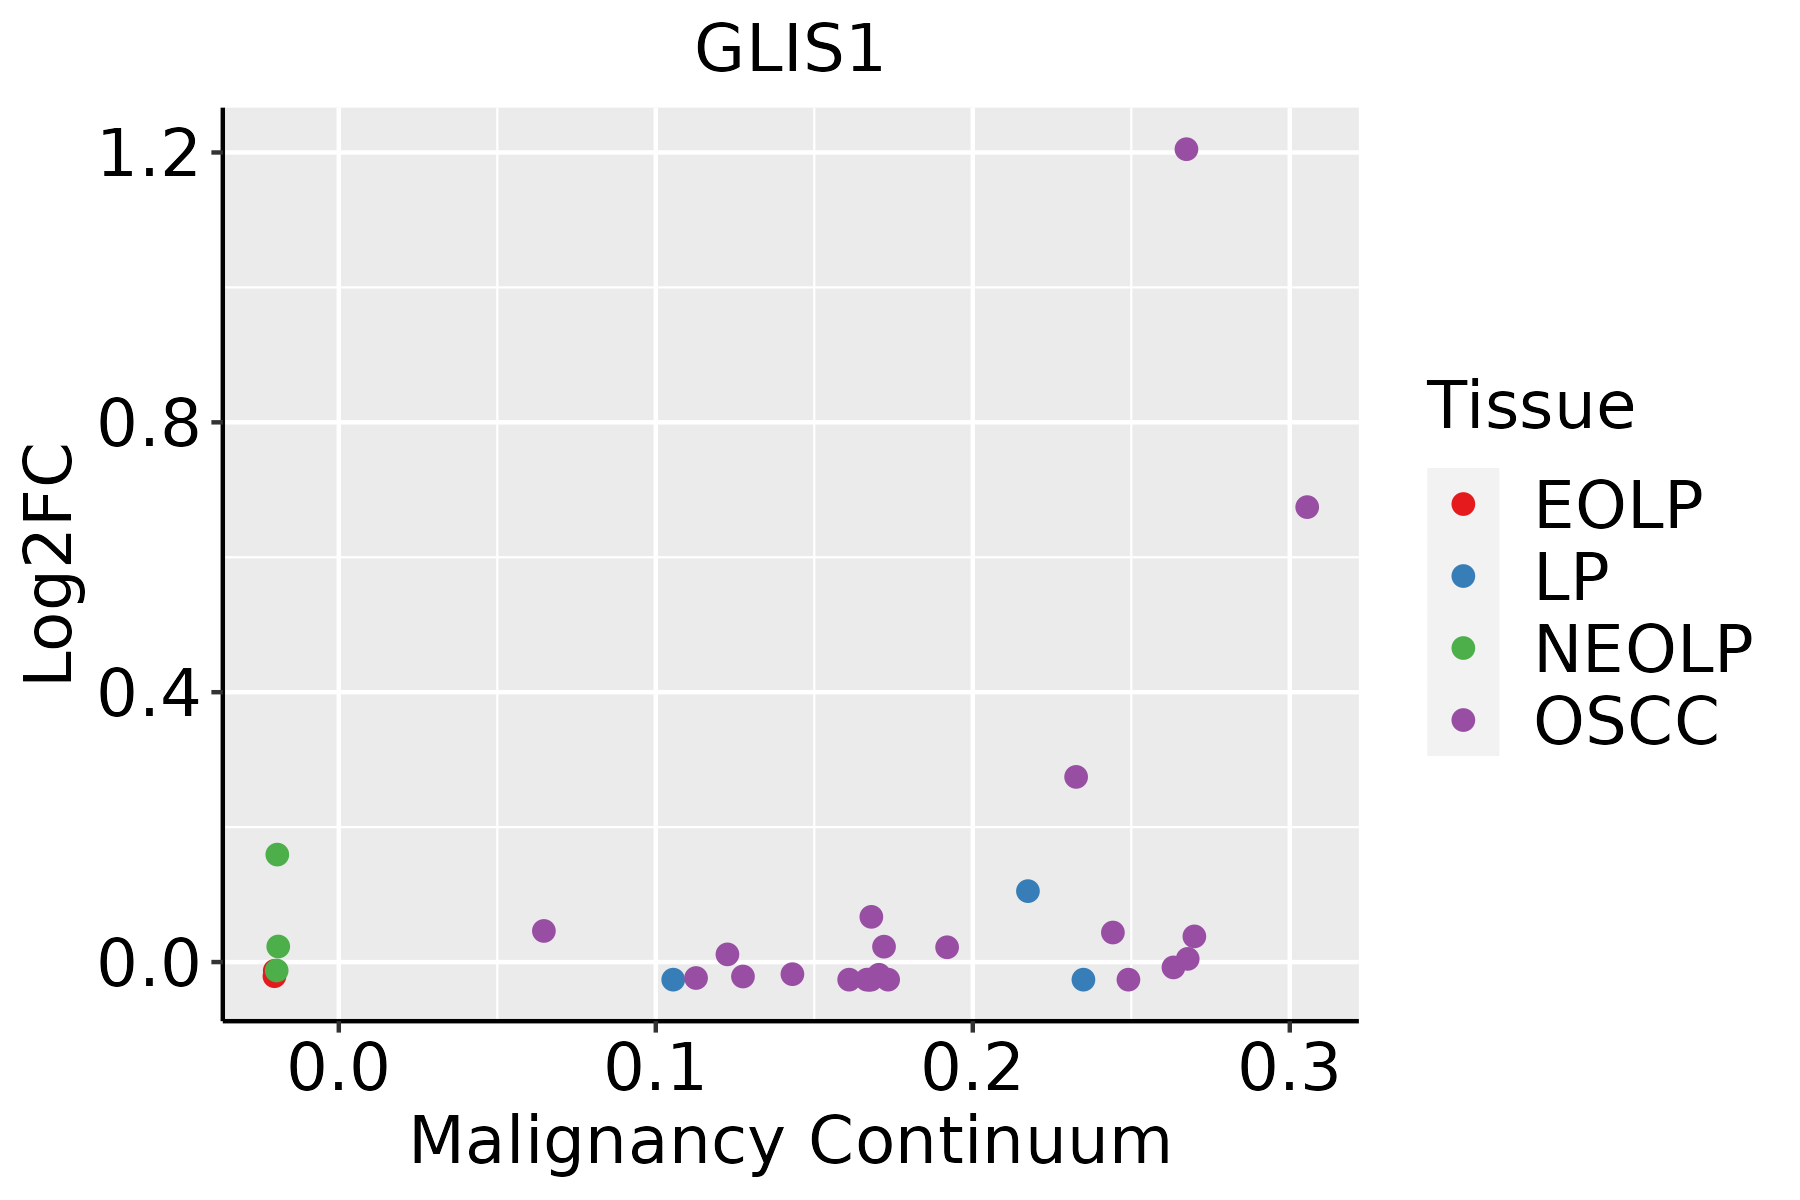 | EOLP: Erosive Oral lichen planus |
| LP: leukoplakia | ||
| NEOLP: Non-erosive oral lichen planus | ||
| OSCC: Oral squamous cell carcinoma |
| ∗log2FC in expression of this searched gene in stem-like cells from each diseased tissue sample relative to stem-like cells in normal samples in each tissue plotted against the malignancy continuum. Samples are colored based on if they are from different disease stage. |
Top |
Malignant transformation related pathway analysis |
| Find out the enriched GO biological processes and KEGG pathways involved in transition from healthy to precancer to cancer |
| Tissue | Disease Stage | Enriched GO biological Processes |
| Colorectum | AD |  |
| Colorectum | SER |  |
| Colorectum | MSS |  |
| Colorectum | MSI-H |  |
| Colorectum | FAP |  |
| ∗Top 15 enriched GO BP terms are showed in the bar plot of each disease state in each tissue. Each row represents a significant GO biological process which is colored according to the -log10(p.adjust). |
| Page: 1 2 3 4 5 6 7 8 9 |
| GO ID | Tissue | Disease Stage | Description | Gene Ratio | Bg Ratio | pvalue | p.adjust | Count |
| Page: 1 |
| Pathway ID | Tissue | Disease Stage | Description | Gene Ratio | Bg Ratio | pvalue | p.adjust | qvalue | Count |
| Page: 1 |
Top |
Cell-cell communication analysis |
| Identification of potential cell-cell interactions between two cell types and their ligand-receptor pairs for different disease states |
| Ligand | Receptor | LRpair | Pathway | Tissue | Disease Stage |
| Page: 1 |
Top |
Single-cell gene regulatory network inference analysis |
| Find out the significant the regulons (TFs) and the target genes of each regulon across cell types for different disease states |
| TF | Cell Type | Tissue | Disease Stage | Target Gene | RSS | Regulon Activity |
| GLIS1 | MSC | Breast | ADJ | AC012360.3,AC093673.5,ZFP36, etc. | 5.13e-03 |  |
| GLIS1 | CAF | Breast | DCIS | AC012360.3,AC093673.5,ZFP36, etc. | 6.58e-02 |  |
| GLIS1 | ICAF | Esophagus | ESCC | FAM105A,VSTM4,SLC9A3R1, etc. | 3.08e-01 |  |
| GLIS1 | PERI | Stomach | ADJ | ISLR,PDE3B,ADAM33, etc. | 1.58e-02 |  |
| GLIS1 | PERI | Stomach | CSG | ISLR,PDE3B,ADAM33, etc. | 3.01e-02 |  |
| GLIS1 | INCAF | Stomach | GC | ISLR,PDE3B,ADAM33, etc. | 3.93e-01 |  |
| GLIS1 | INCAF | Stomach | Healthy | ISLR,PDE3B,ADAM33, etc. | 1.07e-01 |  |
| GLIS1 | SMC | Stomach | WIM | ISLR,PDE3B,ADAM33, etc. | 7.30e-02 |  |
| ∗The dot plots of a searched regulon are shown for all cell subpopulations in each disease state of each tissue based on the regulon specific score inferred using pySCENIC and by calculating the average expression. |
| Page: 1 |
Top |
Somatic mutation of malignant transformation related genes |
| Annotation of somatic variants for genes involved in malignant transformation |
| Hugo Symbol | Variant Class | Variant Classification | dbSNP RS | HGVSc | HGVSp | HGVSp Short | SWISSPROT | BIOTYPE | SIFT | PolyPhen | Tumor Sample Barcode | Tissue | Histology | Sex | Age | Stage | Therapy Types | Drugs | Outcome |
| GLIS1 | SNV | Missense_Mutation | novel | c.723N>T | p.Lys241Asn | p.K241N | Q8NBF1 | protein_coding | deleterious(0) | probably_damaging(0.958) | TCGA-A8-A090-01 | Breast | breast invasive carcinoma | Female | >=65 | I/II | Unknown | Unknown | SD |
| GLIS1 | SNV | Missense_Mutation | novel | c.1755G>T | p.Gln585His | p.Q585H | Q8NBF1 | protein_coding | deleterious_low_confidence(0.02) | possibly_damaging(0.846) | TCGA-AC-A23G-01 | Breast | breast invasive carcinoma | Female | >=65 | I/II | Chemotherapy | cytoxan | CR |
| GLIS1 | SNV | Missense_Mutation | rs755556848 | c.1742C>T | p.Ala581Val | p.A581V | Q8NBF1 | protein_coding | tolerated_low_confidence(0.2) | benign(0) | TCGA-AC-A23H-01 | Breast | breast invasive carcinoma | Female | >=65 | I/II | Unknown | Unknown | PD |
| GLIS1 | SNV | Missense_Mutation | novel | c.384N>A | p.Asp128Glu | p.D128E | Q8NBF1 | protein_coding | tolerated_low_confidence(1) | benign(0) | TCGA-E2-A1B5-01 | Breast | breast invasive carcinoma | Female | <65 | I/II | Hormone Therapy | tamoxiphen | SD |
| GLIS1 | SNV | Missense_Mutation | novel | c.961C>T | p.Pro321Ser | p.P321S | Q8NBF1 | protein_coding | deleterious(0) | benign(0.318) | TCGA-2W-A8YY-01 | Cervix | cervical & endocervical cancer | Female | <65 | I/II | Chemotherapy | cisplatin | CR |
| GLIS1 | SNV | Missense_Mutation | rs747562057 | c.821N>T | p.Ser274Leu | p.S274L | Q8NBF1 | protein_coding | deleterious(0) | possibly_damaging(0.872) | TCGA-C5-A1BQ-01 | Cervix | cervical & endocervical cancer | Female | >=65 | III/IV | Chemotherapy | cisplatin | CR |
| GLIS1 | SNV | Missense_Mutation | c.1650N>G | p.Phe550Leu | p.F550L | Q8NBF1 | protein_coding | deleterious(0.04) | benign(0.444) | TCGA-EK-A2RJ-01 | Cervix | cervical & endocervical cancer | Female | <65 | I/II | Unknown | Unknown | SD | |
| GLIS1 | SNV | Missense_Mutation | rs555262672 | c.1342N>A | p.Glu448Lys | p.E448K | Q8NBF1 | protein_coding | deleterious(0.02) | possibly_damaging(0.549) | TCGA-HM-A4S6-01 | Cervix | cervical & endocervical cancer | Female | <65 | III/IV | Chemotherapy | cisplatin | CR |
| GLIS1 | SNV | Missense_Mutation | c.670N>A | p.Arg224Ser | p.R224S | Q8NBF1 | protein_coding | deleterious(0.01) | benign(0.234) | TCGA-A6-3810-01 | Colorectum | colon adenocarcinoma | Male | <65 | I/II | Unknown | Unknown | SD | |
| GLIS1 | SNV | Missense_Mutation | novel | c.302T>C | p.Val101Ala | p.V101A | Q8NBF1 | protein_coding | deleterious(0) | benign(0.005) | TCGA-AA-A00N-01 | Colorectum | colon adenocarcinoma | Male | >=65 | I/II | Unknown | Unknown | PD |
| Page: 1 2 3 4 5 6 7 |
Top |
Related drugs of malignant transformation related genes |
| Identification of chemicals and drugs interact with genes involved in malignant transfromation |
| (DGIdb 4.0) |
| Entrez ID | Symbol | Category | Interaction Types | Drug Claim Name | Drug Name | PMIDs |
| Page: 1 |

Copyright 2023-Present -The University of Texas Health Science Center at Houston |