
|
|||||
|
 | |
| |
| |
| |
| |
| |
|
Gene: GLIPR2 |
Gene summary for GLIPR2 |
| Gene information | Species | Human | Gene symbol | GLIPR2 | Gene ID | 152007 |
| Gene name | GLI pathogenesis related 2 | |
| Gene Alias | C9orf19 | |
| Cytomap | 9p13.3 | |
| Gene Type | protein-coding | GO ID | GO:0000165 | UniProtAcc | Q5VZR0 |
Top |
Malignant transformation analysis |
| Identification of the aberrant gene expression in precancerous and cancerous lesions by comparing the gene expression of stem-like cells in diseased tissues with normal stem cells |
| Entrez ID | Symbol | Replicates | Species | Organ | Tissue | Adj P-value | Log2FC | Malignancy |
| 152007 | GLIPR2 | LZE24T | Human | Esophagus | ESCC | 1.07e-02 | 1.68e-01 | 0.0596 |
| 152007 | GLIPR2 | P2T-E | Human | Esophagus | ESCC | 5.03e-37 | 6.40e-01 | 0.1177 |
| 152007 | GLIPR2 | P4T-E | Human | Esophagus | ESCC | 3.33e-07 | 2.19e-01 | 0.1323 |
| 152007 | GLIPR2 | P5T-E | Human | Esophagus | ESCC | 8.40e-04 | 1.07e-01 | 0.1327 |
| 152007 | GLIPR2 | P8T-E | Human | Esophagus | ESCC | 2.56e-16 | 2.98e-01 | 0.0889 |
| 152007 | GLIPR2 | P9T-E | Human | Esophagus | ESCC | 1.67e-04 | 2.11e-01 | 0.1131 |
| 152007 | GLIPR2 | P10T-E | Human | Esophagus | ESCC | 2.05e-07 | 1.18e-01 | 0.116 |
| 152007 | GLIPR2 | P11T-E | Human | Esophagus | ESCC | 6.00e-06 | 2.91e-01 | 0.1426 |
| 152007 | GLIPR2 | P12T-E | Human | Esophagus | ESCC | 3.97e-04 | 1.13e-01 | 0.1122 |
| 152007 | GLIPR2 | P16T-E | Human | Esophagus | ESCC | 8.08e-19 | 3.42e-01 | 0.1153 |
| 152007 | GLIPR2 | P17T-E | Human | Esophagus | ESCC | 4.44e-02 | 2.53e-01 | 0.1278 |
| 152007 | GLIPR2 | P19T-E | Human | Esophagus | ESCC | 1.65e-10 | 6.32e-01 | 0.1662 |
| 152007 | GLIPR2 | P24T-E | Human | Esophagus | ESCC | 8.40e-04 | 1.03e-01 | 0.1287 |
| 152007 | GLIPR2 | P28T-E | Human | Esophagus | ESCC | 3.89e-12 | 2.22e-01 | 0.1149 |
| 152007 | GLIPR2 | P32T-E | Human | Esophagus | ESCC | 9.56e-08 | 1.98e-01 | 0.1666 |
| 152007 | GLIPR2 | P44T-E | Human | Esophagus | ESCC | 9.06e-05 | 2.24e-01 | 0.1096 |
| 152007 | GLIPR2 | P47T-E | Human | Esophagus | ESCC | 1.66e-02 | 1.06e-01 | 0.1067 |
| 152007 | GLIPR2 | P49T-E | Human | Esophagus | ESCC | 3.30e-07 | 5.02e-01 | 0.1768 |
| 152007 | GLIPR2 | P61T-E | Human | Esophagus | ESCC | 3.89e-03 | 1.50e-01 | 0.099 |
| 152007 | GLIPR2 | P74T-E | Human | Esophagus | ESCC | 3.62e-06 | 2.02e-01 | 0.1479 |
| Page: 1 2 |
| Tissue | Expression Dynamics | Abbreviation |
| Esophagus |  | ESCC: Esophageal squamous cell carcinoma |
| HGIN: High-grade intraepithelial neoplasias | ||
| LGIN: Low-grade intraepithelial neoplasias | ||
| Oral Cavity | 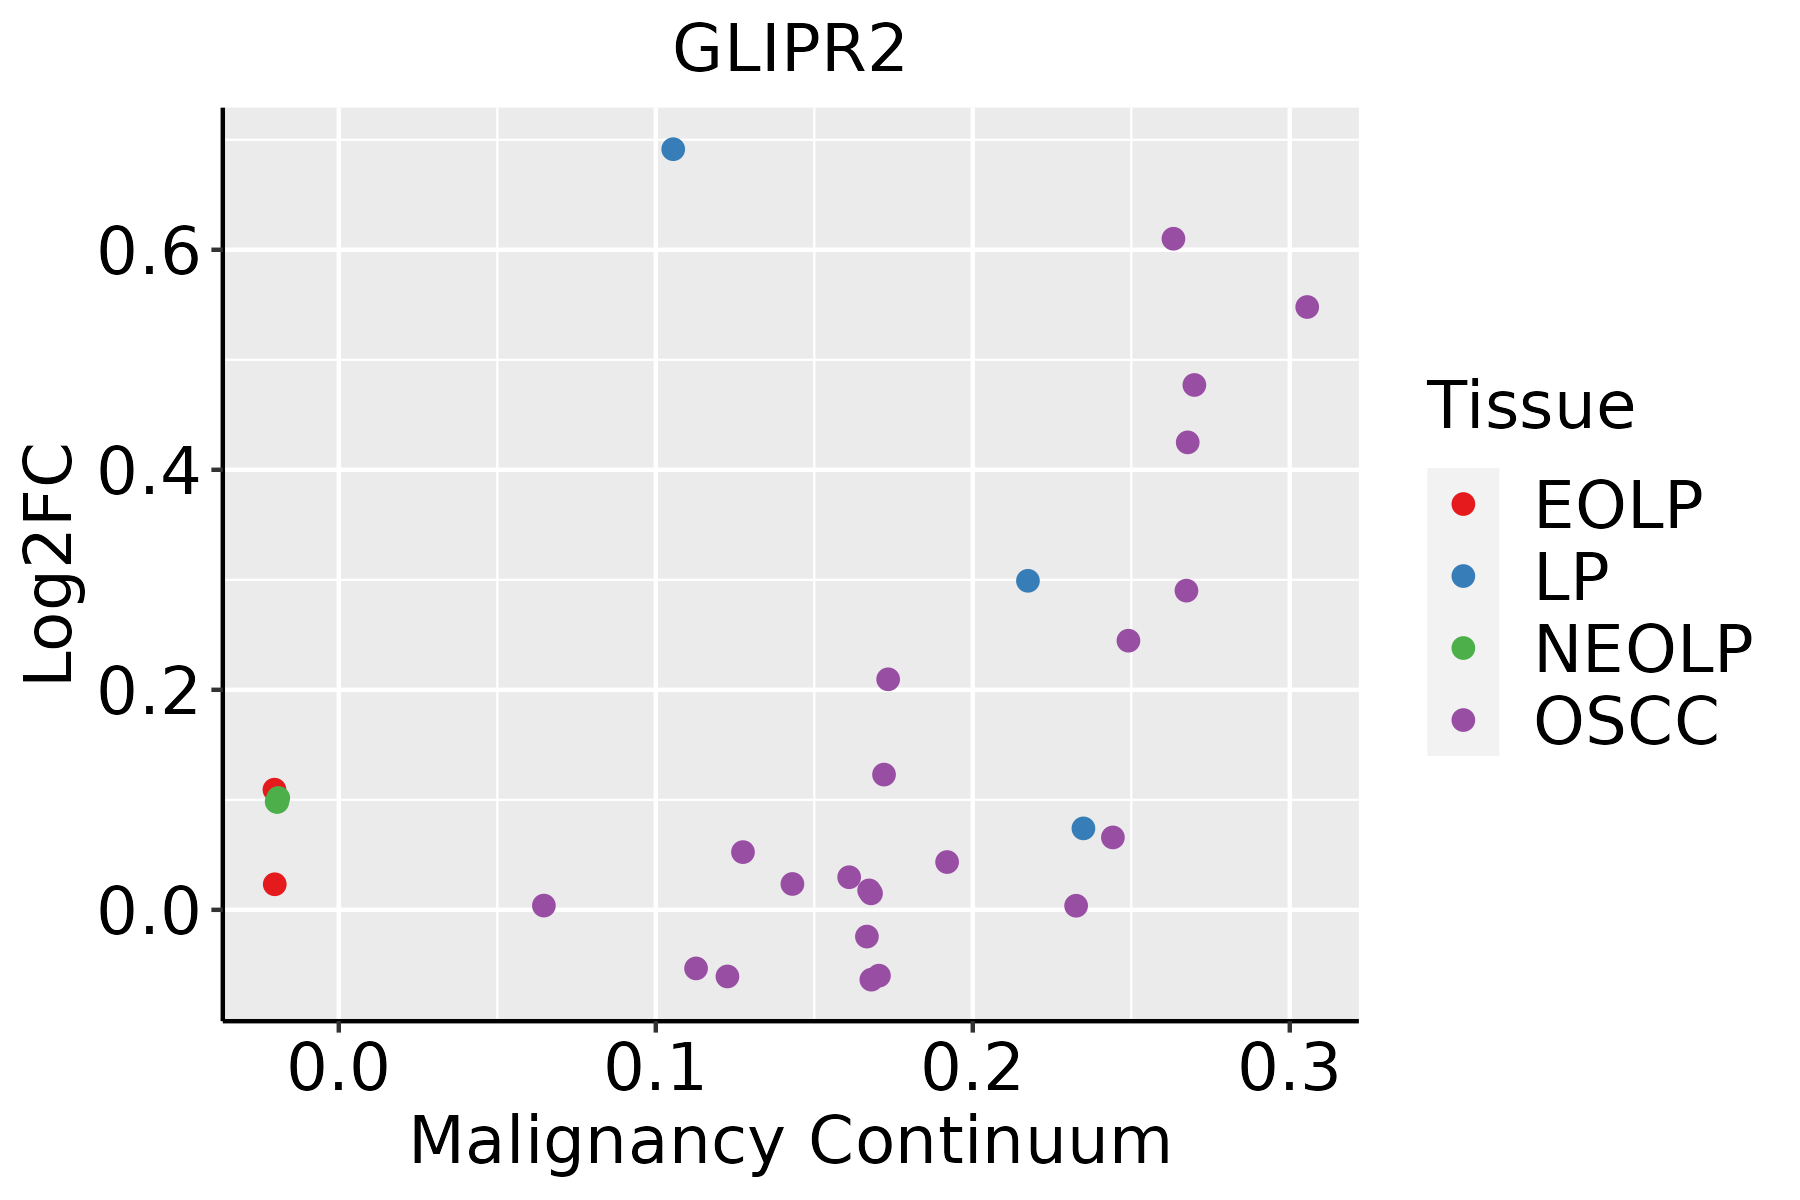 | EOLP: Erosive Oral lichen planus |
| LP: leukoplakia | ||
| NEOLP: Non-erosive oral lichen planus | ||
| OSCC: Oral squamous cell carcinoma | ||
| Thyroid | 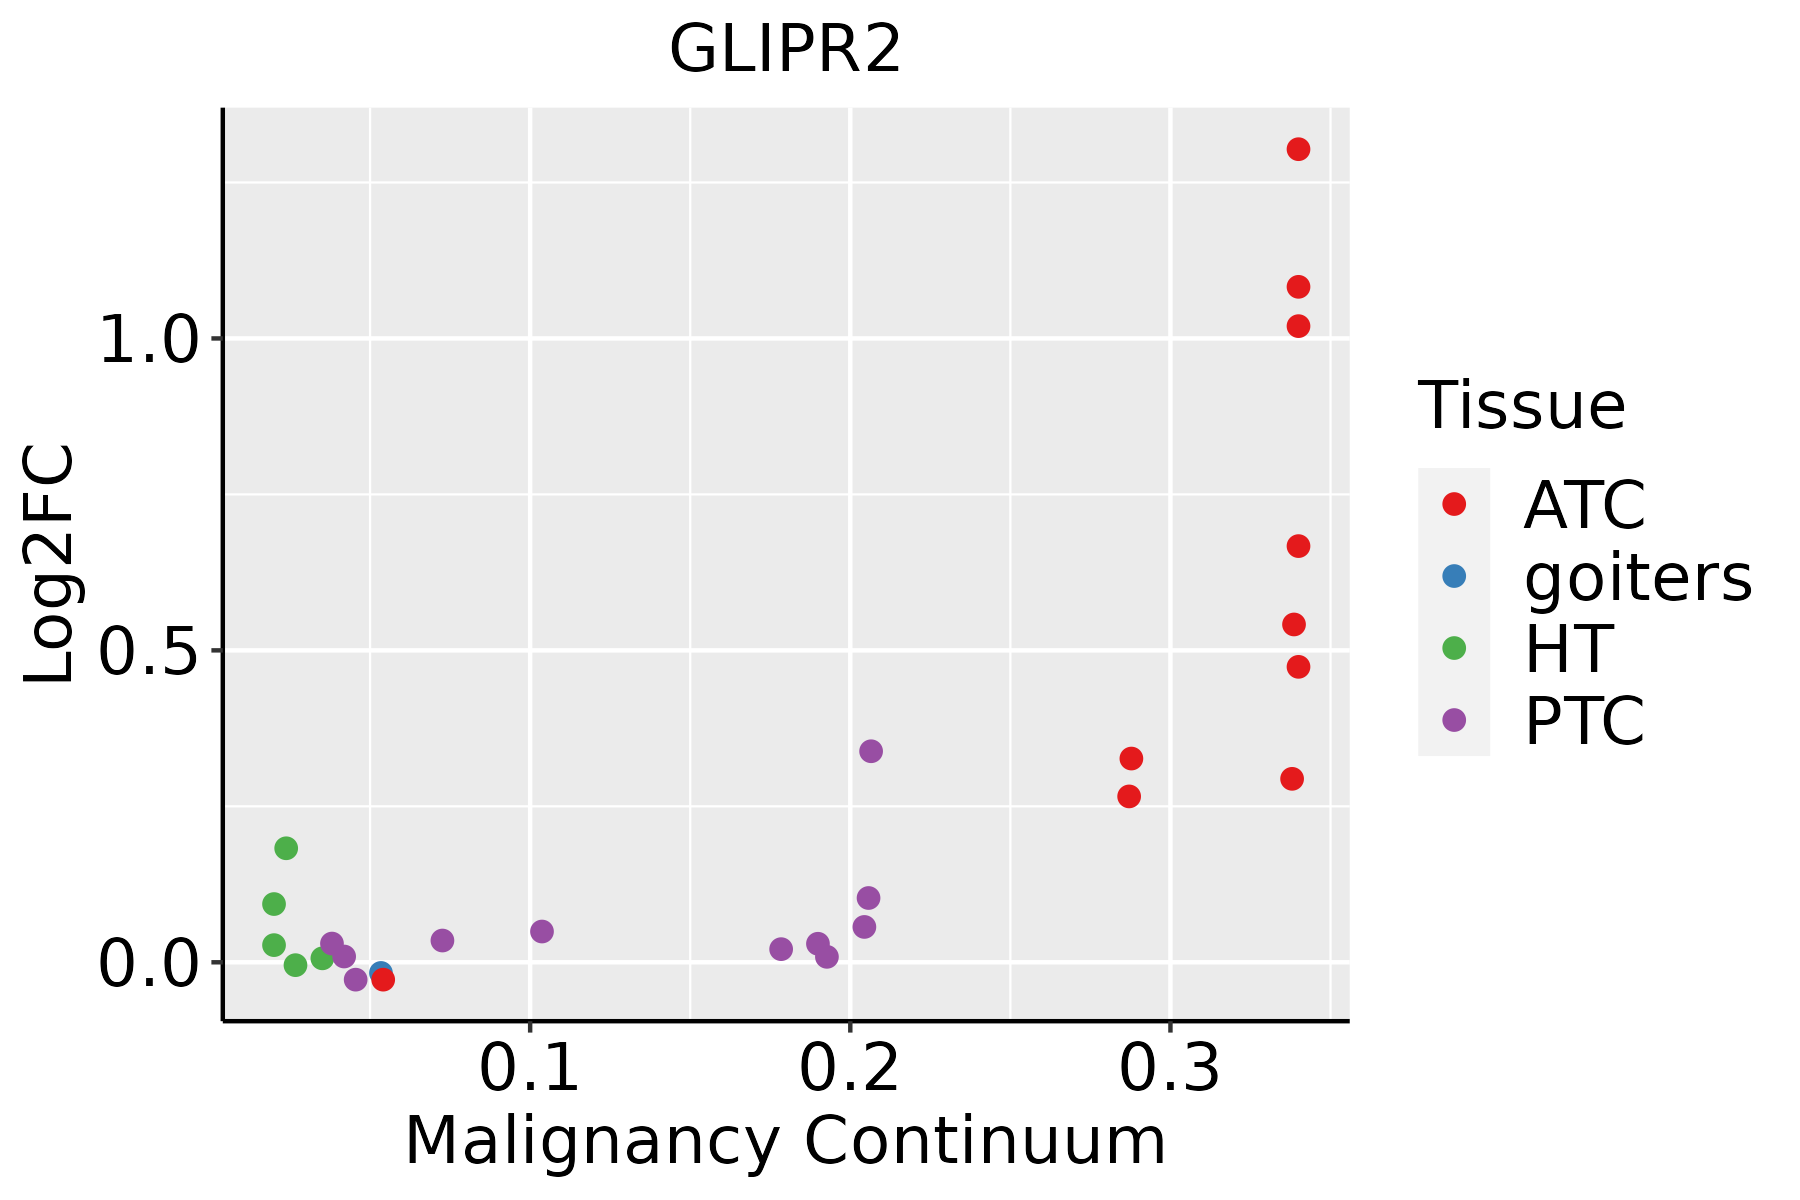 | ATC: Anaplastic thyroid cancer |
| HT: Hashimoto's thyroiditis | ||
| PTC: Papillary thyroid cancer |
| ∗log2FC in expression of this searched gene in stem-like cells from each diseased tissue sample relative to stem-like cells in normal samples in each tissue plotted against the malignancy continuum. Samples are colored based on if they are from different disease stage. |
Top |
Malignant transformation related pathway analysis |
| Find out the enriched GO biological processes and KEGG pathways involved in transition from healthy to precancer to cancer |
| Tissue | Disease Stage | Enriched GO biological Processes |
| Colorectum | AD |  |
| Colorectum | SER |  |
| Colorectum | MSS |  |
| Colorectum | MSI-H |  |
| Colorectum | FAP |  |
| ∗Top 15 enriched GO BP terms are showed in the bar plot of each disease state in each tissue. Each row represents a significant GO biological process which is colored according to the -log10(p.adjust). |
| Page: 1 2 3 4 5 6 7 8 9 |
| GO ID | Tissue | Disease Stage | Description | Gene Ratio | Bg Ratio | pvalue | p.adjust | Count |
| GO:00107184 | Esophagus | ESCC | positive regulation of epithelial to mesenchymal transition | 40/8552 | 52/18723 | 4.25e-06 | 4.56e-05 | 40 |
| GO:00018378 | Esophagus | ESCC | epithelial to mesenchymal transition | 95/8552 | 157/18723 | 1.25e-04 | 8.56e-04 | 95 |
| GO:00487628 | Esophagus | ESCC | mesenchymal cell differentiation | 133/8552 | 236/18723 | 5.94e-04 | 3.22e-03 | 133 |
| GO:00107174 | Esophagus | ESCC | regulation of epithelial to mesenchymal transition | 61/8552 | 99/18723 | 1.01e-03 | 5.09e-03 | 61 |
| GO:000166720 | Esophagus | ESCC | ameboidal-type cell migration | 250/8552 | 475/18723 | 1.22e-03 | 5.97e-03 | 250 |
| GO:00604856 | Esophagus | ESCC | mesenchyme development | 156/8552 | 291/18723 | 3.76e-03 | 1.53e-02 | 156 |
| GO:001063120 | Esophagus | ESCC | epithelial cell migration | 187/8552 | 357/18723 | 6.05e-03 | 2.23e-02 | 187 |
| GO:009013220 | Esophagus | ESCC | epithelium migration | 188/8552 | 360/18723 | 6.96e-03 | 2.54e-02 | 188 |
| GO:009013020 | Esophagus | ESCC | tissue migration | 190/8552 | 365/18723 | 7.91e-03 | 2.82e-02 | 190 |
| GO:00107183 | Oral cavity | OSCC | positive regulation of epithelial to mesenchymal transition | 35/7305 | 52/18723 | 3.34e-05 | 3.00e-04 | 35 |
| GO:000166719 | Oral cavity | OSCC | ameboidal-type cell migration | 228/7305 | 475/18723 | 3.46e-05 | 3.10e-04 | 228 |
| GO:001063118 | Oral cavity | OSCC | epithelial cell migration | 174/7305 | 357/18723 | 1.04e-04 | 7.70e-04 | 174 |
| GO:009013218 | Oral cavity | OSCC | epithelium migration | 175/7305 | 360/18723 | 1.18e-04 | 8.54e-04 | 175 |
| GO:009013018 | Oral cavity | OSCC | tissue migration | 176/7305 | 365/18723 | 1.92e-04 | 1.29e-03 | 176 |
| GO:00018377 | Oral cavity | OSCC | epithelial to mesenchymal transition | 82/7305 | 157/18723 | 5.09e-04 | 2.98e-03 | 82 |
| GO:00107173 | Oral cavity | OSCC | regulation of epithelial to mesenchymal transition | 54/7305 | 99/18723 | 1.21e-03 | 6.10e-03 | 54 |
| GO:001063418 | Oral cavity | OSCC | positive regulation of epithelial cell migration | 88/7305 | 176/18723 | 1.91e-03 | 8.94e-03 | 88 |
| GO:001063218 | Oral cavity | OSCC | regulation of epithelial cell migration | 136/7305 | 292/18723 | 4.82e-03 | 1.92e-02 | 136 |
| GO:00434107 | Oral cavity | OSCC | positive regulation of MAPK cascade | 213/7305 | 480/18723 | 8.71e-03 | 3.16e-02 | 213 |
| GO:00703716 | Oral cavity | OSCC | ERK1 and ERK2 cascade | 150/7305 | 330/18723 | 9.47e-03 | 3.38e-02 | 150 |
| Page: 1 2 3 |
| Pathway ID | Tissue | Disease Stage | Description | Gene Ratio | Bg Ratio | pvalue | p.adjust | qvalue | Count |
| Page: 1 |
Top |
Cell-cell communication analysis |
| Identification of potential cell-cell interactions between two cell types and their ligand-receptor pairs for different disease states |
| Ligand | Receptor | LRpair | Pathway | Tissue | Disease Stage |
| Page: 1 |
Top |
Single-cell gene regulatory network inference analysis |
| Find out the significant the regulons (TFs) and the target genes of each regulon across cell types for different disease states |
| TF | Cell Type | Tissue | Disease Stage | Target Gene | RSS | Regulon Activity |
| ∗The dot plots of a searched regulon are shown for all cell subpopulations in each disease state of each tissue based on the regulon specific score inferred using pySCENIC and by calculating the average expression. |
| Page: 1 |
Top |
Somatic mutation of malignant transformation related genes |
| Annotation of somatic variants for genes involved in malignant transformation |
| Hugo Symbol | Variant Class | Variant Classification | dbSNP RS | HGVSc | HGVSp | HGVSp Short | SWISSPROT | BIOTYPE | SIFT | PolyPhen | Tumor Sample Barcode | Tissue | Histology | Sex | Age | Stage | Therapy Types | Drugs | Outcome |
| GLIPR2 | SNV | Missense_Mutation | novel | c.409G>T | p.Gly137Trp | p.G137W | Q9H4G4 | protein_coding | deleterious(0) | probably_damaging(0.96) | TCGA-AN-A0AK-01 | Breast | breast invasive carcinoma | Female | >=65 | I/II | Unknown | Unknown | SD |
| GLIPR2 | deletion | Frame_Shift_Del | novel | c.166_176delNNNNNNNNNNN | p.Glu57TrpfsTer13 | p.E57Wfs*13 | Q9H4G4 | protein_coding | TCGA-A8-A095-01 | Breast | breast invasive carcinoma | Female | <65 | I/II | Chemotherapy | 5-fluorouracil | CR | ||
| GLIPR2 | SNV | Missense_Mutation | novel | c.256N>A | p.Glu86Lys | p.E86K | Q9H4G4 | protein_coding | deleterious(0) | probably_damaging(0.992) | TCGA-AA-3814-01 | Colorectum | colon adenocarcinoma | Female | >=65 | I/II | Unknown | Unknown | SD |
| GLIPR2 | SNV | Missense_Mutation | novel | c.74N>C | p.Gly25Ala | p.G25A | Q9H4G4 | protein_coding | tolerated(0.14) | benign(0.044) | TCGA-AG-3726-01 | Colorectum | rectum adenocarcinoma | Female | <65 | I/II | Unknown | Unknown | SD |
| GLIPR2 | SNV | Missense_Mutation | rs201812895 | c.146C>T | p.Thr49Met | p.T49M | Q9H4G4 | protein_coding | deleterious(0.02) | possibly_damaging(0.794) | TCGA-AH-6544-01 | Colorectum | rectum adenocarcinoma | Male | <65 | III/IV | Chemotherapy | oxaliplatin | SD |
| GLIPR2 | deletion | Frame_Shift_Del | c.78delN | p.Pro28HisfsTer2 | p.P28Hfs*2 | Q9H4G4 | protein_coding | TCGA-AA-3811-01 | Colorectum | colon adenocarcinoma | Female | >=65 | III/IV | Unknown | Unknown | PD | |||
| GLIPR2 | SNV | Missense_Mutation | rs749643384 | c.349G>A | p.Val117Met | p.V117M | Q9H4G4 | protein_coding | deleterious(0.04) | possibly_damaging(0.738) | TCGA-A5-A0GM-01 | Endometrium | uterine corpus endometrioid carcinoma | Female | <65 | I/II | Unknown | Unknown | SD |
| GLIPR2 | SNV | Missense_Mutation | novel | c.445N>A | p.Val149Ile | p.V149I | Q9H4G4 | protein_coding | deleterious(0.03) | benign(0.003) | TCGA-B5-A5OC-01 | Endometrium | uterine corpus endometrioid carcinoma | Female | >=65 | III/IV | Chemotherapy | cisplatin | SD |
| GLIPR2 | SNV | Missense_Mutation | rs201812895 | c.146C>T | p.Thr49Met | p.T49M | Q9H4G4 | protein_coding | deleterious(0.02) | possibly_damaging(0.794) | TCGA-D1-A103-01 | Endometrium | uterine corpus endometrioid carcinoma | Female | >=65 | I/II | Unknown | Unknown | SD |
| GLIPR2 | SNV | Missense_Mutation | novel | c.272N>C | p.Asn91Thr | p.N91T | Q9H4G4 | protein_coding | deleterious(0) | probably_damaging(0.972) | TCGA-DF-A2KN-01 | Endometrium | uterine corpus endometrioid carcinoma | Female | Unknown | I/II | Unknown | Unknown | SD |
| Page: 1 2 3 |
Top |
Related drugs of malignant transformation related genes |
| Identification of chemicals and drugs interact with genes involved in malignant transfromation |
| (DGIdb 4.0) |
| Entrez ID | Symbol | Category | Interaction Types | Drug Claim Name | Drug Name | PMIDs |
| Page: 1 |

Copyright 2023-Present -The University of Texas Health Science Center at Houston |