
|
|||||
|
 | |
| |
| |
| |
| |
| |
|
Gene: GLI4 |
Gene summary for GLI4 |
| Gene information | Species | Human | Gene symbol | GLI4 | Gene ID | 2738 |
| Gene name | GLI family zinc finger 4 | |
| Gene Alias | HKR4 | |
| Cytomap | 8q24.3 | |
| Gene Type | protein-coding | GO ID | GO:0006139 | UniProtAcc | P10075 |
Top |
Malignant transformation analysis |
| Identification of the aberrant gene expression in precancerous and cancerous lesions by comparing the gene expression of stem-like cells in diseased tissues with normal stem cells |
| Entrez ID | Symbol | Replicates | Species | Organ | Tissue | Adj P-value | Log2FC | Malignancy |
| 2738 | GLI4 | LZE20T | Human | Esophagus | ESCC | 4.46e-08 | 2.89e-01 | 0.0662 |
| 2738 | GLI4 | LZE24T | Human | Esophagus | ESCC | 2.14e-17 | 4.32e-01 | 0.0596 |
| 2738 | GLI4 | LZE21T | Human | Esophagus | ESCC | 1.06e-05 | 3.74e-01 | 0.0655 |
| 2738 | GLI4 | P1T-E | Human | Esophagus | ESCC | 7.83e-05 | 2.83e-01 | 0.0875 |
| 2738 | GLI4 | P2T-E | Human | Esophagus | ESCC | 9.53e-09 | 1.89e-01 | 0.1177 |
| 2738 | GLI4 | P4T-E | Human | Esophagus | ESCC | 7.95e-11 | 2.16e-01 | 0.1323 |
| 2738 | GLI4 | P5T-E | Human | Esophagus | ESCC | 6.62e-20 | 3.63e-01 | 0.1327 |
| 2738 | GLI4 | P8T-E | Human | Esophagus | ESCC | 3.89e-12 | 1.69e-01 | 0.0889 |
| 2738 | GLI4 | P9T-E | Human | Esophagus | ESCC | 9.66e-20 | 4.23e-01 | 0.1131 |
| 2738 | GLI4 | P10T-E | Human | Esophagus | ESCC | 1.13e-16 | 2.47e-01 | 0.116 |
| 2738 | GLI4 | P11T-E | Human | Esophagus | ESCC | 5.37e-11 | 3.76e-01 | 0.1426 |
| 2738 | GLI4 | P12T-E | Human | Esophagus | ESCC | 1.35e-25 | 3.52e-01 | 0.1122 |
| 2738 | GLI4 | P15T-E | Human | Esophagus | ESCC | 9.36e-27 | 5.48e-01 | 0.1149 |
| 2738 | GLI4 | P16T-E | Human | Esophagus | ESCC | 3.52e-19 | 3.98e-01 | 0.1153 |
| 2738 | GLI4 | P17T-E | Human | Esophagus | ESCC | 5.10e-03 | 1.78e-01 | 0.1278 |
| 2738 | GLI4 | P19T-E | Human | Esophagus | ESCC | 1.07e-02 | 2.70e-01 | 0.1662 |
| 2738 | GLI4 | P20T-E | Human | Esophagus | ESCC | 5.07e-18 | 3.29e-01 | 0.1124 |
| 2738 | GLI4 | P21T-E | Human | Esophagus | ESCC | 1.11e-17 | 3.33e-01 | 0.1617 |
| 2738 | GLI4 | P22T-E | Human | Esophagus | ESCC | 2.05e-07 | 1.48e-01 | 0.1236 |
| 2738 | GLI4 | P23T-E | Human | Esophagus | ESCC | 6.04e-27 | 5.69e-01 | 0.108 |
| Page: 1 2 3 4 5 |
| Tissue | Expression Dynamics | Abbreviation |
| Esophagus | 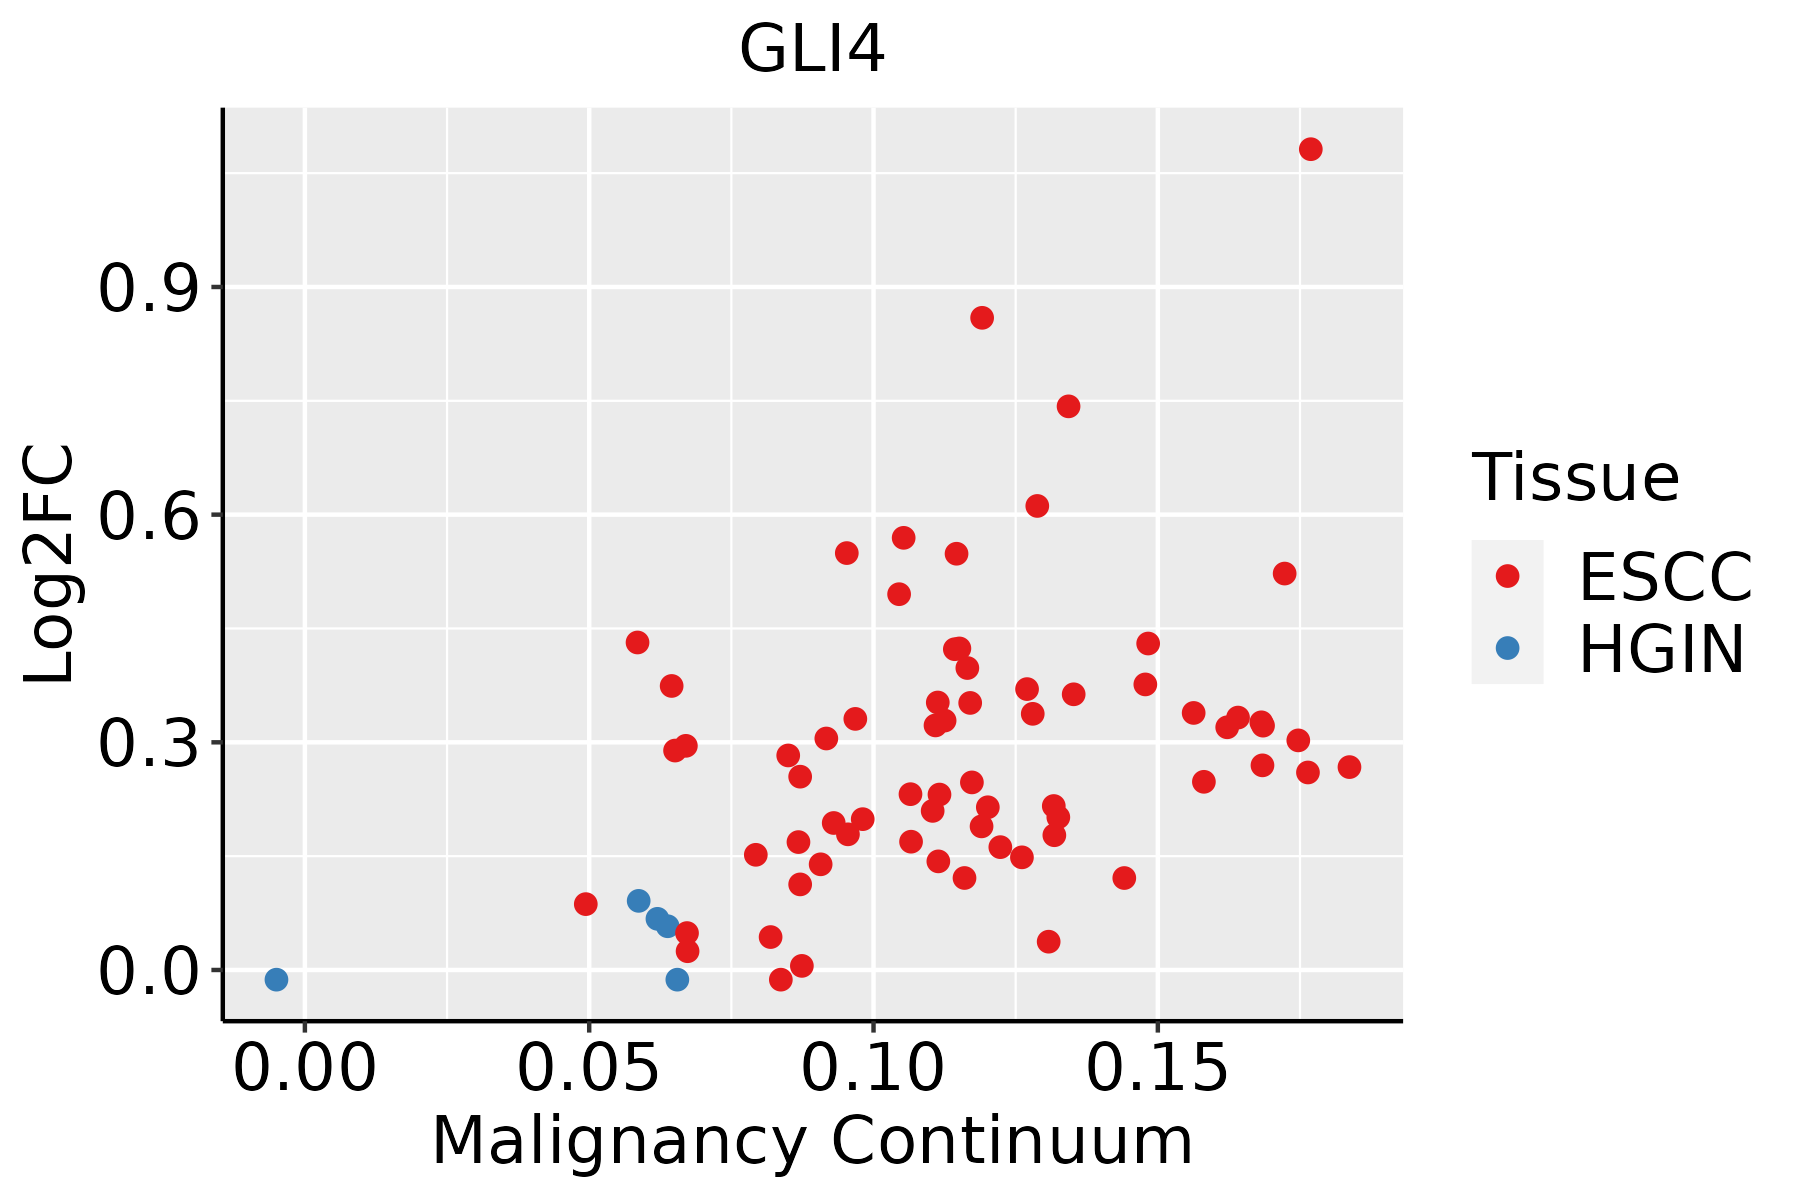 | ESCC: Esophageal squamous cell carcinoma |
| HGIN: High-grade intraepithelial neoplasias | ||
| LGIN: Low-grade intraepithelial neoplasias | ||
| Liver | 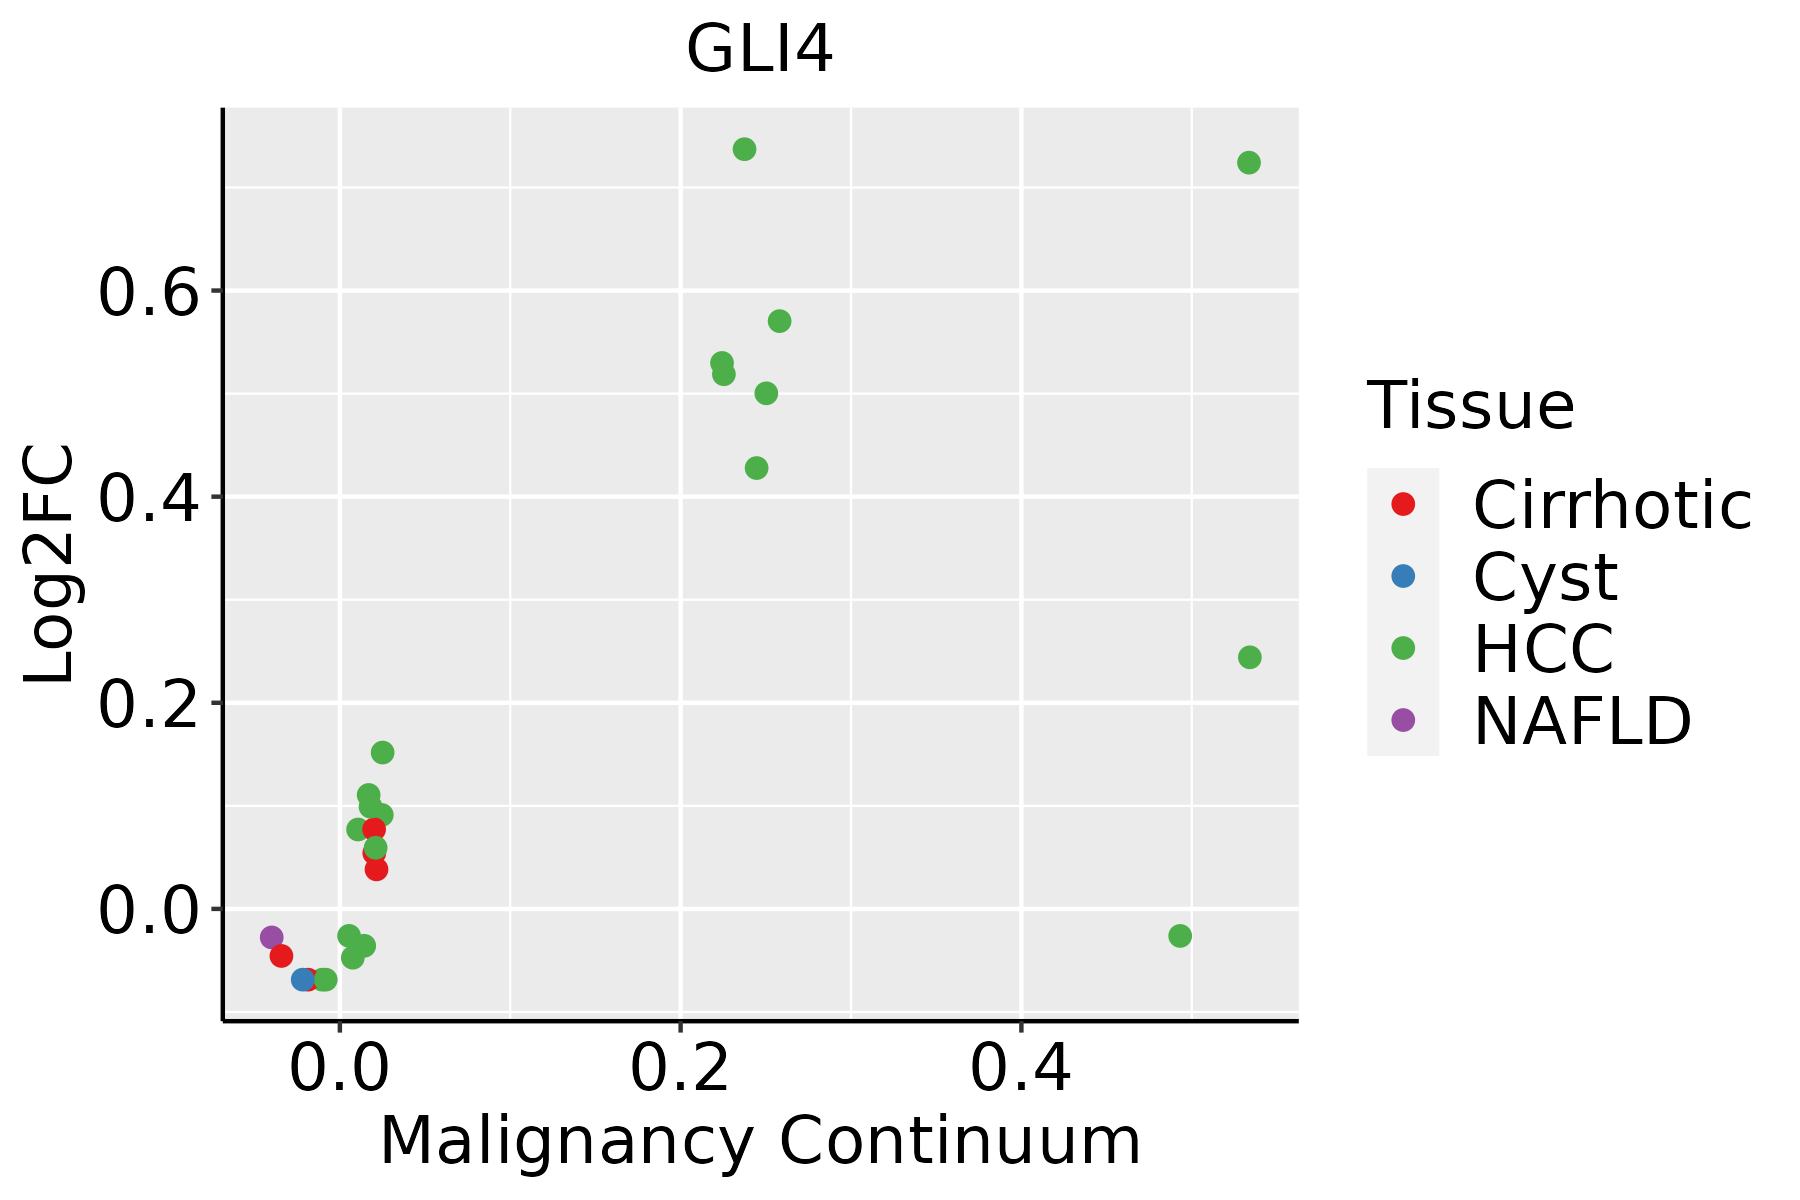 | HCC: Hepatocellular carcinoma |
| NAFLD: Non-alcoholic fatty liver disease | ||
| Oral Cavity |  | EOLP: Erosive Oral lichen planus |
| LP: leukoplakia | ||
| NEOLP: Non-erosive oral lichen planus | ||
| OSCC: Oral squamous cell carcinoma |
| ∗log2FC in expression of this searched gene in stem-like cells from each diseased tissue sample relative to stem-like cells in normal samples in each tissue plotted against the malignancy continuum. Samples are colored based on if they are from different disease stage. |
Top |
Malignant transformation related pathway analysis |
| Find out the enriched GO biological processes and KEGG pathways involved in transition from healthy to precancer to cancer |
| Tissue | Disease Stage | Enriched GO biological Processes |
| Colorectum | AD |  |
| Colorectum | SER |  |
| Colorectum | MSS |  |
| Colorectum | MSI-H |  |
| Colorectum | FAP |  |
| ∗Top 15 enriched GO BP terms are showed in the bar plot of each disease state in each tissue. Each row represents a significant GO biological process which is colored according to the -log10(p.adjust). |
| Page: 1 2 3 4 5 6 7 8 9 |
| GO ID | Tissue | Disease Stage | Description | Gene Ratio | Bg Ratio | pvalue | p.adjust | Count |
| Page: 1 |
| Pathway ID | Tissue | Disease Stage | Description | Gene Ratio | Bg Ratio | pvalue | p.adjust | qvalue | Count |
| Page: 1 |
Top |
Cell-cell communication analysis |
| Identification of potential cell-cell interactions between two cell types and their ligand-receptor pairs for different disease states |
| Ligand | Receptor | LRpair | Pathway | Tissue | Disease Stage |
| Page: 1 |
Top |
Single-cell gene regulatory network inference analysis |
| Find out the significant the regulons (TFs) and the target genes of each regulon across cell types for different disease states |
| TF | Cell Type | Tissue | Disease Stage | Target Gene | RSS | Regulon Activity |
| GLI4 | ICAF | Lung | ADJ | IL12RB2,PXDNL,AL138756.1, etc. | 0.00e+00 |  |
| GLI4 | ADIPO | Lung | Healthy | IL12RB2,PXDNL,AL138756.1, etc. | 1.06e-02 |  |
| GLI4 | MSC.MVA | Lung | Healthy | IL12RB2,PXDNL,AL138756.1, etc. | 1.44e-02 | |
| GLI4 | MYOFIB | Lung | Healthy | IL12RB2,PXDNL,AL138756.1, etc. | 0.00e+00 | |
| GLI4 | MEGA | Lung | IAC | IL12RB2,PXDNL,AL138756.1, etc. | 0.00e+00 |  |
| GLI4 | ICAF | Lung | IAC | IL12RB2,PXDNL,AL138756.1, etc. | 1.05e-03 | |
| ∗The dot plots of a searched regulon are shown for all cell subpopulations in each disease state of each tissue based on the regulon specific score inferred using pySCENIC and by calculating the average expression. |
| Page: 1 |
Top |
Somatic mutation of malignant transformation related genes |
| Annotation of somatic variants for genes involved in malignant transformation |
| Hugo Symbol | Variant Class | Variant Classification | dbSNP RS | HGVSc | HGVSp | HGVSp Short | SWISSPROT | BIOTYPE | SIFT | PolyPhen | Tumor Sample Barcode | Tissue | Histology | Sex | Age | Stage | Therapy Types | Drugs | Outcome |
| GLI4 | SNV | Missense_Mutation | novel | c.556N>A | p.Glu186Lys | p.E186K | P10075 | protein_coding | tolerated(0.1) | benign(0.012) | TCGA-A7-A4SB-01 | Breast | breast invasive carcinoma | Female | <65 | III/IV | Chemotherapy | docetaxel | CR |
| GLI4 | SNV | Missense_Mutation | c.97N>G | p.Gln33Glu | p.Q33E | P10075 | protein_coding | tolerated(0.23) | benign(0.003) | TCGA-AC-A23H-01 | Breast | breast invasive carcinoma | Female | >=65 | I/II | Unknown | Unknown | PD | |
| GLI4 | SNV | Missense_Mutation | c.643G>A | p.Glu215Lys | p.E215K | P10075 | protein_coding | deleterious(0.01) | possibly_damaging(0.648) | TCGA-BH-A0BC-01 | Breast | breast invasive carcinoma | Female | <65 | III/IV | Chemotherapy | doxorubicin | SD | |
| GLI4 | SNV | Missense_Mutation | c.685N>G | p.His229Asp | p.H229D | P10075 | protein_coding | deleterious(0) | probably_damaging(0.999) | TCGA-D8-A1X7-01 | Breast | breast invasive carcinoma | Female | <65 | I/II | ChemotherapyHormone Therapy | doxorubicine+cyclophosphamide+tamoxifen | SD | |
| GLI4 | SNV | Missense_Mutation | novel | c.670T>G | p.Ser224Ala | p.S224A | P10075 | protein_coding | tolerated(0.11) | benign(0.388) | TCGA-EW-A1P7-01 | Breast | breast invasive carcinoma | Female | <65 | I/II | Chemotherapy | carboplatin | PD |
| GLI4 | deletion | Frame_Shift_Del | novel | c.565_575delGGCAAGAGTTT | p.Gly189GlnfsTer3 | p.G189Qfs*3 | P10075 | protein_coding | TCGA-AC-A8OQ-01 | Breast | breast invasive carcinoma | Female | >=65 | I/II | Unknown | Unknown | SD | ||
| GLI4 | SNV | Missense_Mutation | c.608N>A | p.Arg203His | p.R203H | P10075 | protein_coding | deleterious(0) | probably_damaging(0.999) | TCGA-VS-A94Z-01 | Cervix | cervical & endocervical cancer | Female | <65 | I/II | Chemotherapy | cisplatin | CR | |
| GLI4 | SNV | Missense_Mutation | c.65N>T | p.Pro22Leu | p.P22L | P10075 | protein_coding | deleterious(0.03) | benign(0.003) | TCGA-5M-AAT6-01 | Colorectum | colon adenocarcinoma | Female | <65 | III/IV | Unknown | Unknown | PD | |
| GLI4 | SNV | Missense_Mutation | c.950N>G | p.His317Arg | p.H317R | P10075 | protein_coding | deleterious(0) | probably_damaging(0.996) | TCGA-AD-5900-01 | Colorectum | colon adenocarcinoma | Male | >=65 | I/II | Unknown | Unknown | SD | |
| GLI4 | SNV | Missense_Mutation | novel | c.61N>G | p.Ser21Ala | p.S21A | P10075 | protein_coding | tolerated(0.28) | probably_damaging(0.952) | TCGA-CA-6717-01 | Colorectum | colon adenocarcinoma | Male | <65 | I/II | Chemotherapy | oxaliplatin | CR |
| Page: 1 2 3 4 |
Top |
Related drugs of malignant transformation related genes |
| Identification of chemicals and drugs interact with genes involved in malignant transfromation |
| (DGIdb 4.0) |
| Entrez ID | Symbol | Category | Interaction Types | Drug Claim Name | Drug Name | PMIDs |
| Page: 1 |

Copyright 2023-Present -The University of Texas Health Science Center at Houston |