
|
|||||
|
 | |
| |
| |
| |
| |
| |
|
Gene: GLI3 |
Gene summary for GLI3 |
| Gene information | Species | Human | Gene symbol | GLI3 | Gene ID | 2737 |
| Gene name | GLI family zinc finger 3 | |
| Gene Alias | ACLS | |
| Cytomap | 7p14.1 | |
| Gene Type | protein-coding | GO ID | GO:0000003 | UniProtAcc | P10071 |
Top |
Malignant transformation analysis |
| Identification of the aberrant gene expression in precancerous and cancerous lesions by comparing the gene expression of stem-like cells in diseased tissues with normal stem cells |
| Entrez ID | Symbol | Replicates | Species | Organ | Tissue | Adj P-value | Log2FC | Malignancy |
| 2737 | GLI3 | LZE24T | Human | Esophagus | ESCC | 2.92e-14 | 1.91e-01 | 0.0596 |
| 2737 | GLI3 | P2T-E | Human | Esophagus | ESCC | 2.78e-07 | 1.25e-01 | 0.1177 |
| 2737 | GLI3 | P4T-E | Human | Esophagus | ESCC | 1.80e-06 | 1.15e-01 | 0.1323 |
| 2737 | GLI3 | P5T-E | Human | Esophagus | ESCC | 4.39e-04 | 2.19e-02 | 0.1327 |
| 2737 | GLI3 | P8T-E | Human | Esophagus | ESCC | 9.10e-09 | 1.40e-01 | 0.0889 |
| 2737 | GLI3 | P9T-E | Human | Esophagus | ESCC | 2.15e-04 | 1.01e-01 | 0.1131 |
| 2737 | GLI3 | P10T-E | Human | Esophagus | ESCC | 5.79e-19 | 3.72e-01 | 0.116 |
| 2737 | GLI3 | P11T-E | Human | Esophagus | ESCC | 2.76e-12 | 3.93e-01 | 0.1426 |
| 2737 | GLI3 | P12T-E | Human | Esophagus | ESCC | 4.74e-17 | 2.04e-01 | 0.1122 |
| 2737 | GLI3 | P15T-E | Human | Esophagus | ESCC | 6.99e-09 | 1.77e-01 | 0.1149 |
| 2737 | GLI3 | P16T-E | Human | Esophagus | ESCC | 7.27e-20 | 1.12e-01 | 0.1153 |
| 2737 | GLI3 | P17T-E | Human | Esophagus | ESCC | 3.43e-03 | 1.59e-01 | 0.1278 |
| 2737 | GLI3 | P21T-E | Human | Esophagus | ESCC | 1.80e-11 | 1.03e-01 | 0.1617 |
| 2737 | GLI3 | P22T-E | Human | Esophagus | ESCC | 2.36e-12 | 5.44e-02 | 0.1236 |
| 2737 | GLI3 | P23T-E | Human | Esophagus | ESCC | 2.96e-13 | 1.59e-01 | 0.108 |
| 2737 | GLI3 | P24T-E | Human | Esophagus | ESCC | 3.69e-09 | 1.79e-01 | 0.1287 |
| 2737 | GLI3 | P26T-E | Human | Esophagus | ESCC | 5.76e-10 | 1.22e-01 | 0.1276 |
| 2737 | GLI3 | P27T-E | Human | Esophagus | ESCC | 1.34e-13 | 1.85e-01 | 0.1055 |
| 2737 | GLI3 | P28T-E | Human | Esophagus | ESCC | 5.22e-14 | 7.62e-02 | 0.1149 |
| 2737 | GLI3 | P30T-E | Human | Esophagus | ESCC | 3.18e-08 | 2.07e-01 | 0.137 |
| Page: 1 2 3 4 |
| Tissue | Expression Dynamics | Abbreviation |
| Esophagus | 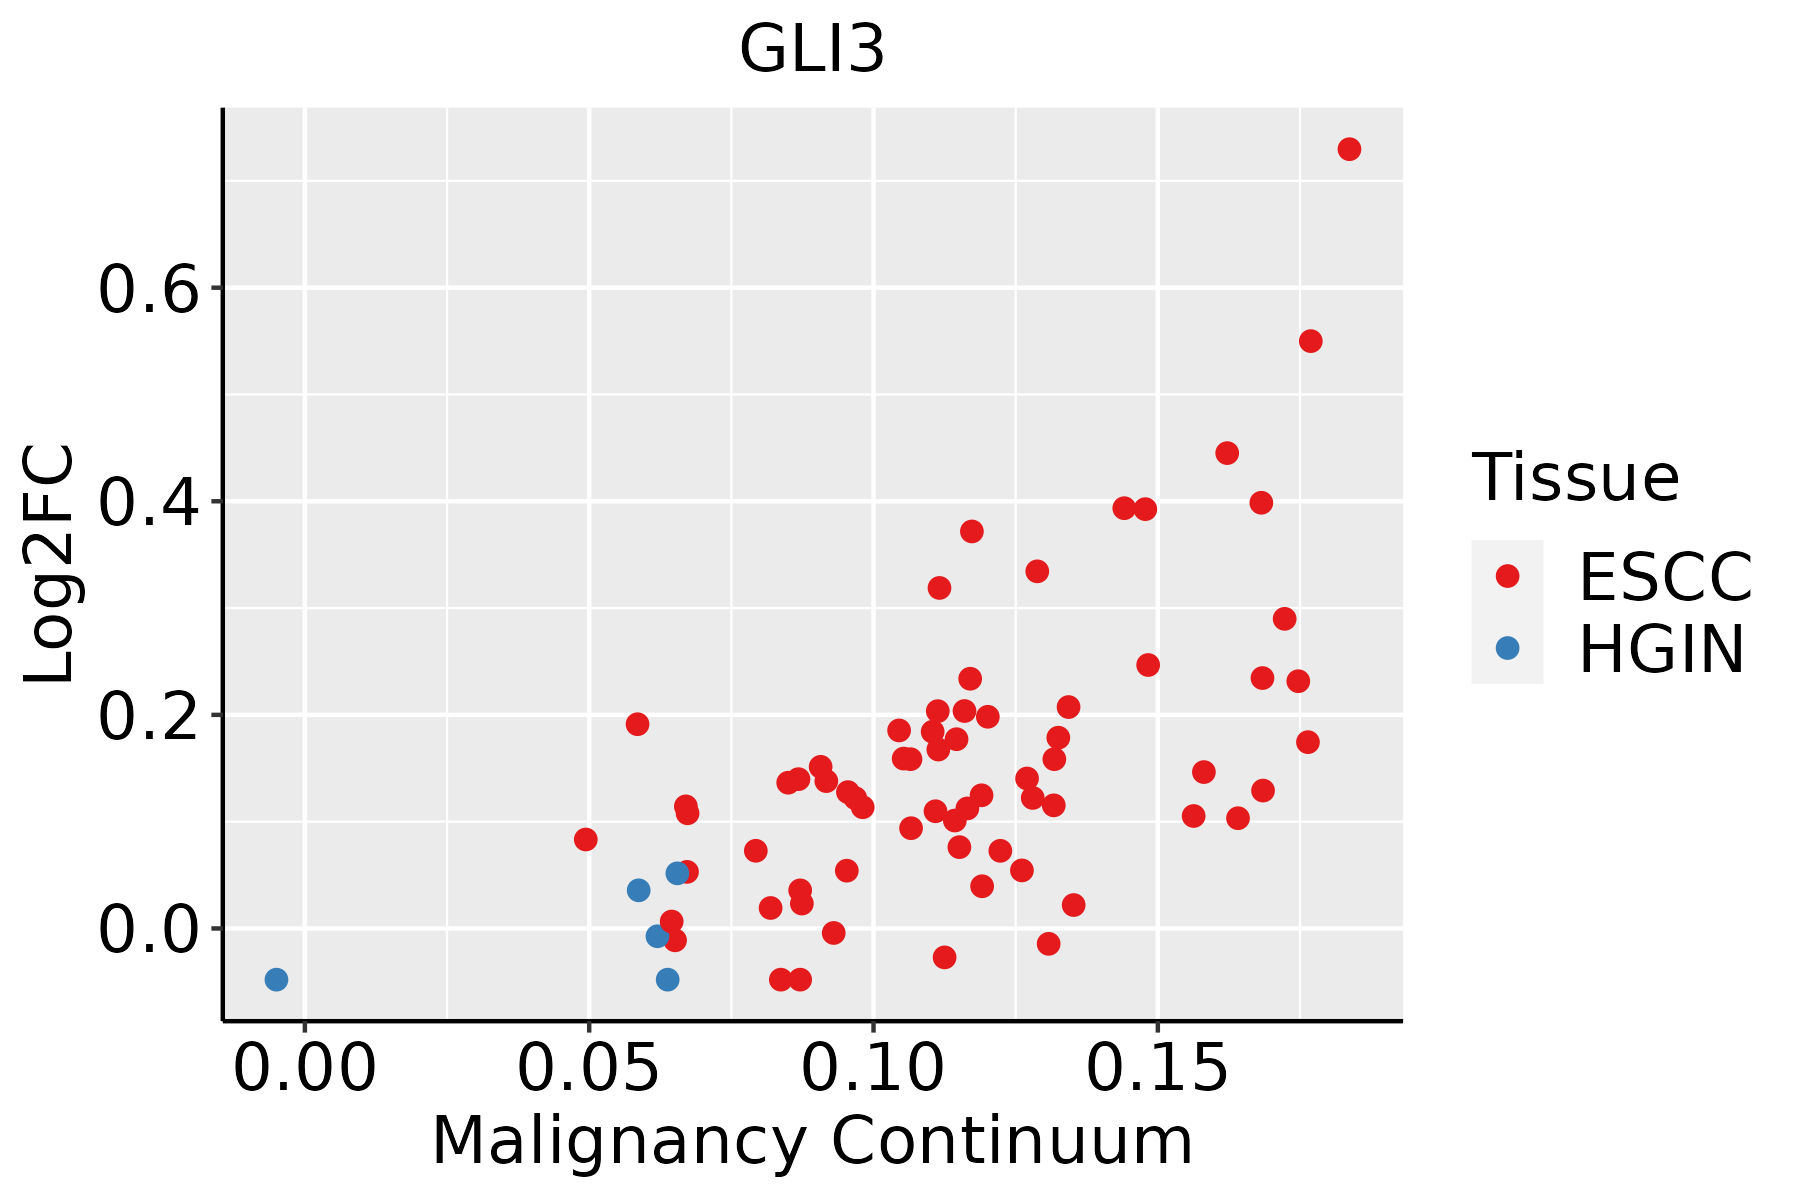 | ESCC: Esophageal squamous cell carcinoma |
| HGIN: High-grade intraepithelial neoplasias | ||
| LGIN: Low-grade intraepithelial neoplasias | ||
| Skin | 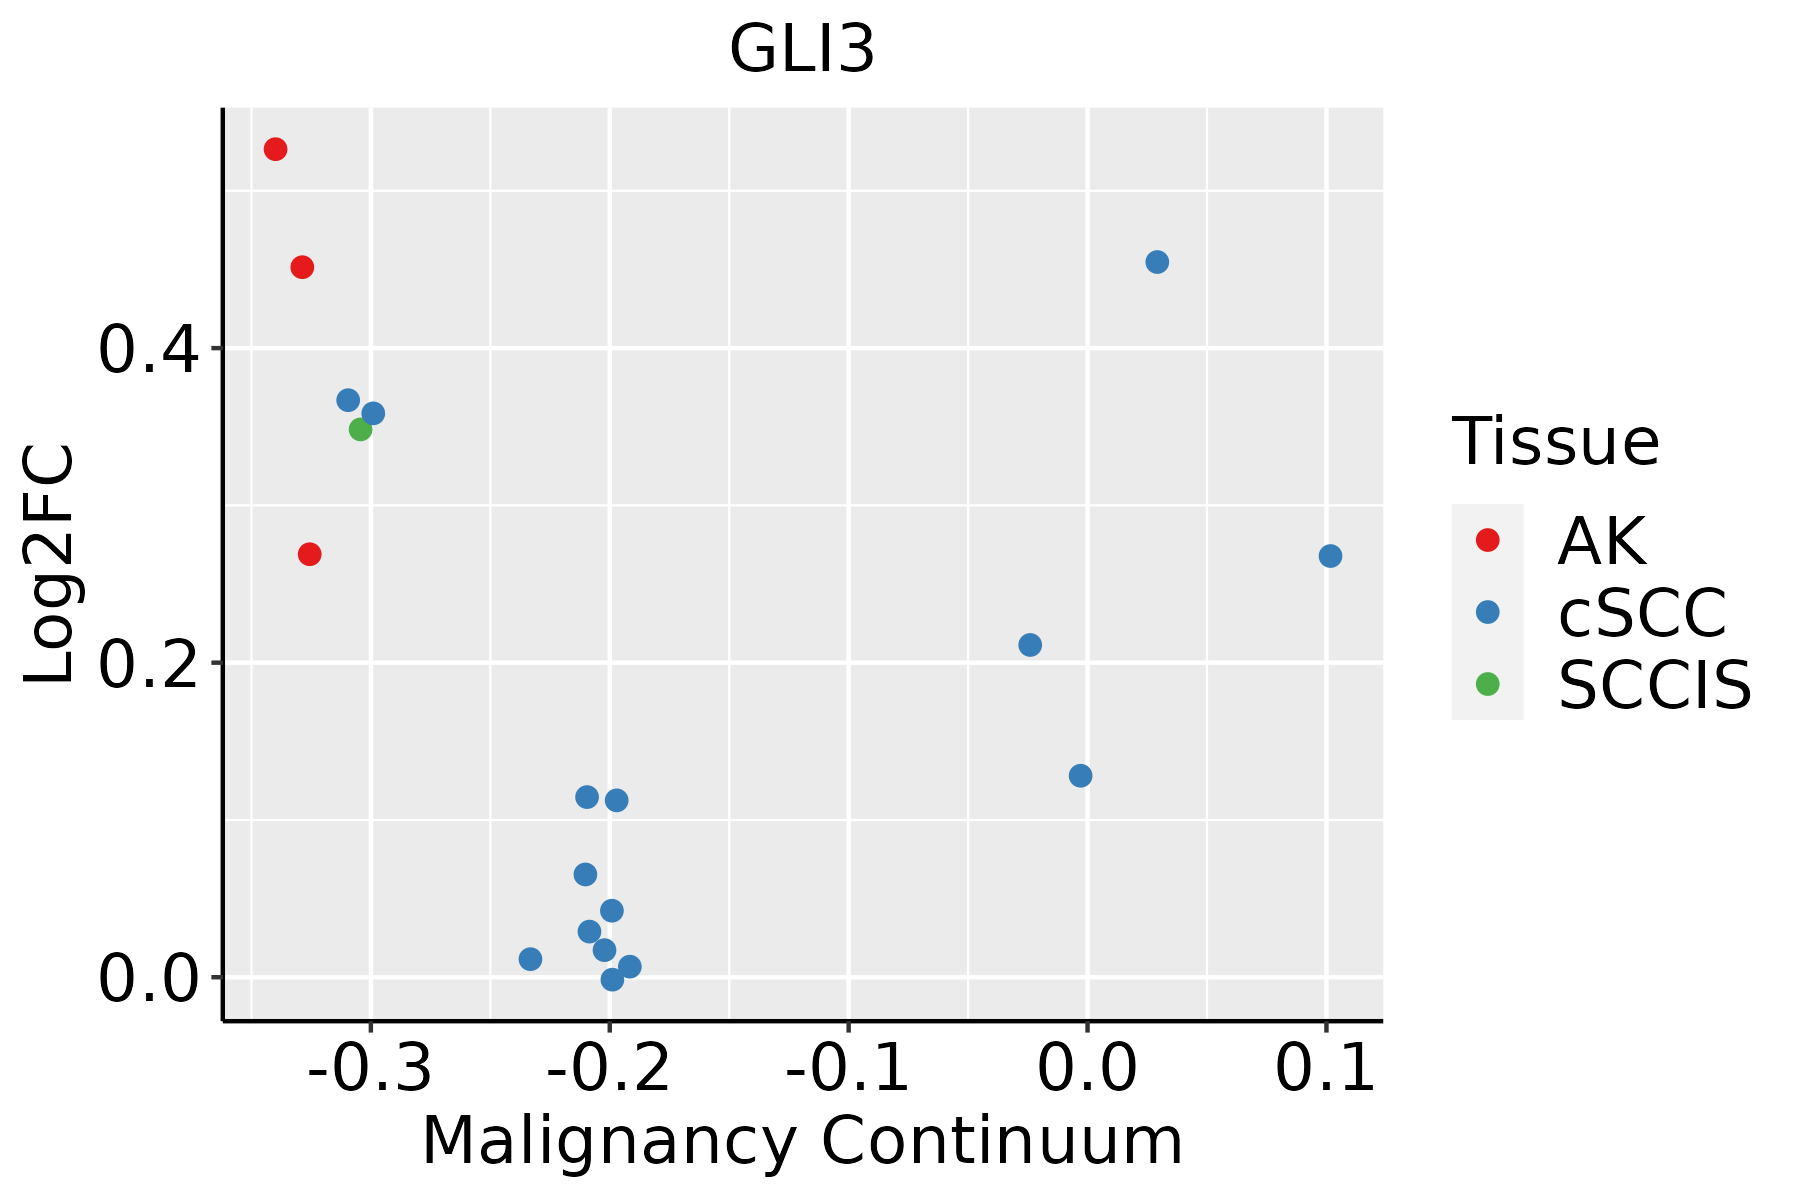 | AK: Actinic keratosis |
| cSCC: Cutaneous squamous cell carcinoma | ||
| SCCIS:squamous cell carcinoma in situ | ||
| Thyroid |  | ATC: Anaplastic thyroid cancer |
| HT: Hashimoto's thyroiditis | ||
| PTC: Papillary thyroid cancer |
| ∗log2FC in expression of this searched gene in stem-like cells from each diseased tissue sample relative to stem-like cells in normal samples in each tissue plotted against the malignancy continuum. Samples are colored based on if they are from different disease stage. |
Top |
Malignant transformation related pathway analysis |
| Find out the enriched GO biological processes and KEGG pathways involved in transition from healthy to precancer to cancer |
| Tissue | Disease Stage | Enriched GO biological Processes |
| Colorectum | AD |  |
| Colorectum | SER |  |
| Colorectum | MSS |  |
| Colorectum | MSI-H |  |
| Colorectum | FAP |  |
| ∗Top 15 enriched GO BP terms are showed in the bar plot of each disease state in each tissue. Each row represents a significant GO biological process which is colored according to the -log10(p.adjust). |
| Page: 1 2 3 4 5 6 7 8 9 |
| GO ID | Tissue | Disease Stage | Description | Gene Ratio | Bg Ratio | pvalue | p.adjust | Count |
| GO:0072594110 | Esophagus | ESCC | establishment of protein localization to organelle | 311/8552 | 422/18723 | 3.02e-32 | 2.13e-29 | 311 |
| GO:0006913110 | Esophagus | ESCC | nucleocytoplasmic transport | 230/8552 | 301/18723 | 6.04e-28 | 2.02e-25 | 230 |
| GO:0051169110 | Esophagus | ESCC | nuclear transport | 230/8552 | 301/18723 | 6.04e-28 | 2.02e-25 | 230 |
| GO:003238618 | Esophagus | ESCC | regulation of intracellular transport | 243/8552 | 337/18723 | 3.20e-23 | 7.25e-21 | 243 |
| GO:003450418 | Esophagus | ESCC | protein localization to nucleus | 211/8552 | 290/18723 | 4.06e-21 | 6.60e-19 | 211 |
| GO:1903829111 | Esophagus | ESCC | positive regulation of cellular protein localization | 199/8552 | 276/18723 | 2.99e-19 | 3.45e-17 | 199 |
| GO:0033157110 | Esophagus | ESCC | regulation of intracellular protein transport | 169/8552 | 229/18723 | 3.31e-18 | 3.23e-16 | 169 |
| GO:0032388110 | Esophagus | ESCC | positive regulation of intracellular transport | 152/8552 | 202/18723 | 7.89e-18 | 7.36e-16 | 152 |
| GO:000170119 | Esophagus | ESCC | in utero embryonic development | 243/8552 | 367/18723 | 1.00e-15 | 6.86e-14 | 243 |
| GO:1904951111 | Esophagus | ESCC | positive regulation of establishment of protein localization | 216/8552 | 319/18723 | 1.01e-15 | 6.86e-14 | 216 |
| GO:0046822110 | Esophagus | ESCC | regulation of nucleocytoplasmic transport | 88/8552 | 106/18723 | 1.88e-15 | 1.19e-13 | 88 |
| GO:009031617 | Esophagus | ESCC | positive regulation of intracellular protein transport | 122/8552 | 160/18723 | 2.45e-15 | 1.49e-13 | 122 |
| GO:001703818 | Esophagus | ESCC | protein import | 149/8552 | 206/18723 | 5.90e-15 | 3.31e-13 | 149 |
| GO:0051222111 | Esophagus | ESCC | positive regulation of protein transport | 204/8552 | 303/18723 | 1.56e-14 | 8.38e-13 | 204 |
| GO:190018018 | Esophagus | ESCC | regulation of protein localization to nucleus | 102/8552 | 136/18723 | 2.84e-12 | 1.13e-10 | 102 |
| GO:0048732111 | Esophagus | ESCC | gland development | 269/8552 | 436/18723 | 7.81e-12 | 2.95e-10 | 269 |
| GO:190018217 | Esophagus | ESCC | positive regulation of protein localization to nucleus | 70/8552 | 87/18723 | 2.63e-11 | 8.99e-10 | 70 |
| GO:005160418 | Esophagus | ESCC | protein maturation | 189/8552 | 294/18723 | 7.64e-11 | 2.39e-09 | 189 |
| GO:001605517 | Esophagus | ESCC | Wnt signaling pathway | 268/8552 | 444/18723 | 2.32e-10 | 6.58e-09 | 268 |
| GO:019873817 | Esophagus | ESCC | cell-cell signaling by wnt | 269/8552 | 446/18723 | 2.41e-10 | 6.79e-09 | 269 |
| Page: 1 2 3 4 5 6 7 8 9 10 11 12 13 14 15 16 17 18 19 20 21 22 23 24 25 26 27 28 |
| Pathway ID | Tissue | Disease Stage | Description | Gene Ratio | Bg Ratio | pvalue | p.adjust | qvalue | Count |
| Page: 1 |
Top |
Cell-cell communication analysis |
| Identification of potential cell-cell interactions between two cell types and their ligand-receptor pairs for different disease states |
| Ligand | Receptor | LRpair | Pathway | Tissue | Disease Stage |
| Page: 1 |
Top |
Single-cell gene regulatory network inference analysis |
| Find out the significant the regulons (TFs) and the target genes of each regulon across cell types for different disease states |
| TF | Cell Type | Tissue | Disease Stage | Target Gene | RSS | Regulon Activity |
| ∗The dot plots of a searched regulon are shown for all cell subpopulations in each disease state of each tissue based on the regulon specific score inferred using pySCENIC and by calculating the average expression. |
| Page: 1 |
Top |
Somatic mutation of malignant transformation related genes |
| Annotation of somatic variants for genes involved in malignant transformation |
| Hugo Symbol | Variant Class | Variant Classification | dbSNP RS | HGVSc | HGVSp | HGVSp Short | SWISSPROT | BIOTYPE | SIFT | PolyPhen | Tumor Sample Barcode | Tissue | Histology | Sex | Age | Stage | Therapy Types | Drugs | Outcome |
| GLI3 | SNV | Missense_Mutation | c.1620C>A | p.His540Gln | p.H540Q | P10071 | protein_coding | deleterious(0) | probably_damaging(1) | TCGA-A8-A09Z-01 | Breast | breast invasive carcinoma | Female | >=65 | I/II | Unknown | Unknown | SD | |
| GLI3 | SNV | Missense_Mutation | novel | c.3213N>C | p.Glu1071Asp | p.E1071D | P10071 | protein_coding | deleterious(0) | probably_damaging(0.998) | TCGA-AC-A23H-01 | Breast | breast invasive carcinoma | Female | >=65 | I/II | Unknown | Unknown | PD |
| GLI3 | SNV | Missense_Mutation | c.2308N>C | p.Ala770Pro | p.A770P | P10071 | protein_coding | tolerated(0.08) | benign(0.007) | TCGA-B6-A0IM-01 | Breast | breast invasive carcinoma | Female | >=65 | I/II | Unknown | Unknown | SD | |
| GLI3 | SNV | Missense_Mutation | c.3437T>G | p.Leu1146Arg | p.L1146R | P10071 | protein_coding | deleterious(0.04) | benign(0.014) | TCGA-BH-A203-01 | Breast | breast invasive carcinoma | Female | >=65 | I/II | Unknown | Unknown | PD | |
| GLI3 | SNV | Missense_Mutation | novel | c.1763C>T | p.Ser588Leu | p.S588L | P10071 | protein_coding | deleterious(0) | probably_damaging(0.995) | TCGA-BH-A2L8-01 | Breast | breast invasive carcinoma | Female | <65 | I/II | Chemotherapy | cytoxan | CR |
| GLI3 | SNV | Missense_Mutation | c.2422N>C | p.Ile808Leu | p.I808L | P10071 | protein_coding | tolerated(0.55) | benign(0.065) | TCGA-D8-A1XQ-01 | Breast | breast invasive carcinoma | Female | >=65 | I/II | Unknown | Unknown | SD | |
| GLI3 | SNV | Missense_Mutation | c.1336N>T | p.Pro446Ser | p.P446S | P10071 | protein_coding | deleterious(0.04) | benign(0.336) | TCGA-E2-A14P-01 | Breast | breast invasive carcinoma | Female | >=65 | III/IV | Targeted Molecular therapy | trastuzumab | SD | |
| GLI3 | SNV | Missense_Mutation | c.1154N>T | p.Pro385Leu | p.P385L | P10071 | protein_coding | deleterious(0.02) | benign(0.099) | TCGA-GM-A2DO-01 | Breast | breast invasive carcinoma | Female | <65 | I/II | Hormone Therapy | tamoxiphen | CR | |
| GLI3 | insertion | Frame_Shift_Ins | novel | c.4513_4514insTATGTATTTTAGCAATCTCATCTCACCTAACTGAGATGTGTTTC | p.Asp1505ValfsTer21 | p.D1505Vfs*21 | P10071 | protein_coding | TCGA-A2-A0EM-01 | Breast | breast invasive carcinoma | Female | >=65 | I/II | Hormone Therapy | tamoxiphen | SD | ||
| GLI3 | insertion | Nonsense_Mutation | novel | c.767_768insTGTTTTAACAGGTTTTACATTTTTGCCTTAAATGATTGTTTGC | p.Ser257ValfsTer10 | p.S257Vfs*10 | P10071 | protein_coding | TCGA-A7-A0D9-01 | Breast | breast invasive carcinoma | Female | <65 | I/II | Chemotherapy | taxotere | SD |
| Page: 1 2 3 4 5 6 7 8 9 10 11 12 13 14 15 16 17 18 19 20 21 22 23 24 25 26 27 28 29 30 31 32 |
Top |
Related drugs of malignant transformation related genes |
| Identification of chemicals and drugs interact with genes involved in malignant transfromation |
| (DGIdb 4.0) |
| Entrez ID | Symbol | Category | Interaction Types | Drug Claim Name | Drug Name | PMIDs |
| Page: 1 |

Copyright 2023-Present -The University of Texas Health Science Center at Houston |