
|
|||||
|
 | |
| |
| |
| |
| |
| |
|
Gene: GLI2 |
Gene summary for GLI2 |
| Gene information | Species | Human | Gene symbol | GLI2 | Gene ID | 2736 |
| Gene name | GLI family zinc finger 2 | |
| Gene Alias | CJS | |
| Cytomap | 2q14.2 | |
| Gene Type | protein-coding | GO ID | GO:0000003 | UniProtAcc | P10070 |
Top |
Malignant transformation analysis |
| Identification of the aberrant gene expression in precancerous and cancerous lesions by comparing the gene expression of stem-like cells in diseased tissues with normal stem cells |
| Entrez ID | Symbol | Replicates | Species | Organ | Tissue | Adj P-value | Log2FC | Malignancy |
| 2736 | GLI2 | LZE4T | Human | Esophagus | ESCC | 1.70e-03 | 1.39e-01 | 0.0811 |
| 2736 | GLI2 | LZE7T | Human | Esophagus | ESCC | 1.02e-03 | 1.75e-01 | 0.0667 |
| 2736 | GLI2 | P2T-E | Human | Esophagus | ESCC | 3.75e-03 | 1.07e-01 | 0.1177 |
| 2736 | GLI2 | P4T-E | Human | Esophagus | ESCC | 2.90e-03 | 1.13e-01 | 0.1323 |
| 2736 | GLI2 | P9T-E | Human | Esophagus | ESCC | 1.23e-14 | 3.71e-01 | 0.1131 |
| 2736 | GLI2 | P10T-E | Human | Esophagus | ESCC | 1.11e-79 | 1.61e+00 | 0.116 |
| 2736 | GLI2 | P11T-E | Human | Esophagus | ESCC | 2.46e-02 | 1.60e-01 | 0.1426 |
| 2736 | GLI2 | P12T-E | Human | Esophagus | ESCC | 2.56e-16 | 3.70e-01 | 0.1122 |
| 2736 | GLI2 | P15T-E | Human | Esophagus | ESCC | 3.20e-25 | 5.19e-01 | 0.1149 |
| 2736 | GLI2 | P21T-E | Human | Esophagus | ESCC | 7.90e-03 | 1.01e-01 | 0.1617 |
| 2736 | GLI2 | P22T-E | Human | Esophagus | ESCC | 5.30e-21 | 3.91e-01 | 0.1236 |
| 2736 | GLI2 | P28T-E | Human | Esophagus | ESCC | 1.76e-12 | 2.54e-01 | 0.1149 |
| 2736 | GLI2 | P30T-E | Human | Esophagus | ESCC | 2.19e-27 | 8.07e-01 | 0.137 |
| 2736 | GLI2 | P31T-E | Human | Esophagus | ESCC | 7.90e-03 | 9.15e-02 | 0.1251 |
| 2736 | GLI2 | P42T-E | Human | Esophagus | ESCC | 7.97e-06 | 1.83e-01 | 0.1175 |
| 2736 | GLI2 | P48T-E | Human | Esophagus | ESCC | 9.20e-06 | 1.89e-01 | 0.0959 |
| 2736 | GLI2 | P49T-E | Human | Esophagus | ESCC | 5.57e-05 | 4.61e-01 | 0.1768 |
| 2736 | GLI2 | P52T-E | Human | Esophagus | ESCC | 9.20e-06 | 1.38e-01 | 0.1555 |
| 2736 | GLI2 | P83T-E | Human | Esophagus | ESCC | 9.80e-07 | 2.03e-01 | 0.1738 |
| 2736 | GLI2 | P107T-E | Human | Esophagus | ESCC | 2.94e-10 | 2.32e-01 | 0.171 |
| Page: 1 2 |
| Tissue | Expression Dynamics | Abbreviation |
| Esophagus | 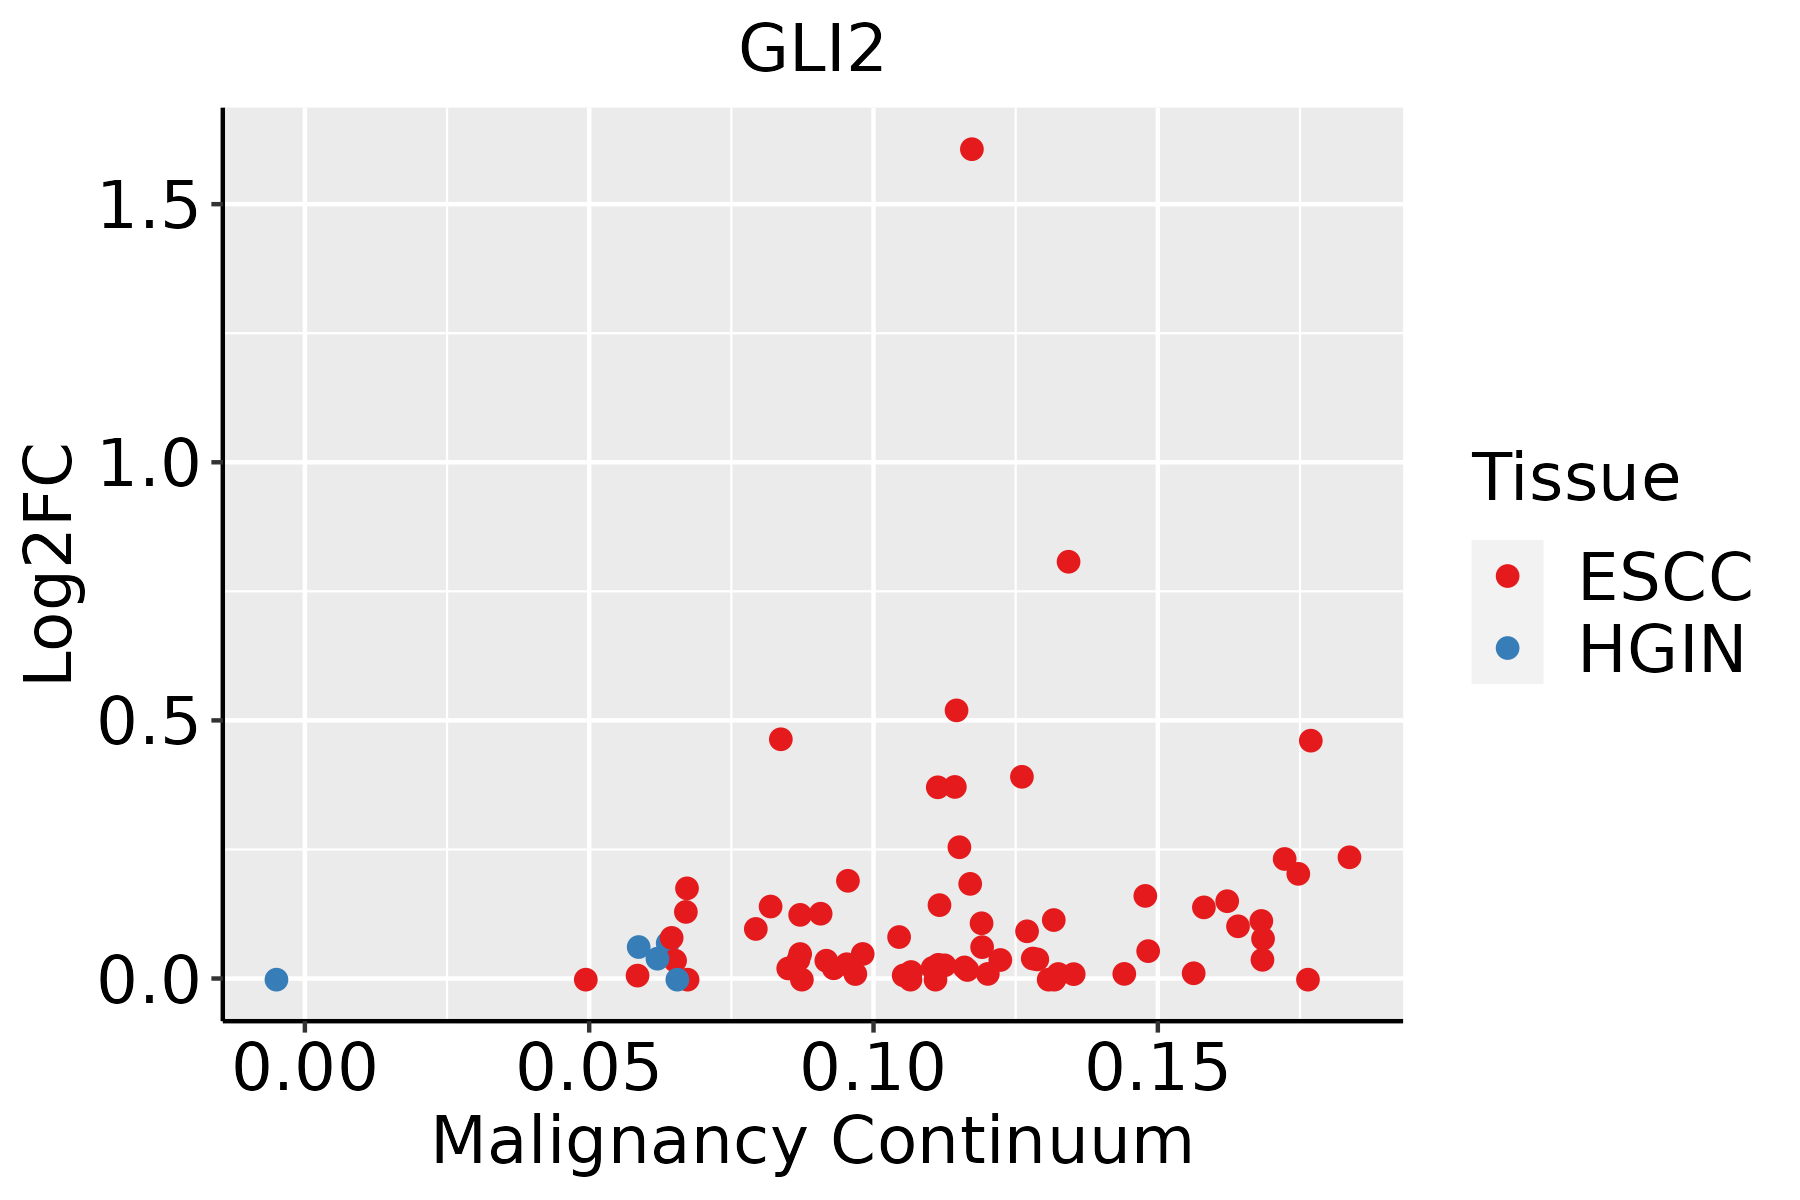 | ESCC: Esophageal squamous cell carcinoma |
| HGIN: High-grade intraepithelial neoplasias | ||
| LGIN: Low-grade intraepithelial neoplasias | ||
| Thyroid | 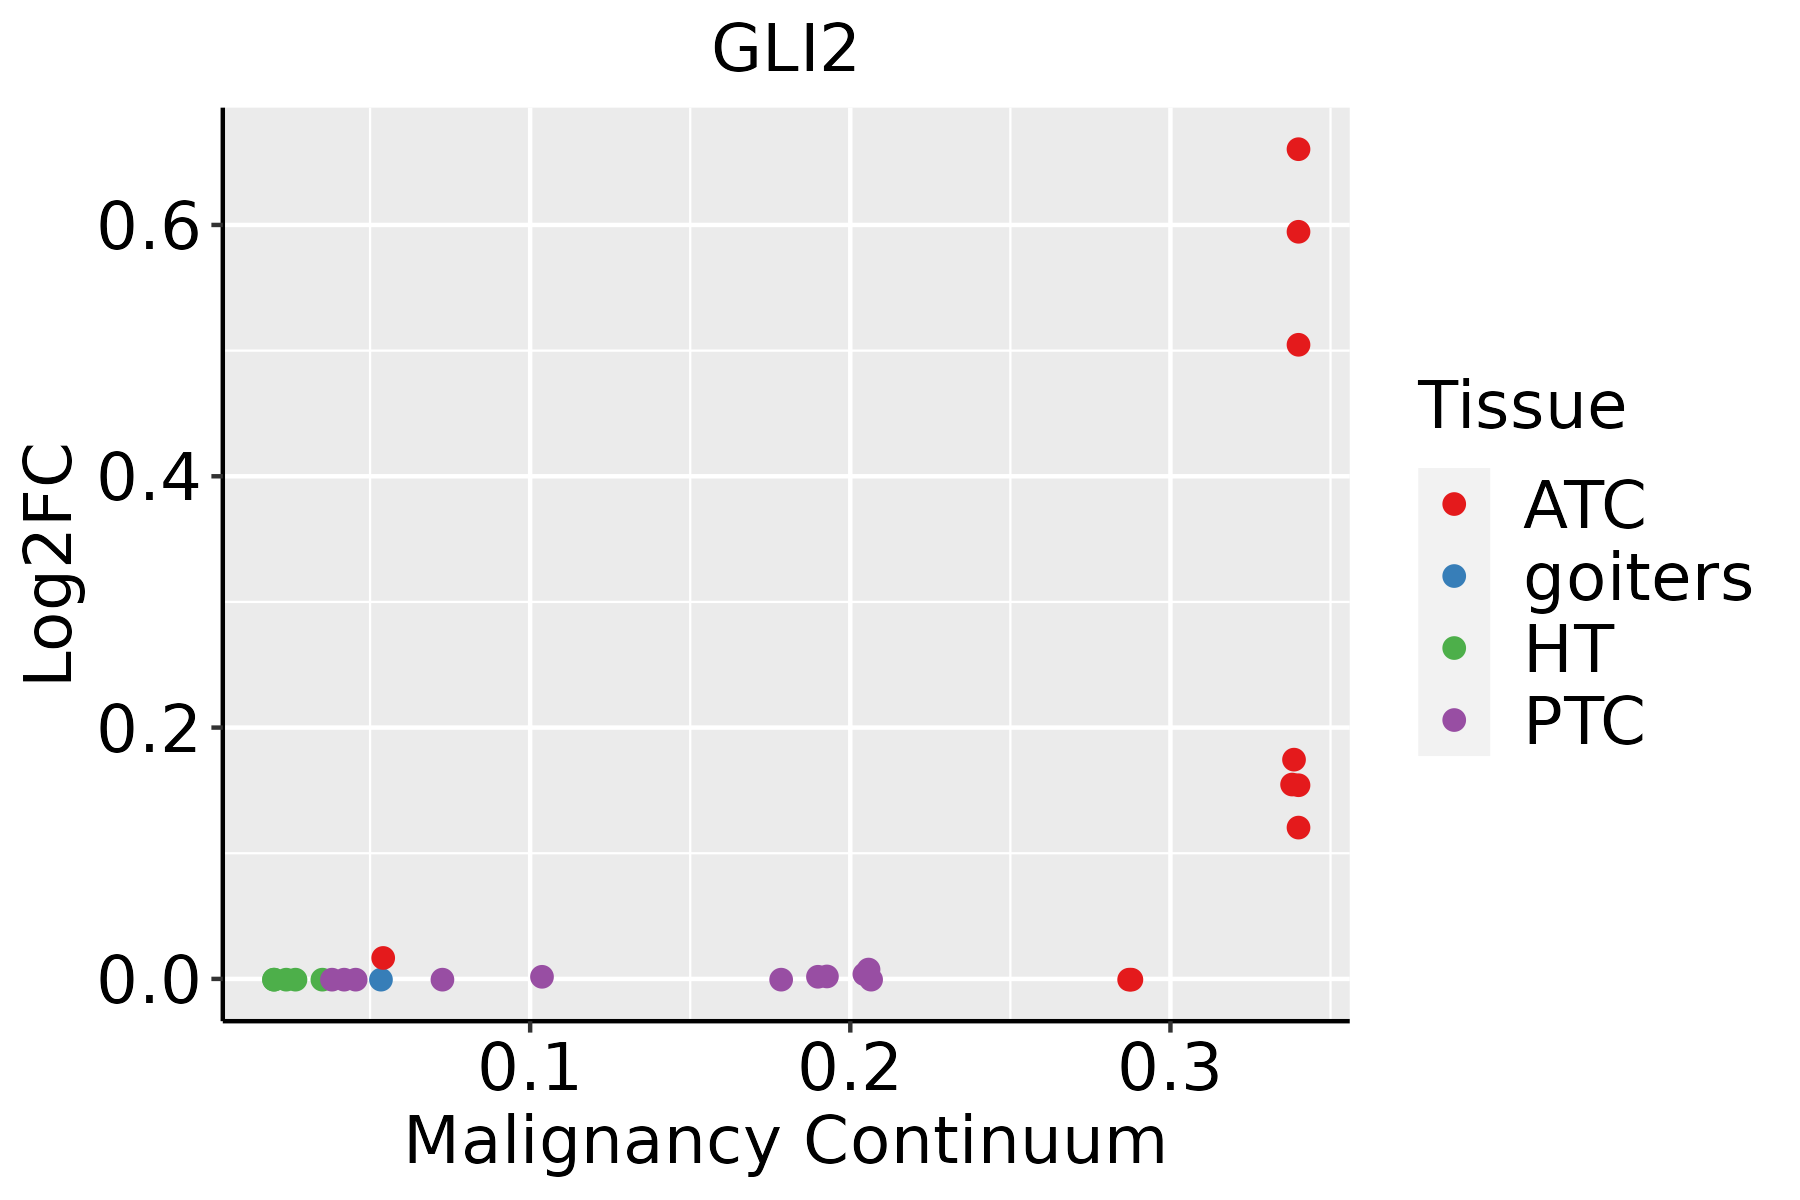 | ATC: Anaplastic thyroid cancer |
| HT: Hashimoto's thyroiditis | ||
| PTC: Papillary thyroid cancer |
| ∗log2FC in expression of this searched gene in stem-like cells from each diseased tissue sample relative to stem-like cells in normal samples in each tissue plotted against the malignancy continuum. Samples are colored based on if they are from different disease stage. |
Top |
Malignant transformation related pathway analysis |
| Find out the enriched GO biological processes and KEGG pathways involved in transition from healthy to precancer to cancer |
| Tissue | Disease Stage | Enriched GO biological Processes |
| Colorectum | AD |  |
| Colorectum | SER |  |
| Colorectum | MSS |  |
| Colorectum | MSI-H |  |
| Colorectum | FAP |  |
| ∗Top 15 enriched GO BP terms are showed in the bar plot of each disease state in each tissue. Each row represents a significant GO biological process which is colored according to the -log10(p.adjust). |
| Page: 1 2 3 4 5 6 7 8 9 |
| GO ID | Tissue | Disease Stage | Description | Gene Ratio | Bg Ratio | pvalue | p.adjust | Count |
| GO:000170119 | Esophagus | ESCC | in utero embryonic development | 243/8552 | 367/18723 | 1.00e-15 | 6.86e-14 | 243 |
| GO:00062604 | Esophagus | ESCC | DNA replication | 181/8552 | 260/18723 | 3.55e-15 | 2.05e-13 | 181 |
| GO:0048732111 | Esophagus | ESCC | gland development | 269/8552 | 436/18723 | 7.81e-12 | 2.95e-10 | 269 |
| GO:004578527 | Esophagus | ESCC | positive regulation of cell adhesion | 255/8552 | 437/18723 | 5.07e-08 | 9.11e-07 | 255 |
| GO:00435888 | Esophagus | ESCC | skin development | 163/8552 | 263/18723 | 6.48e-08 | 1.14e-06 | 163 |
| GO:00219159 | Esophagus | ESCC | neural tube development | 101/8552 | 152/18723 | 1.78e-07 | 2.79e-06 | 101 |
| GO:00163316 | Esophagus | ESCC | morphogenesis of embryonic epithelium | 98/8552 | 147/18723 | 2.12e-07 | 3.27e-06 | 98 |
| GO:0061458110 | Esophagus | ESCC | reproductive system development | 247/8552 | 427/18723 | 2.24e-07 | 3.42e-06 | 247 |
| GO:004860818 | Esophagus | ESCC | reproductive structure development | 245/8552 | 424/18723 | 2.82e-07 | 4.14e-06 | 245 |
| GO:000854410 | Esophagus | ESCC | epidermis development | 193/8552 | 324/18723 | 2.87e-07 | 4.19e-06 | 193 |
| GO:000164918 | Esophagus | ESCC | osteoblast differentiation | 140/8552 | 229/18723 | 1.63e-06 | 1.95e-05 | 140 |
| GO:00062754 | Esophagus | ESCC | regulation of DNA replication | 73/8552 | 107/18723 | 1.97e-06 | 2.28e-05 | 73 |
| GO:000150317 | Esophagus | ESCC | ossification | 232/8552 | 408/18723 | 3.00e-06 | 3.40e-05 | 232 |
| GO:002261216 | Esophagus | ESCC | gland morphogenesis | 78/8552 | 118/18723 | 5.83e-06 | 6.03e-05 | 78 |
| GO:00303239 | Esophagus | ESCC | respiratory tube development | 112/8552 | 181/18723 | 7.82e-06 | 7.69e-05 | 112 |
| GO:006056210 | Esophagus | ESCC | epithelial tube morphogenesis | 187/8552 | 325/18723 | 9.95e-06 | 9.44e-05 | 187 |
| GO:00605417 | Esophagus | ESCC | respiratory system development | 123/8552 | 203/18723 | 1.26e-05 | 1.15e-04 | 123 |
| GO:00303249 | Esophagus | ESCC | lung development | 109/8552 | 177/18723 | 1.40e-05 | 1.27e-04 | 109 |
| GO:003087914 | Esophagus | ESCC | mammary gland development | 85/8552 | 137/18723 | 8.11e-05 | 6.01e-04 | 85 |
| GO:006156415 | Esophagus | ESCC | axon development | 251/8552 | 467/18723 | 2.41e-04 | 1.49e-03 | 251 |
| Page: 1 2 3 4 5 |
| Pathway ID | Tissue | Disease Stage | Description | Gene Ratio | Bg Ratio | pvalue | p.adjust | qvalue | Count |
| hsa0439018 | Esophagus | ESCC | Hippo signaling pathway | 92/4205 | 157/8465 | 1.46e-02 | 3.31e-02 | 1.69e-02 | 92 |
| hsa0439019 | Esophagus | ESCC | Hippo signaling pathway | 92/4205 | 157/8465 | 1.46e-02 | 3.31e-02 | 1.69e-02 | 92 |
| Page: 1 |
Top |
Cell-cell communication analysis |
| Identification of potential cell-cell interactions between two cell types and their ligand-receptor pairs for different disease states |
| Ligand | Receptor | LRpair | Pathway | Tissue | Disease Stage |
| Page: 1 |
Top |
Single-cell gene regulatory network inference analysis |
| Find out the significant the regulons (TFs) and the target genes of each regulon across cell types for different disease states |
| TF | Cell Type | Tissue | Disease Stage | Target Gene | RSS | Regulon Activity |
| GLI2 | INCAF | Cervix | Healthy | EBF1,PHLDB1,CDH6, etc. | 1.40e-01 |  |
| GLI2 | ABS | Colorectum | MSI-H | C3,COL6A1,HLA-DRB1, etc. | 3.07e-01 |  |
| GLI2 | IMENT | Colorectum | MSI-H | C3,COL6A1,HLA-DRB1, etc. | 1.10e-01 | |
| GLI2 | ASC | Colorectum | MSI-H | C3,COL6A1,HLA-DRB1, etc. | 1.53e-01 | |
| GLI2 | ICAF | Colorectum | AD | CDH11,PGM2,CUX2, etc. | 3.98e-01 |  |
| GLI2 | INCAF | Colorectum | CRC | CDH11,PGM2,CUX2, etc. | 4.75e-01 |  |
| GLI2 | CFIB | Colorectum | FAP | CDH11,PGM2,CUX2, etc. | 2.70e-01 |  |
| GLI2 | PERI | Endometrium | EEC | PDE8B,HSPA12A,CACNA1D, etc. | 3.73e-01 |  |
| GLI2 | ECM | Pancreas | PDAC | PHLDB1,ZNF526,XYLT1, etc. | 2.10e-01 |  |
| GLI2 | STM | Thyroid | ATC | GZMA,ITM2A,MGAT4A, etc. | 7.52e-01 |  |
| ∗The dot plots of a searched regulon are shown for all cell subpopulations in each disease state of each tissue based on the regulon specific score inferred using pySCENIC and by calculating the average expression. |
| Page: 1 |
Top |
Somatic mutation of malignant transformation related genes |
| Annotation of somatic variants for genes involved in malignant transformation |
| Hugo Symbol | Variant Class | Variant Classification | dbSNP RS | HGVSc | HGVSp | HGVSp Short | SWISSPROT | BIOTYPE | SIFT | PolyPhen | Tumor Sample Barcode | Tissue | Histology | Sex | Age | Stage | Therapy Types | Drugs | Outcome |
| GLI2 | SNV | Missense_Mutation | rs199931941 | c.1108N>A | p.Ala370Thr | p.A370T | P10070 | protein_coding | tolerated(0.47) | benign(0) | TCGA-A2-A1FW-01 | Breast | breast invasive carcinoma | Female | <65 | III/IV | Chemotherapy | cytoxan | SD |
| GLI2 | SNV | Missense_Mutation | c.252N>G | p.His84Gln | p.H84Q | P10070 | protein_coding | deleterious(0.01) | possibly_damaging(0.862) | TCGA-A2-A25E-01 | Breast | breast invasive carcinoma | Female | <65 | III/IV | Chemotherapy | cytoxan | PD | |
| GLI2 | SNV | Missense_Mutation | rs753561308 | c.4160N>A | p.Arg1387His | p.R1387H | P10070 | protein_coding | tolerated_low_confidence(0.11) | benign(0.003) | TCGA-A8-A079-01 | Breast | breast invasive carcinoma | Female | >=65 | III/IV | Chemotherapy | 5-fluorouracil | SD |
| GLI2 | SNV | Missense_Mutation | c.780N>G | p.Ile260Met | p.I260M | P10070 | protein_coding | deleterious(0.02) | probably_damaging(0.993) | TCGA-A8-A07B-01 | Breast | breast invasive carcinoma | Female | >=65 | I/II | Unknown | Unknown | SD | |
| GLI2 | SNV | Missense_Mutation | novel | c.3765N>A | p.Ser1255Arg | p.S1255R | P10070 | protein_coding | deleterious_low_confidence(0) | possibly_damaging(0.526) | TCGA-A8-A09C-01 | Breast | breast invasive carcinoma | Female | >=65 | I/II | Unknown | Unknown | SD |
| GLI2 | SNV | Missense_Mutation | c.1529N>A | p.Cys510Tyr | p.C510Y | P10070 | protein_coding | deleterious(0) | probably_damaging(0.999) | TCGA-A8-A09Z-01 | Breast | breast invasive carcinoma | Female | >=65 | I/II | Unknown | Unknown | SD | |
| GLI2 | SNV | Missense_Mutation | rs755563767 | c.4537N>A | p.Asp1513Asn | p.D1513N | P10070 | protein_coding | deleterious(0.01) | probably_damaging(0.967) | TCGA-AC-A23H-01 | Breast | breast invasive carcinoma | Female | >=65 | I/II | Unknown | Unknown | PD |
| GLI2 | SNV | Missense_Mutation | rs150858529 | c.2084N>T | p.Thr695Met | p.T695M | P10070 | protein_coding | deleterious(0) | possibly_damaging(0.732) | TCGA-AO-A03T-01 | Breast | breast invasive carcinoma | Female | <65 | I/II | Chemotherapy | cyclophosphamide | SD |
| GLI2 | SNV | Missense_Mutation | novel | c.4717N>C | p.Thr1573Pro | p.T1573P | P10070 | protein_coding | deleterious(0) | possibly_damaging(0.621) | TCGA-BH-A202-01 | Breast | breast invasive carcinoma | Female | <65 | I/II | Chemotherapy | carboplatin | CR |
| GLI2 | SNV | Missense_Mutation | novel | c.270C>G | p.Ser90Arg | p.S90R | P10070 | protein_coding | deleterious(0.01) | probably_damaging(0.986) | TCGA-EW-A3U0-01 | Breast | breast invasive carcinoma | Female | <65 | III/IV | Chemotherapy | cisplatin | CR |
| Page: 1 2 3 4 5 6 7 8 9 10 11 12 13 14 15 16 17 18 19 |
Top |
Related drugs of malignant transformation related genes |
| Identification of chemicals and drugs interact with genes involved in malignant transfromation |
| (DGIdb 4.0) |
| Entrez ID | Symbol | Category | Interaction Types | Drug Claim Name | Drug Name | PMIDs |
| Page: 1 |

Copyright 2023-Present -The University of Texas Health Science Center at Houston |