Schematic overview of the cellular and molecular mechanisms involved in the cancer progression, including the proposed cellular and molecular mechanisms in cancer cells trajectory. AT1: alveolar type 1 cells; AT2: alveolar type 2 cells; AAH: atypical adenomatous hyperplasia; AIS: adenocarcinoma in situ; MIA: minimally invasive adenocarcinoma; IA: invasive adenocarcinoma; EMT: epithelial-mesenchymal transition

Home

Download

Statistics

Help

Contact

Center for Computational Systems Medicine
leaf

Gene summary

leaf

Malignant transformation analysis

leaf

Malignant transformation related pathway analysis

leaf

Cell-cell communication analysis

leaf

Single-cell gene regulatory network inference analysis

leaf

Somatic mutation of malignant transformation related genes

leaf

Related drugs of malignant transformation related genes

Gene: GLCE

Gene summary for GLCE

check button Gene summary.

Gene informationSpeciesHuman
Gene symbol

GLCE

Gene ID

26035

Gene nameglucuronic acid epimerase
Gene AliasHSEPI
Cytomap15q23
Gene Typeprotein-coding
GO ID

GO:0006022

UniProtAcc

O94923


Top

Malignant transformation analysis

check button Identification of the aberrant gene expression in precancerous and cancerous lesions by comparing the gene expression of stem-like cells in diseased tissues with normal stem cells
check button Malignant transformation involving gene list.
Entrez IDSymbolReplicatesSpeciesOrganTissueAdj P-valueLog2FCMalignancy
26035GLCEHTA11_3410_2000001011HumanColorectumAD1.21e-07-3.83e-010.0155
26035GLCEHTA11_2487_2000001011HumanColorectumSER1.67e-05-4.89e-01-0.1808
26035GLCEHTA11_696_2000001011HumanColorectumAD1.84e-04-3.64e-01-0.1464
26035GLCEHTA11_6818_2000001021HumanColorectumAD9.42e-03-4.62e-010.0588
26035GLCEHTA11_99999971662_82457HumanColorectumMSS3.79e-10-4.51e-010.3859
26035GLCEHTA11_99999974143_84620HumanColorectumMSS5.63e-19-5.76e-010.3005
26035GLCEA001-C-207HumanColorectumFAP1.39e-03-2.32e-010.1278
26035GLCEA015-C-203HumanColorectumFAP1.13e-22-2.83e-01-0.1294
26035GLCEA015-C-204HumanColorectumFAP6.92e-07-3.47e-01-0.0228
26035GLCEA014-C-040HumanColorectumFAP9.22e-03-3.90e-01-0.1184
26035GLCEA002-C-201HumanColorectumFAP2.35e-09-2.78e-010.0324
26035GLCEA002-C-203HumanColorectumFAP3.33e-04-2.35e-010.2786
26035GLCEA001-C-119HumanColorectumFAP3.64e-05-4.32e-01-0.1557
26035GLCEA001-C-108HumanColorectumFAP4.23e-15-2.15e-01-0.0272
26035GLCEA002-C-205HumanColorectumFAP1.16e-17-3.49e-01-0.1236
26035GLCEA001-C-104HumanColorectumFAP1.29e-08-3.68e-010.0184
26035GLCEA015-C-005HumanColorectumFAP2.14e-02-2.47e-01-0.0336
26035GLCEA015-C-006HumanColorectumFAP5.88e-14-4.40e-01-0.0994
26035GLCEA015-C-106HumanColorectumFAP2.18e-07-2.57e-01-0.0511
26035GLCEA002-C-114HumanColorectumFAP4.33e-20-5.94e-01-0.1561
Page: 1 2 3 4 5 6 

check button Transcriptomic changes along malignancy continuum.
TissueExpression DynamicsAbbreviation
Colorectum (GSE201348)The image shows the transcriptomic changes along malignancy continuum.log2FC in expression of this searched gene in stem-like cells from each diseased tissue sample relative to stem-like cells in normal samples in each tissue plotted against the malignancy continuum. Samples are colored based on if they are from different disease stage.FAP: Familial adenomatous polyposis
CRC: Colorectal cancer
Colorectum (HTA11)The image shows the transcriptomic changes along malignancy continuum.log2FC in expression of this searched gene in stem-like cells from each diseased tissue sample relative to stem-like cells in normal samples in each tissue plotted against the malignancy continuum. Samples are colored based on if they are from different disease stage.AD: Adenomas
SER: Sessile serrated lesions
MSI-H: Microsatellite-high colorectal cancer
MSS: Microsatellite stable colorectal cancer
EsophagusThe image shows the transcriptomic changes along malignancy continuum.log2FC in expression of this searched gene in stem-like cells from each diseased tissue sample relative to stem-like cells in normal samples in each tissue plotted against the malignancy continuum. Samples are colored based on if they are from different disease stage.ESCC: Esophageal squamous cell carcinoma
HGIN: High-grade intraepithelial neoplasias
LGIN: Low-grade intraepithelial neoplasias
LiverThe image shows the transcriptomic changes along malignancy continuum.log2FC in expression of this searched gene in stem-like cells from each diseased tissue sample relative to stem-like cells in normal samples in each tissue plotted against the malignancy continuum. Samples are colored based on if they are from different disease stage.HCC: Hepatocellular carcinoma
NAFLD: Non-alcoholic fatty liver disease
Oral CavityThe image shows the transcriptomic changes along malignancy continuum.log2FC in expression of this searched gene in stem-like cells from each diseased tissue sample relative to stem-like cells in normal samples in each tissue plotted against the malignancy continuum. Samples are colored based on if they are from different disease stage.
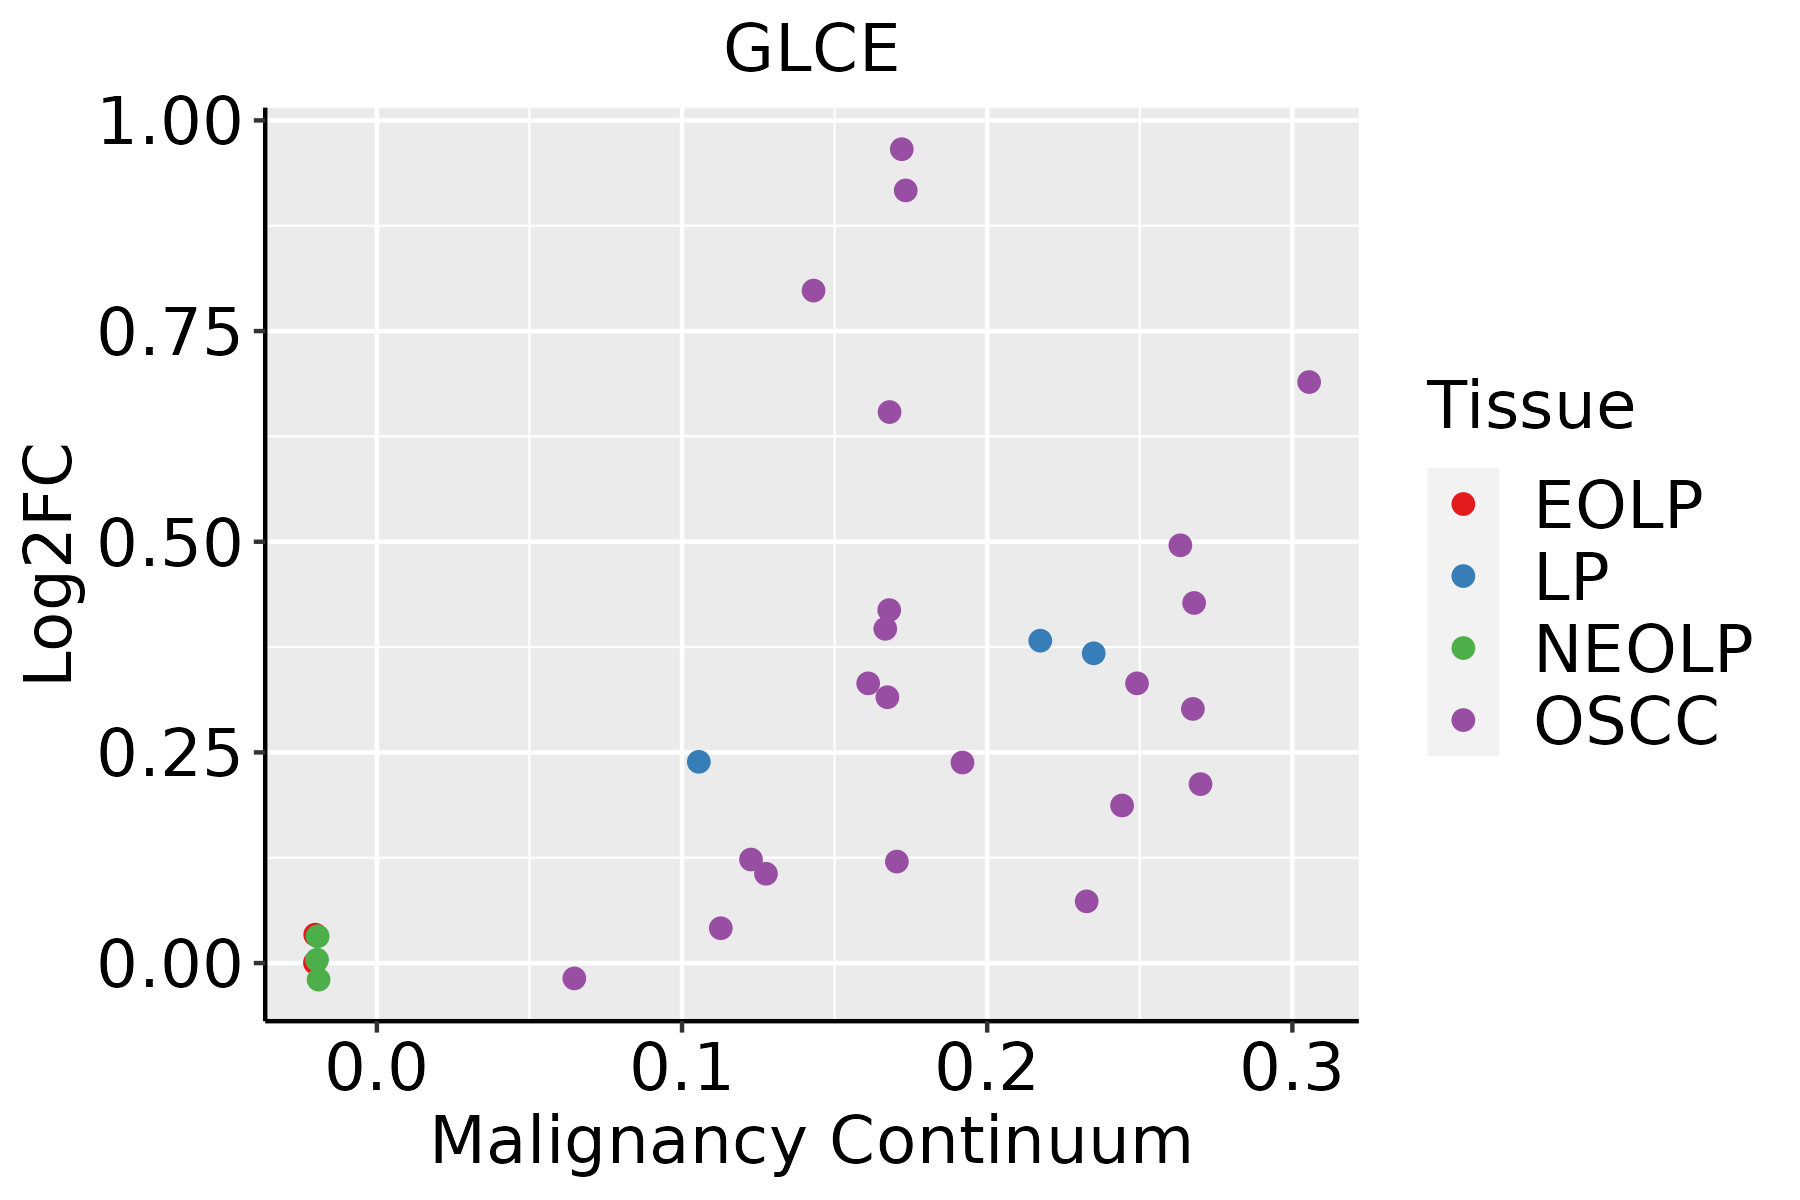
EOLP: Erosive Oral lichen planus
LP: leukoplakia
NEOLP: Non-erosive oral lichen planus
OSCC: Oral squamous cell carcinoma
∗log2FC in expression of this searched gene in stem-like cells from each diseased tissue sample relative to stem-like cells in normal samples in each tissue plotted against the malignancy continuum. Samples are colored based on if they are from different disease stage.

Top

Malignant transformation related pathway analysis

check buttonFind out the enriched GO biological processes and KEGG pathways involved in transition from healthy to precancer to cancer
check button Figure of enriched GO biological processes.
TissueDisease StageEnriched GO biological Processes
ColorectumADGO analysis - Figure of enriched GO biological processes: Top 15 enriched GO BP terms are showed in the bar plot of each disease state in each tissue. Each row represents a significant GO biological process which is colored according to the -log10(p.adjust).
ColorectumSERGO analysis - Figure of enriched GO biological processes: Top 15 enriched GO BP terms are showed in the bar plot of each disease state in each tissue. Each row represents a significant GO biological process which is colored according to the -log10(p.adjust).
ColorectumMSSGO analysis - Figure of enriched GO biological processes: Top 15 enriched GO BP terms are showed in the bar plot of each disease state in each tissue. Each row represents a significant GO biological process which is colored according to the -log10(p.adjust).
ColorectumMSI-HGO analysis - Figure of enriched GO biological processes: Top 15 enriched GO BP terms are showed in the bar plot of each disease state in each tissue. Each row represents a significant GO biological process which is colored according to the -log10(p.adjust).
ColorectumFAPGO analysis - Figure of enriched GO biological processes: Top 15 enriched GO BP terms are showed in the bar plot of each disease state in each tissue. Each row represents a significant GO biological process which is colored according to the -log10(p.adjust).
∗Top 15 enriched GO BP terms are showed in the bar plot of each disease state in each tissue. Each row represents a significant GO biological process which is colored according to the -log10(p.adjust).
Page: 1 2 3 4 5 6 7 8 9 

check button Enriched GO biological processes.
GO IDTissueDisease StageDescriptionGene RatioBg Ratiopvaluep.adjustCount
GO:0006790ColorectumADsulfur compound metabolic process101/3918339/187236.46e-051.07e-03101
GO:00067901ColorectumSERsulfur compound metabolic process73/2897339/187231.75e-031.81e-0273
GO:00067902ColorectumMSSsulfur compound metabolic process85/3467339/187231.52e-031.39e-0285
GO:0009101ColorectumFAPglycoprotein biosynthetic process63/2622317/187232.31e-031.86e-0263
GO:00091002EsophagusESCCglycoprotein metabolic process226/8552387/187232.64e-073.94e-06226
GO:00067906EsophagusESCCsulfur compound metabolic process201/8552339/187232.64e-073.94e-06201
GO:00442725EsophagusESCCsulfur compound biosynthetic process96/8552148/187231.86e-062.16e-0596
GO:00091012EsophagusESCCglycoprotein biosynthetic process181/8552317/187232.54e-052.15e-04181
GO:0006029EsophagusESCCproteoglycan metabolic process48/855279/187234.93e-031.89e-0248
GO:0030166EsophagusESCCproteoglycan biosynthetic process35/855256/187238.30e-032.94e-0235
GO:0006024EsophagusESCCglycosaminoglycan biosynthetic process45/855275/187238.75e-033.08e-0245
GO:0006023EsophagusESCCaminoglycan biosynthetic process47/855279/187239.29e-033.23e-0247
GO:0030201EsophagusESCCheparan sulfate proteoglycan metabolic process21/855231/187231.10e-023.70e-0221
GO:00067904LiverNAFLDsulfur compound metabolic process58/1882339/187233.79e-059.38e-0458
GO:0044272LiverNAFLDsulfur compound biosynthetic process28/1882148/187237.52e-049.52e-0328
GO:000679021LiverHCCsulfur compound metabolic process212/7958339/187235.60e-143.39e-12212
GO:00442722LiverHCCsulfur compound biosynthetic process95/7958148/187237.89e-081.58e-0695
GO:0009100LiverHCCglycoprotein metabolic process193/7958387/187231.89e-039.62e-03193
GO:00442724Oral cavityOSCCsulfur compound biosynthetic process82/7305148/187233.71e-053.31e-0482
GO:00067905Oral cavityOSCCsulfur compound metabolic process168/7305339/187234.50e-053.84e-04168
Page: 1 2 

check button Enriched KEGG pathways.
Pathway IDTissueDisease StageDescriptionGene RatioBg Ratiopvaluep.adjustqvalueCount
Page: 1 

Top

Cell-cell communication analysis

check buttonIdentification of potential cell-cell interactions between two cell types and their ligand-receptor pairs for different disease states
LigandReceptorLRpairPathwayTissueDisease Stage
Page: 1 

Top

Single-cell gene regulatory network inference analysis

check buttonFind out the significant the regulons (TFs) and the target genes of each regulon across cell types for different disease states
TFCell TypeTissueDisease StageTarget GeneRSSRegulon Activity
∗The dot plots of a searched regulon are shown for all cell subpopulations in each disease state of each tissue based on the regulon specific score inferred using pySCENIC and by calculating the average expression.
Page: 1 

Top

Somatic mutation of malignant transformation related genes

check buttonAnnotation of somatic variants for genes involved in malignant transformation
Hugo SymbolVariant ClassVariant ClassificationdbSNP RSHGVScHGVSpHGVSp ShortSWISSPROTBIOTYPESIFTPolyPhenTumor Sample BarcodeTissueHistologySexAgeStageTherapy TypesDrugsOutcome
GLCESNVMissense_Mutationc.1423G>Ap.Ala475Thrp.A475TO94923protein_codingtolerated(0.5)benign(0.265)TCGA-A8-A09M-01Breastbreast invasive carcinomaFemale>=65III/IVChemotherapypaclitaxelCR
GLCESNVMissense_Mutationc.1166N>Cp.Gly389Alap.G389AO94923protein_codingdeleterious(0)probably_damaging(0.998)TCGA-B6-A1KF-01Breastbreast invasive carcinomaFemale>=65I/IIUnknownUnknownSD
GLCESNVMissense_Mutationrs184777253c.202N>Ap.Val68Metp.V68MO94923protein_codingtolerated_low_confidence(0.16)benign(0)TCGA-BH-A0H6-01Breastbreast invasive carcinomaFemale>=65I/IIUnknownUnknownSD
GLCESNVMissense_Mutationc.235N>Gp.Gln79Glup.Q79EO94923protein_codingtolerated_low_confidence(0.45)benign(0.006)TCGA-BH-A18P-01Breastbreast invasive carcinomaFemale<65I/IIUnknownUnknownPD
GLCESNVMissense_Mutationc.587N>Tp.Gly196Valp.G196VO94923protein_codingdeleterious(0)probably_damaging(0.982)TCGA-BH-A1FR-01Breastbreast invasive carcinomaFemale>=65III/IVUnknownUnknownPD
GLCESNVMissense_Mutationnovelc.1406C>Tp.Ser469Leup.S469LO94923protein_codingdeleterious(0)benign(0.138)TCGA-PE-A5DE-01Breastbreast invasive carcinomaFemale<65I/IIChemotherapytaxotereCR
GLCEinsertionIn_Frame_Insnovelc.991_992insGTACAAATGTTAAAAAGCTTATCTGTAGCCTACp.Ala331delinsGlyThrAsnValLysLysLeuIleCysSerLeuProp.A331delinsGTNVKKLICSLPO94923protein_codingTCGA-AN-A0FN-01Breastbreast invasive carcinomaFemale<65I/IIUnknownUnknownSD
GLCEinsertionNonsense_Mutationnovelc.227_228insGATCCAAAATTGTCCTAATACAGTTGTTCAACATTAAAAp.Ala76_Phe77insIleGlnAsnCysProAsnThrValValGlnHisTerLysp.A76_F77insIQNCPNTVVQH*KO94923protein_codingTCGA-BH-A0BR-01Breastbreast invasive carcinomaFemale<65I/IIUnknownUnknownSD
GLCESNVMissense_Mutationc.1228N>Ap.Asp410Asnp.D410NO94923protein_codingtolerated(0.66)benign(0)TCGA-DS-A1OC-01Cervixcervical & endocervical cancerFemale<65I/IIChemotherapygemcitabineSD
GLCESNVMissense_Mutationc.178N>Ap.Glu60Lysp.E60KO94923protein_codingtolerated_low_confidence(0.25)benign(0.018)TCGA-VS-A8QM-01Cervixcervical & endocervical cancerFemale<65I/IIChemotherapycisplatinPD
Page: 1 2 3 4 5 6 7 

Top

Related drugs of malignant transformation related genes

check buttonIdentification of chemicals and drugs interact with genes involved in malignant transfromation
(DGIdb 4.0)
Entrez IDSymbolCategoryInteraction TypesDrug Claim NameDrug NamePMIDs
Page: 1