
|
|||||
|
 | |
| |
| |
| |
| |
| |
|
Gene: GLA |
Gene summary for GLA |
| Gene information | Species | Human | Gene symbol | GLA | Gene ID | 2717 |
| Gene name | galactosidase alpha | |
| Gene Alias | GALA | |
| Cytomap | Xq22.1 | |
| Gene Type | protein-coding | GO ID | GO:0005975 | UniProtAcc | P06280 |
Top |
Malignant transformation analysis |
| Identification of the aberrant gene expression in precancerous and cancerous lesions by comparing the gene expression of stem-like cells in diseased tissues with normal stem cells |
| Entrez ID | Symbol | Replicates | Species | Organ | Tissue | Adj P-value | Log2FC | Malignancy |
| 2717 | GLA | LZE2T | Human | Esophagus | ESCC | 2.04e-04 | 2.69e-01 | 0.082 |
| 2717 | GLA | LZE4T | Human | Esophagus | ESCC | 5.99e-07 | 5.71e-01 | 0.0811 |
| 2717 | GLA | LZE7T | Human | Esophagus | ESCC | 3.36e-03 | 3.87e-01 | 0.0667 |
| 2717 | GLA | LZE8T | Human | Esophagus | ESCC | 8.79e-09 | 1.92e-02 | 0.067 |
| 2717 | GLA | LZE20T | Human | Esophagus | ESCC | 4.74e-02 | 1.25e-01 | 0.0662 |
| 2717 | GLA | LZE24T | Human | Esophagus | ESCC | 4.48e-08 | 5.05e-01 | 0.0596 |
| 2717 | GLA | LZE21T | Human | Esophagus | ESCC | 2.32e-02 | 1.83e-01 | 0.0655 |
| 2717 | GLA | LZE6T | Human | Esophagus | ESCC | 1.00e-06 | 1.23e-01 | 0.0845 |
| 2717 | GLA | P1T-E | Human | Esophagus | ESCC | 1.24e-02 | 2.49e-01 | 0.0875 |
| 2717 | GLA | P2T-E | Human | Esophagus | ESCC | 4.87e-28 | 5.65e-01 | 0.1177 |
| 2717 | GLA | P4T-E | Human | Esophagus | ESCC | 1.54e-16 | 5.83e-01 | 0.1323 |
| 2717 | GLA | P5T-E | Human | Esophagus | ESCC | 2.55e-10 | 2.97e-01 | 0.1327 |
| 2717 | GLA | P8T-E | Human | Esophagus | ESCC | 8.32e-06 | 2.02e-01 | 0.0889 |
| 2717 | GLA | P9T-E | Human | Esophagus | ESCC | 9.53e-24 | 6.69e-01 | 0.1131 |
| 2717 | GLA | P10T-E | Human | Esophagus | ESCC | 1.17e-02 | 6.20e-02 | 0.116 |
| 2717 | GLA | P11T-E | Human | Esophagus | ESCC | 9.94e-04 | 8.21e-01 | 0.1426 |
| 2717 | GLA | P12T-E | Human | Esophagus | ESCC | 3.39e-03 | 1.19e-01 | 0.1122 |
| 2717 | GLA | P15T-E | Human | Esophagus | ESCC | 1.17e-09 | 9.00e-02 | 0.1149 |
| 2717 | GLA | P16T-E | Human | Esophagus | ESCC | 2.24e-10 | -2.02e-03 | 0.1153 |
| 2717 | GLA | P17T-E | Human | Esophagus | ESCC | 3.40e-05 | 3.14e-01 | 0.1278 |
| Page: 1 2 3 4 |
| Tissue | Expression Dynamics | Abbreviation |
| Esophagus | 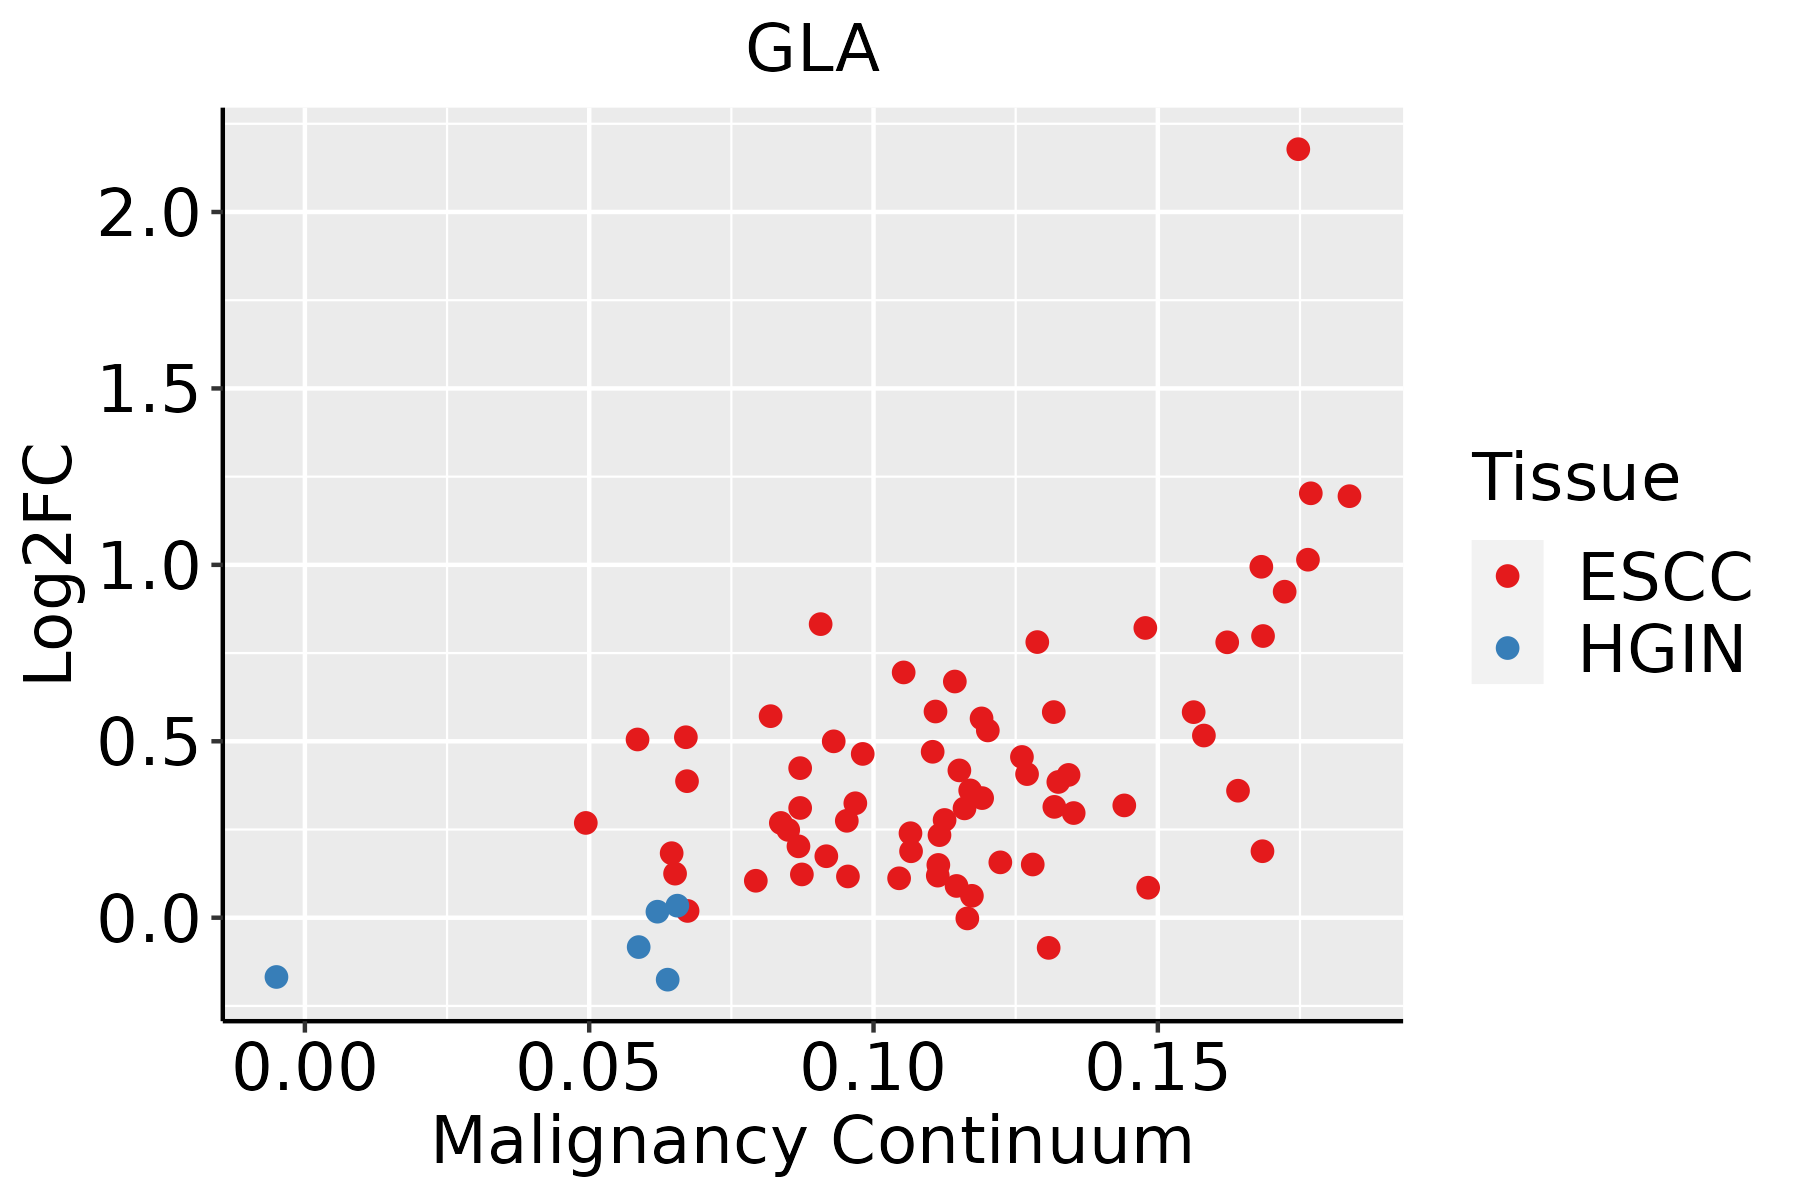 | ESCC: Esophageal squamous cell carcinoma |
| HGIN: High-grade intraepithelial neoplasias | ||
| LGIN: Low-grade intraepithelial neoplasias | ||
| Liver | 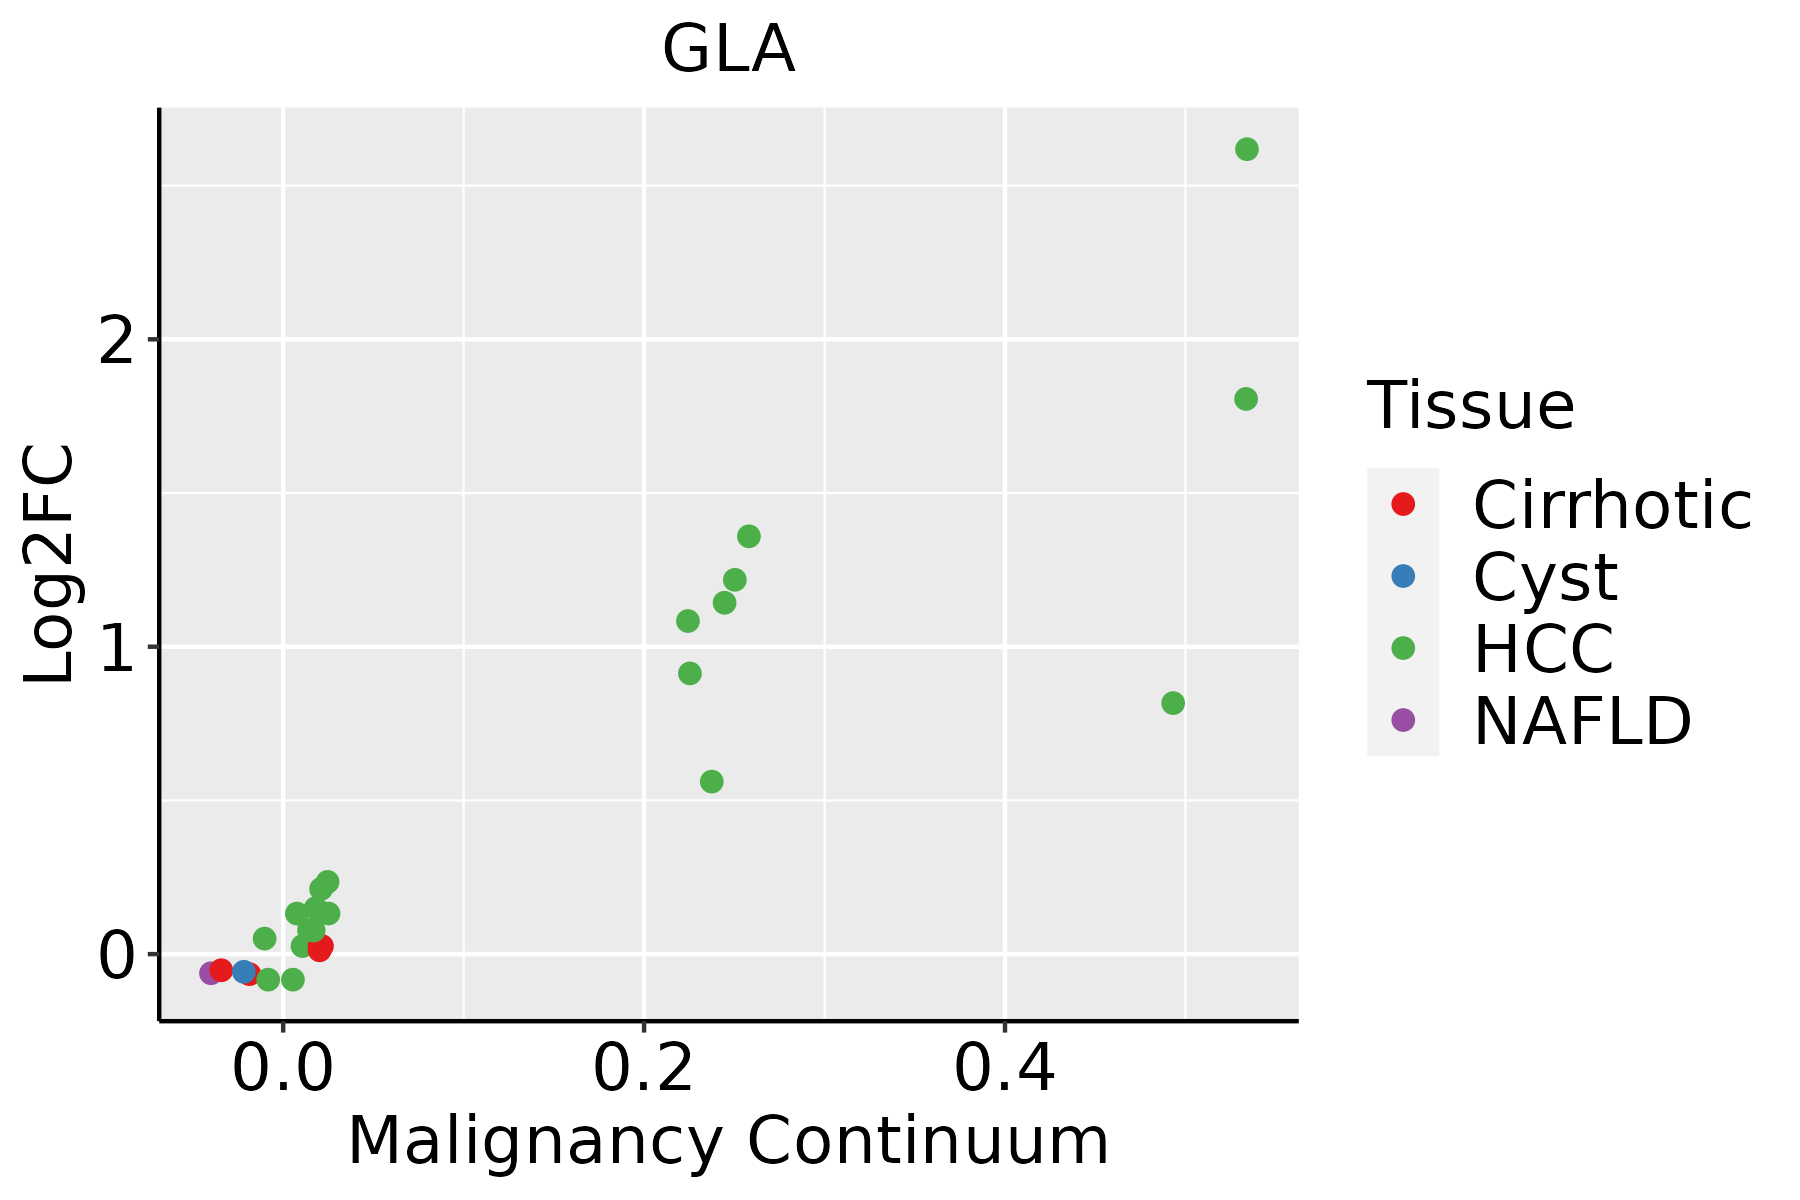 | HCC: Hepatocellular carcinoma |
| NAFLD: Non-alcoholic fatty liver disease | ||
| Prostate | 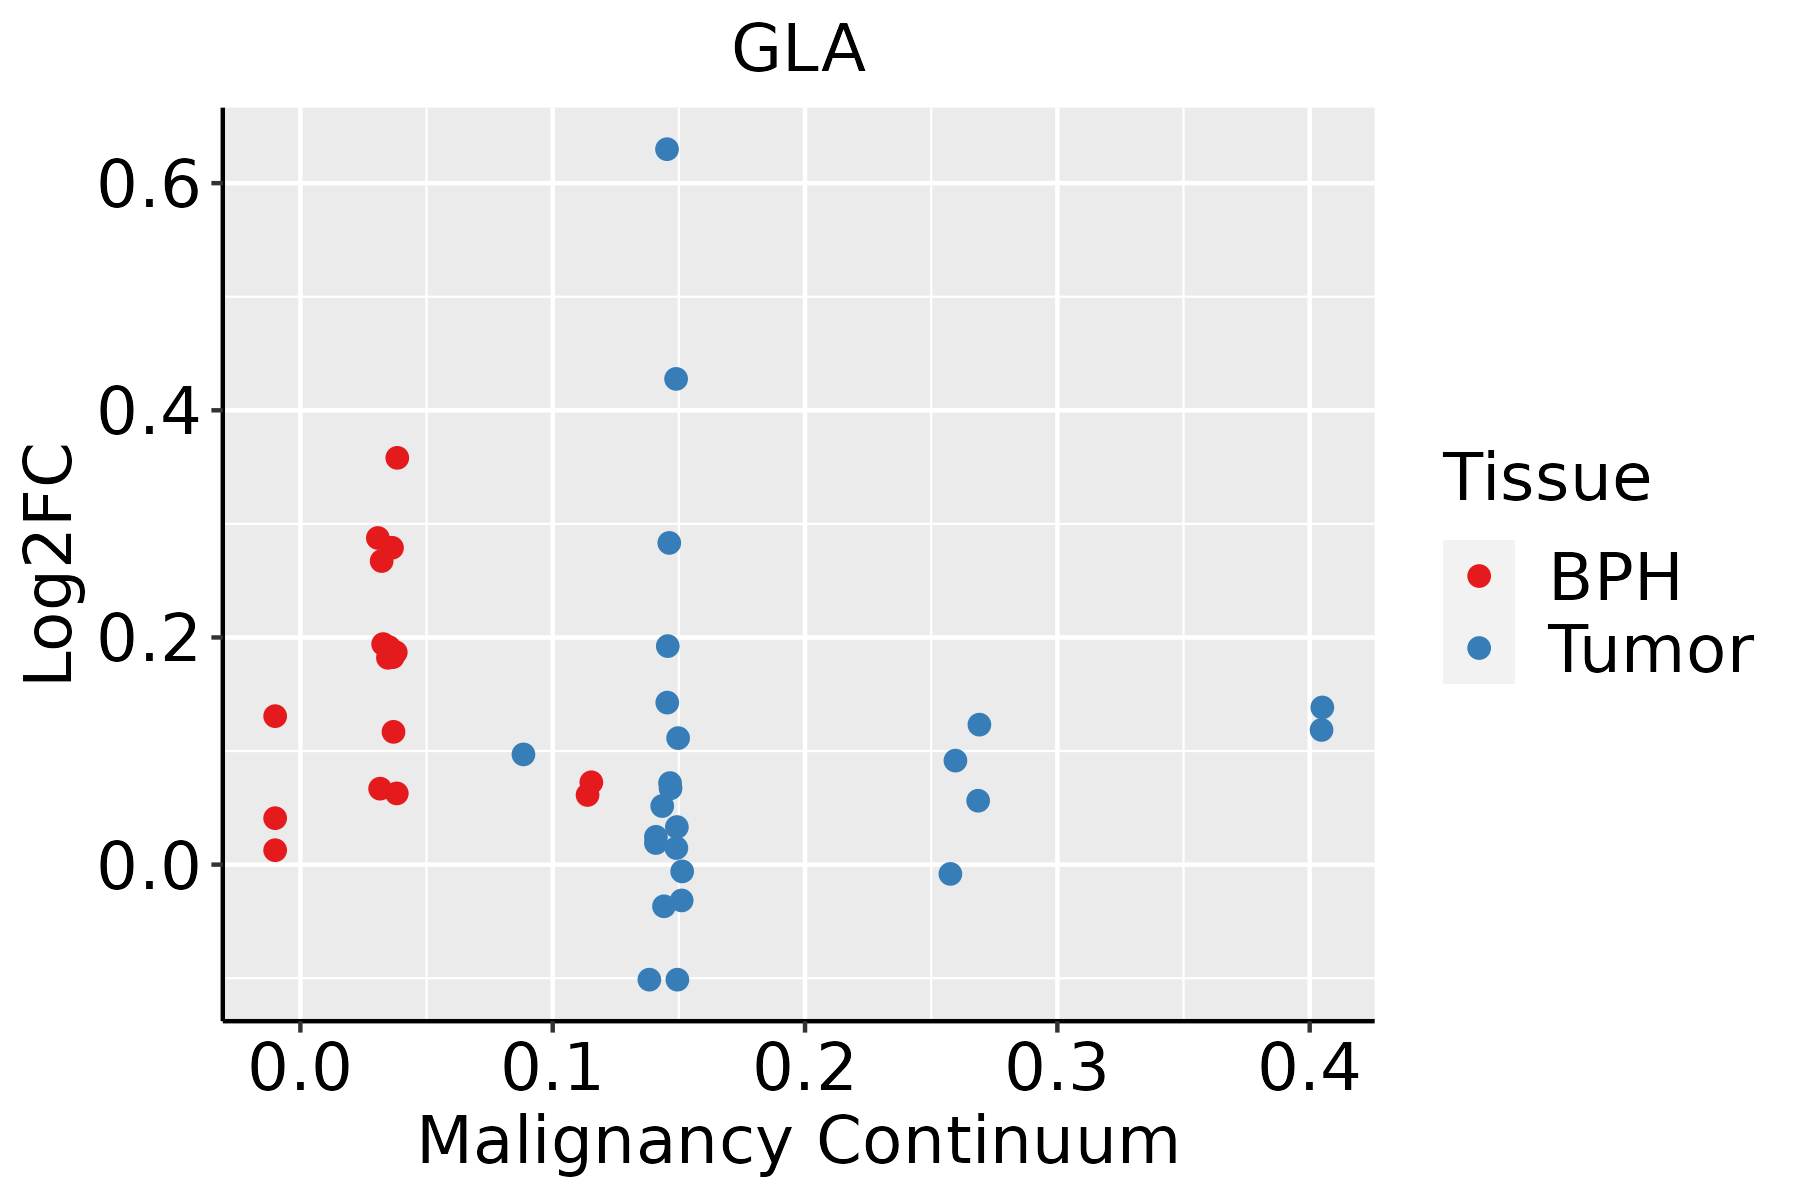 | BPH: Benign Prostatic Hyperplasia |
| Thyroid | 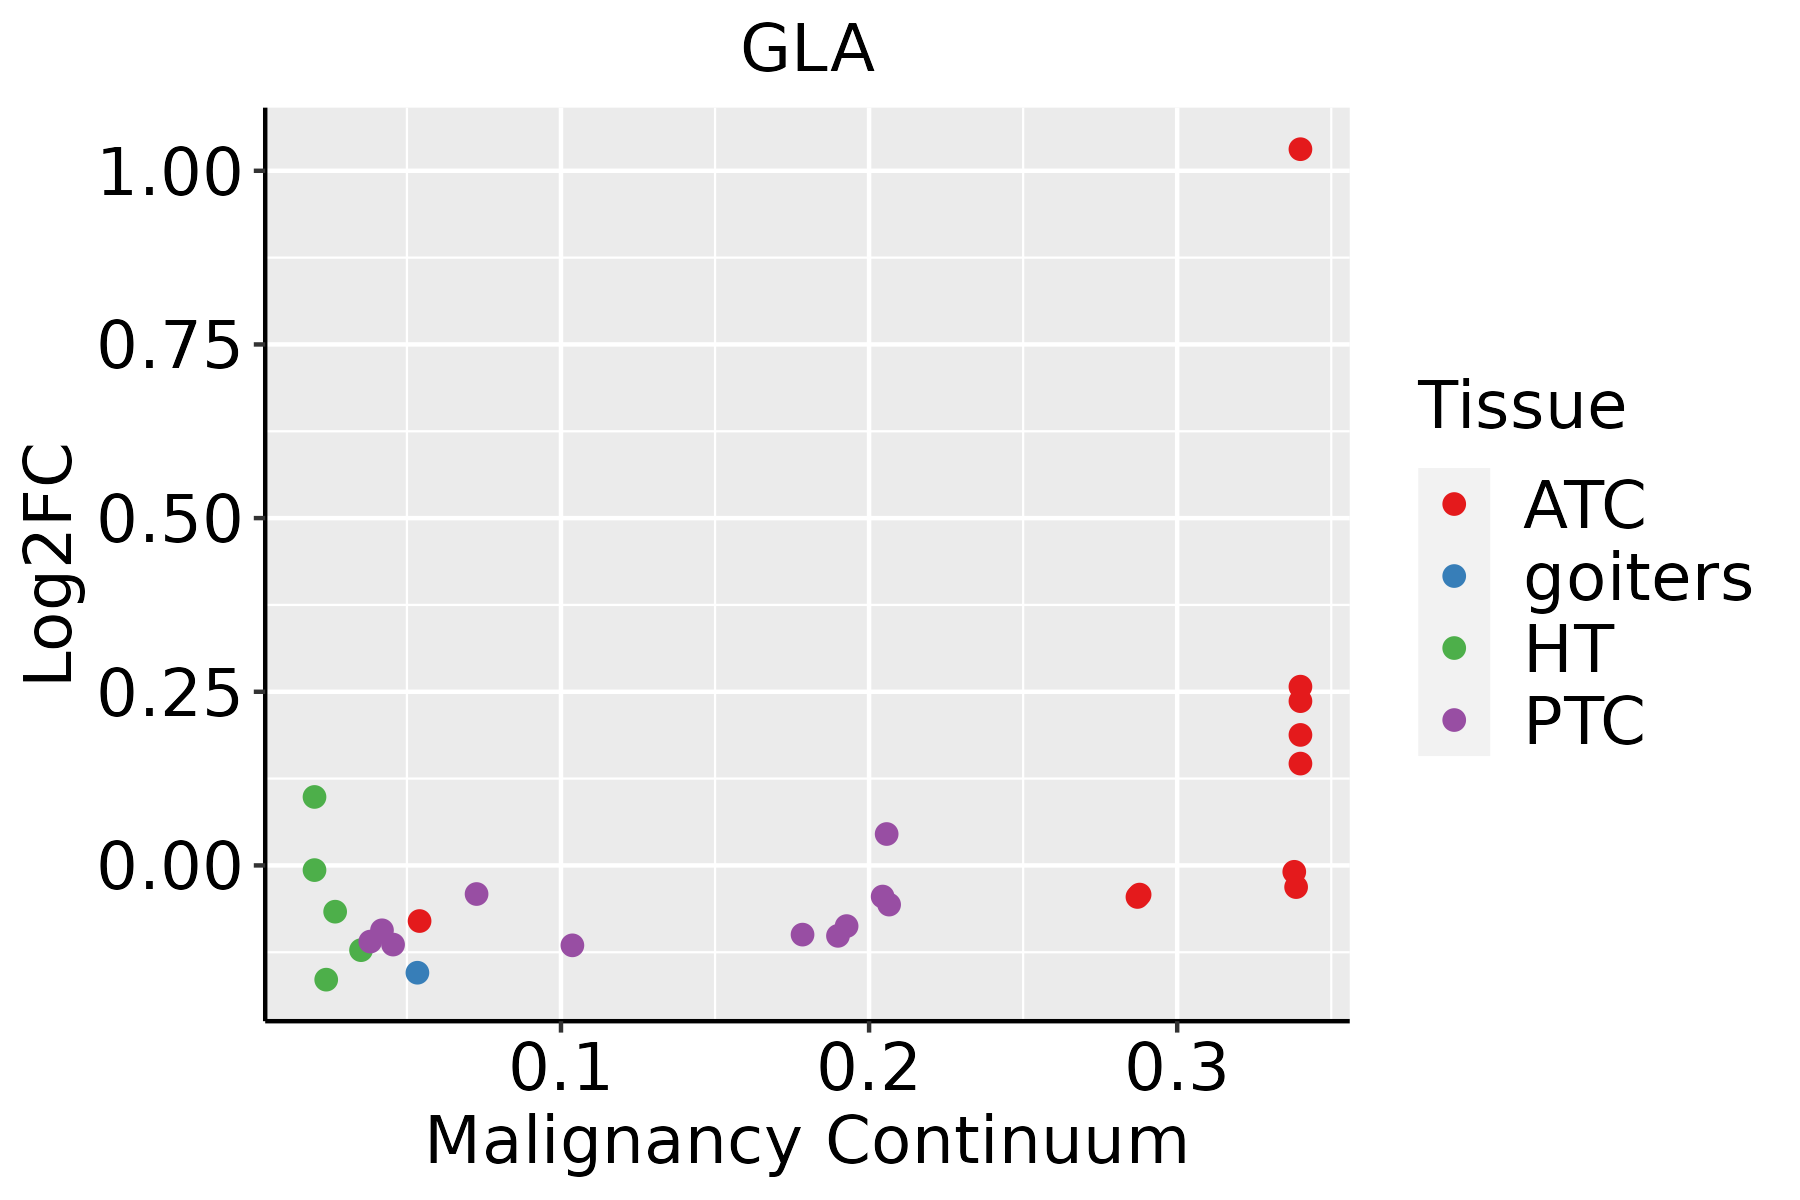 | ATC: Anaplastic thyroid cancer |
| HT: Hashimoto's thyroiditis | ||
| PTC: Papillary thyroid cancer |
| ∗log2FC in expression of this searched gene in stem-like cells from each diseased tissue sample relative to stem-like cells in normal samples in each tissue plotted against the malignancy continuum. Samples are colored based on if they are from different disease stage. |
Top |
Malignant transformation related pathway analysis |
| Find out the enriched GO biological processes and KEGG pathways involved in transition from healthy to precancer to cancer |
| Tissue | Disease Stage | Enriched GO biological Processes |
| Colorectum | AD |  |
| Colorectum | SER |  |
| Colorectum | MSS |  |
| Colorectum | MSI-H |  |
| Colorectum | FAP |  |
| ∗Top 15 enriched GO BP terms are showed in the bar plot of each disease state in each tissue. Each row represents a significant GO biological process which is colored according to the -log10(p.adjust). |
| Page: 1 2 3 4 5 6 7 8 9 |
| GO ID | Tissue | Disease Stage | Description | Gene Ratio | Bg Ratio | pvalue | p.adjust | Count |
| GO:00066433 | Esophagus | ESCC | membrane lipid metabolic process | 130/8552 | 203/18723 | 9.29e-08 | 1.54e-06 | 130 |
| GO:00066652 | Esophagus | ESCC | sphingolipid metabolic process | 96/8552 | 155/18723 | 3.21e-05 | 2.66e-04 | 96 |
| GO:19016574 | Esophagus | ESCC | glycosyl compound metabolic process | 57/8552 | 88/18723 | 2.32e-04 | 1.44e-03 | 57 |
| GO:00066642 | Esophagus | ESCC | glycolipid metabolic process | 63/8552 | 100/18723 | 3.55e-04 | 2.06e-03 | 63 |
| GO:19035092 | Esophagus | ESCC | liposaccharide metabolic process | 63/8552 | 101/18723 | 5.25e-04 | 2.90e-03 | 63 |
| GO:00442427 | Esophagus | ESCC | cellular lipid catabolic process | 121/8552 | 214/18723 | 8.63e-04 | 4.43e-03 | 121 |
| GO:19011362 | Esophagus | ESCC | carbohydrate derivative catabolic process | 99/8552 | 172/18723 | 1.11e-03 | 5.54e-03 | 99 |
| GO:00066721 | Esophagus | ESCC | ceramide metabolic process | 61/8552 | 102/18723 | 2.82e-03 | 1.19e-02 | 61 |
| GO:000680917 | Esophagus | ESCC | nitric oxide biosynthetic process | 47/8552 | 76/18723 | 3.29e-03 | 1.35e-02 | 47 |
| GO:200105717 | Esophagus | ESCC | reactive nitrogen species metabolic process | 50/8552 | 82/18723 | 3.76e-03 | 1.53e-02 | 50 |
| GO:004620917 | Esophagus | ESCC | nitric oxide metabolic process | 49/8552 | 81/18723 | 5.11e-03 | 1.93e-02 | 49 |
| GO:00160427 | Esophagus | ESCC | lipid catabolic process | 168/8552 | 320/18723 | 7.97e-03 | 2.84e-02 | 168 |
| GO:00161373 | Esophagus | ESCC | glycoside metabolic process | 16/8552 | 22/18723 | 9.46e-03 | 3.28e-02 | 16 |
| GO:004424222 | Liver | HCC | cellular lipid catabolic process | 134/7958 | 214/18723 | 2.07e-09 | 5.79e-08 | 134 |
| GO:001604221 | Liver | HCC | lipid catabolic process | 175/7958 | 320/18723 | 6.50e-06 | 7.88e-05 | 175 |
| GO:00066431 | Liver | HCC | membrane lipid metabolic process | 115/7958 | 203/18723 | 3.17e-05 | 3.22e-04 | 115 |
| GO:1901136 | Liver | HCC | carbohydrate derivative catabolic process | 98/7958 | 172/18723 | 8.71e-05 | 7.62e-04 | 98 |
| GO:19016571 | Liver | HCC | glycosyl compound metabolic process | 55/7958 | 88/18723 | 1.20e-04 | 1.01e-03 | 55 |
| GO:200105722 | Liver | HCC | reactive nitrogen species metabolic process | 51/7958 | 82/18723 | 2.50e-04 | 1.86e-03 | 51 |
| GO:004620922 | Liver | HCC | nitric oxide metabolic process | 50/7958 | 81/18723 | 3.72e-04 | 2.56e-03 | 50 |
| Page: 1 2 3 |
| Pathway ID | Tissue | Disease Stage | Description | Gene Ratio | Bg Ratio | pvalue | p.adjust | qvalue | Count |
| hsa0414222 | Esophagus | ESCC | Lysosome | 102/4205 | 132/8465 | 5.11e-11 | 7.13e-10 | 3.65e-10 | 102 |
| hsa006003 | Esophagus | ESCC | Sphingolipid metabolism | 36/4205 | 53/8465 | 5.41e-03 | 1.36e-02 | 6.99e-03 | 36 |
| hsa0414232 | Esophagus | ESCC | Lysosome | 102/4205 | 132/8465 | 5.11e-11 | 7.13e-10 | 3.65e-10 | 102 |
| hsa0060012 | Esophagus | ESCC | Sphingolipid metabolism | 36/4205 | 53/8465 | 5.41e-03 | 1.36e-02 | 6.99e-03 | 36 |
| hsa041422 | Liver | HCC | Lysosome | 100/4020 | 132/8465 | 2.32e-11 | 4.31e-10 | 2.40e-10 | 100 |
| hsa005615 | Liver | HCC | Glycerolipid metabolism | 41/4020 | 63/8465 | 3.59e-03 | 1.12e-02 | 6.22e-03 | 41 |
| hsa00600 | Liver | HCC | Sphingolipid metabolism | 34/4020 | 53/8465 | 1.06e-02 | 2.71e-02 | 1.51e-02 | 34 |
| hsa041423 | Liver | HCC | Lysosome | 100/4020 | 132/8465 | 2.32e-11 | 4.31e-10 | 2.40e-10 | 100 |
| hsa0056112 | Liver | HCC | Glycerolipid metabolism | 41/4020 | 63/8465 | 3.59e-03 | 1.12e-02 | 6.22e-03 | 41 |
| hsa006001 | Liver | HCC | Sphingolipid metabolism | 34/4020 | 53/8465 | 1.06e-02 | 2.71e-02 | 1.51e-02 | 34 |
| Page: 1 |
Top |
Cell-cell communication analysis |
| Identification of potential cell-cell interactions between two cell types and their ligand-receptor pairs for different disease states |
| Ligand | Receptor | LRpair | Pathway | Tissue | Disease Stage |
| Page: 1 |
Top |
Single-cell gene regulatory network inference analysis |
| Find out the significant the regulons (TFs) and the target genes of each regulon across cell types for different disease states |
| TF | Cell Type | Tissue | Disease Stage | Target Gene | RSS | Regulon Activity |
| ∗The dot plots of a searched regulon are shown for all cell subpopulations in each disease state of each tissue based on the regulon specific score inferred using pySCENIC and by calculating the average expression. |
| Page: 1 |
Top |
Somatic mutation of malignant transformation related genes |
| Annotation of somatic variants for genes involved in malignant transformation |
| Hugo Symbol | Variant Class | Variant Classification | dbSNP RS | HGVSc | HGVSp | HGVSp Short | SWISSPROT | BIOTYPE | SIFT | PolyPhen | Tumor Sample Barcode | Tissue | Histology | Sex | Age | Stage | Therapy Types | Drugs | Outcome |
| GLA | SNV | Missense_Mutation | c.731N>T | p.Asp244Val | p.D244V | P06280 | protein_coding | deleterious(0) | benign(0.15) | TCGA-A8-A09Z-01 | Breast | breast invasive carcinoma | Female | >=65 | I/II | Unknown | Unknown | SD | |
| GLA | SNV | Missense_Mutation | novel | c.1279G>T | p.Asp427Tyr | p.D427Y | P06280 | protein_coding | deleterious_low_confidence(0.01) | benign(0.017) | TCGA-AN-A046-01 | Breast | breast invasive carcinoma | Female | >=65 | I/II | Unknown | Unknown | SD |
| GLA | SNV | Missense_Mutation | c.277G>C | p.Asp93His | p.D93H | P06280 | protein_coding | deleterious(0) | probably_damaging(0.999) | TCGA-B6-A0RE-01 | Breast | breast invasive carcinoma | Female | <65 | I/II | Unknown | Unknown | SD | |
| GLA | SNV | Missense_Mutation | rs201819574 | c.116C>T | p.Thr39Met | p.T39M | P06280 | protein_coding | deleterious(0.01) | probably_damaging(0.986) | TCGA-BH-A203-01 | Breast | breast invasive carcinoma | Female | >=65 | I/II | Unknown | Unknown | PD |
| GLA | SNV | Missense_Mutation | c.634C>G | p.Gln212Glu | p.Q212E | P06280 | protein_coding | tolerated(0.74) | benign(0.023) | TCGA-EW-A1J5-01 | Breast | breast invasive carcinoma | Female | <65 | I/II | Chemotherapy | adriamycin | SD | |
| GLA | SNV | Missense_Mutation | rs869312407 | c.796G>A | p.Asp266Asn | p.D266N | P06280 | protein_coding | deleterious(0) | probably_damaging(1) | TCGA-PL-A8LV-01 | Breast | breast invasive carcinoma | Female | <65 | III/IV | Unknown | Unknown | SD |
| GLA | SNV | Missense_Mutation | rs869312277 | c.325N>C | p.Asp109His | p.D109H | P06280 | protein_coding | deleterious(0.01) | probably_damaging(0.999) | TCGA-C5-A1BM-01 | Cervix | cervical & endocervical cancer | Female | >=65 | I/II | Unknown | Unknown | SD |
| GLA | SNV | Missense_Mutation | c.898N>T | p.Leu300Phe | p.L300F | P06280 | protein_coding | deleterious(0) | probably_damaging(0.998) | TCGA-AA-3984-01 | Colorectum | colon adenocarcinoma | Female | <65 | I/II | Unknown | Unknown | SD | |
| GLA | SNV | Missense_Mutation | novel | c.314N>A | p.Arg105Lys | p.R105K | P06280 | protein_coding | tolerated(0.17) | benign(0.078) | TCGA-AA-3984-01 | Colorectum | colon adenocarcinoma | Female | <65 | I/II | Unknown | Unknown | SD |
| GLA | SNV | Missense_Mutation | c.239G>T | p.Gly80Val | p.G80V | P06280 | protein_coding | deleterious(0) | probably_damaging(1) | TCGA-AD-6889-01 | Colorectum | colon adenocarcinoma | Male | >=65 | I/II | Chemotherapy | xeloda | PD |
| Page: 1 2 3 4 5 6 7 |
Top |
Related drugs of malignant transformation related genes |
| Identification of chemicals and drugs interact with genes involved in malignant transfromation |
| (DGIdb 4.0) |
| Entrez ID | Symbol | Category | Interaction Types | Drug Claim Name | Drug Name | PMIDs |
| 2717 | GLA | ENZYME, DRUGGABLE GENOME | PINDOLOL | PINDOLOL | ||
| 2717 | GLA | ENZYME, DRUGGABLE GENOME | Deoxynojirimycin | DUVOGLUSTAT | ||
| 2717 | GLA | ENZYME, DRUGGABLE GENOME | EBSELEN | EBSELEN | ||
| 2717 | GLA | ENZYME, DRUGGABLE GENOME | migalastat | MIGALASTAT | ||
| 2717 | GLA | ENZYME, DRUGGABLE GENOME | Anamorelin | ANAMORELIN | ||
| 2717 | GLA | ENZYME, DRUGGABLE GENOME | L-GLUTAMIC ACID, N-PHTHALOYL | CHEMBL1256390 | ||
| 2717 | GLA | ENZYME, DRUGGABLE GENOME | Migalastat | MIGALASTAT | ||
| 2717 | GLA | ENZYME, DRUGGABLE GENOME | 4-CHLOROMERCURIBENZOIC ACID | 4-CHLOROMERCURIBENZOIC ACID | ||
| 2717 | GLA | ENZYME, DRUGGABLE GENOME | Maltose | MALTOSE | ||
| 2717 | GLA | ENZYME, DRUGGABLE GENOME | Migalastat | MIGALASTAT |
| Page: 1 2 |

Copyright 2023-Present -The University of Texas Health Science Center at Houston |