
|
|||||
|
 | |
| |
| |
| |
| |
| |
|
Gene: GKN2 |
Gene summary for GKN2 |
| Gene information | Species | Human | Gene symbol | GKN2 | Gene ID | 200504 |
| Gene name | gastrokine 2 | |
| Gene Alias | BRICD1B | |
| Cytomap | 2p13.3 | |
| Gene Type | protein-coding | GO ID | GO:0008150 | UniProtAcc | Q86XP6 |
Top |
Malignant transformation analysis |
| Identification of the aberrant gene expression in precancerous and cancerous lesions by comparing the gene expression of stem-like cells in diseased tissues with normal stem cells |
| Entrez ID | Symbol | Replicates | Species | Organ | Tissue | Adj P-value | Log2FC | Malignancy |
| 200504 | GKN2 | Pat01-B | Human | Stomach | GC | 8.35e-21 | -8.55e-01 | 0.5754 |
| 200504 | GKN2 | Pat02-B | Human | Stomach | GC | 1.72e-06 | -4.68e-01 | 0.0368 |
| 200504 | GKN2 | Pat03-B | Human | Stomach | GC | 2.86e-24 | -9.44e-01 | 0.3693 |
| 200504 | GKN2 | Pat07-B | Human | Stomach | GC | 8.67e-07 | -9.79e-01 | 0.0935 |
| 200504 | GKN2 | Pat09-B | Human | Stomach | GC | 3.89e-10 | -7.29e-01 | -0.0359 |
| 200504 | GKN2 | Pat12-B | Human | Stomach | GC | 1.97e-09 | -6.35e-01 | 0.0325 |
| 200504 | GKN2 | Pat13-B | Human | Stomach | GC | 7.34e-14 | -9.52e-01 | 0.0555 |
| 200504 | GKN2 | Pat15-B | Human | Stomach | GC | 3.01e-08 | -6.20e-01 | -0.0778 |
| 200504 | GKN2 | Pat16-B | Human | Stomach | GC | 7.57e-28 | -1.00e+00 | 0.1918 |
| 200504 | GKN2 | Pat17-B | Human | Stomach | GC | 2.63e-02 | -5.66e-01 | 0.3109 |
| 200504 | GKN2 | Pat19-B | Human | Stomach | GC | 3.74e-12 | -8.47e-01 | 0.0826 |
| 200504 | GKN2 | Pat25-A | Human | Stomach | CAG with IM | 7.04e-09 | -4.43e-01 | -0.1648 |
| 200504 | GKN2 | Pat26-A | Human | Stomach | CSG | 1.14e-04 | -2.51e-01 | -0.2402 |
| 200504 | GKN2 | Pat28-A | Human | Stomach | CSG | 5.45e-04 | -1.20e-01 | -0.2594 |
| 200504 | GKN2 | NAG_1 | Human | Stomach | CSG | 4.82e-03 | 4.14e-01 | -0.3534 |
| 200504 | GKN2 | CAG_3 | Human | Stomach | CAG | 3.30e-04 | 2.24e-01 | -0.2766 |
| 200504 | GKN2 | SIM_1 | Human | Stomach | SIM | 8.78e-16 | -8.88e-01 | 0.3573 |
| 200504 | GKN2 | SIM_2 | Human | Stomach | SIM | 8.18e-17 | -9.15e-01 | 0.3139 |
| 200504 | GKN2 | SIM_3 | Human | Stomach | SIM | 4.64e-05 | -5.67e-01 | 0.0345 |
| 200504 | GKN2 | SIM_4 | Human | Stomach | SIM | 2.37e-17 | -7.94e-01 | 0.2664 |
| Page: 1 2 |
| Tissue | Expression Dynamics | Abbreviation |
| GC | 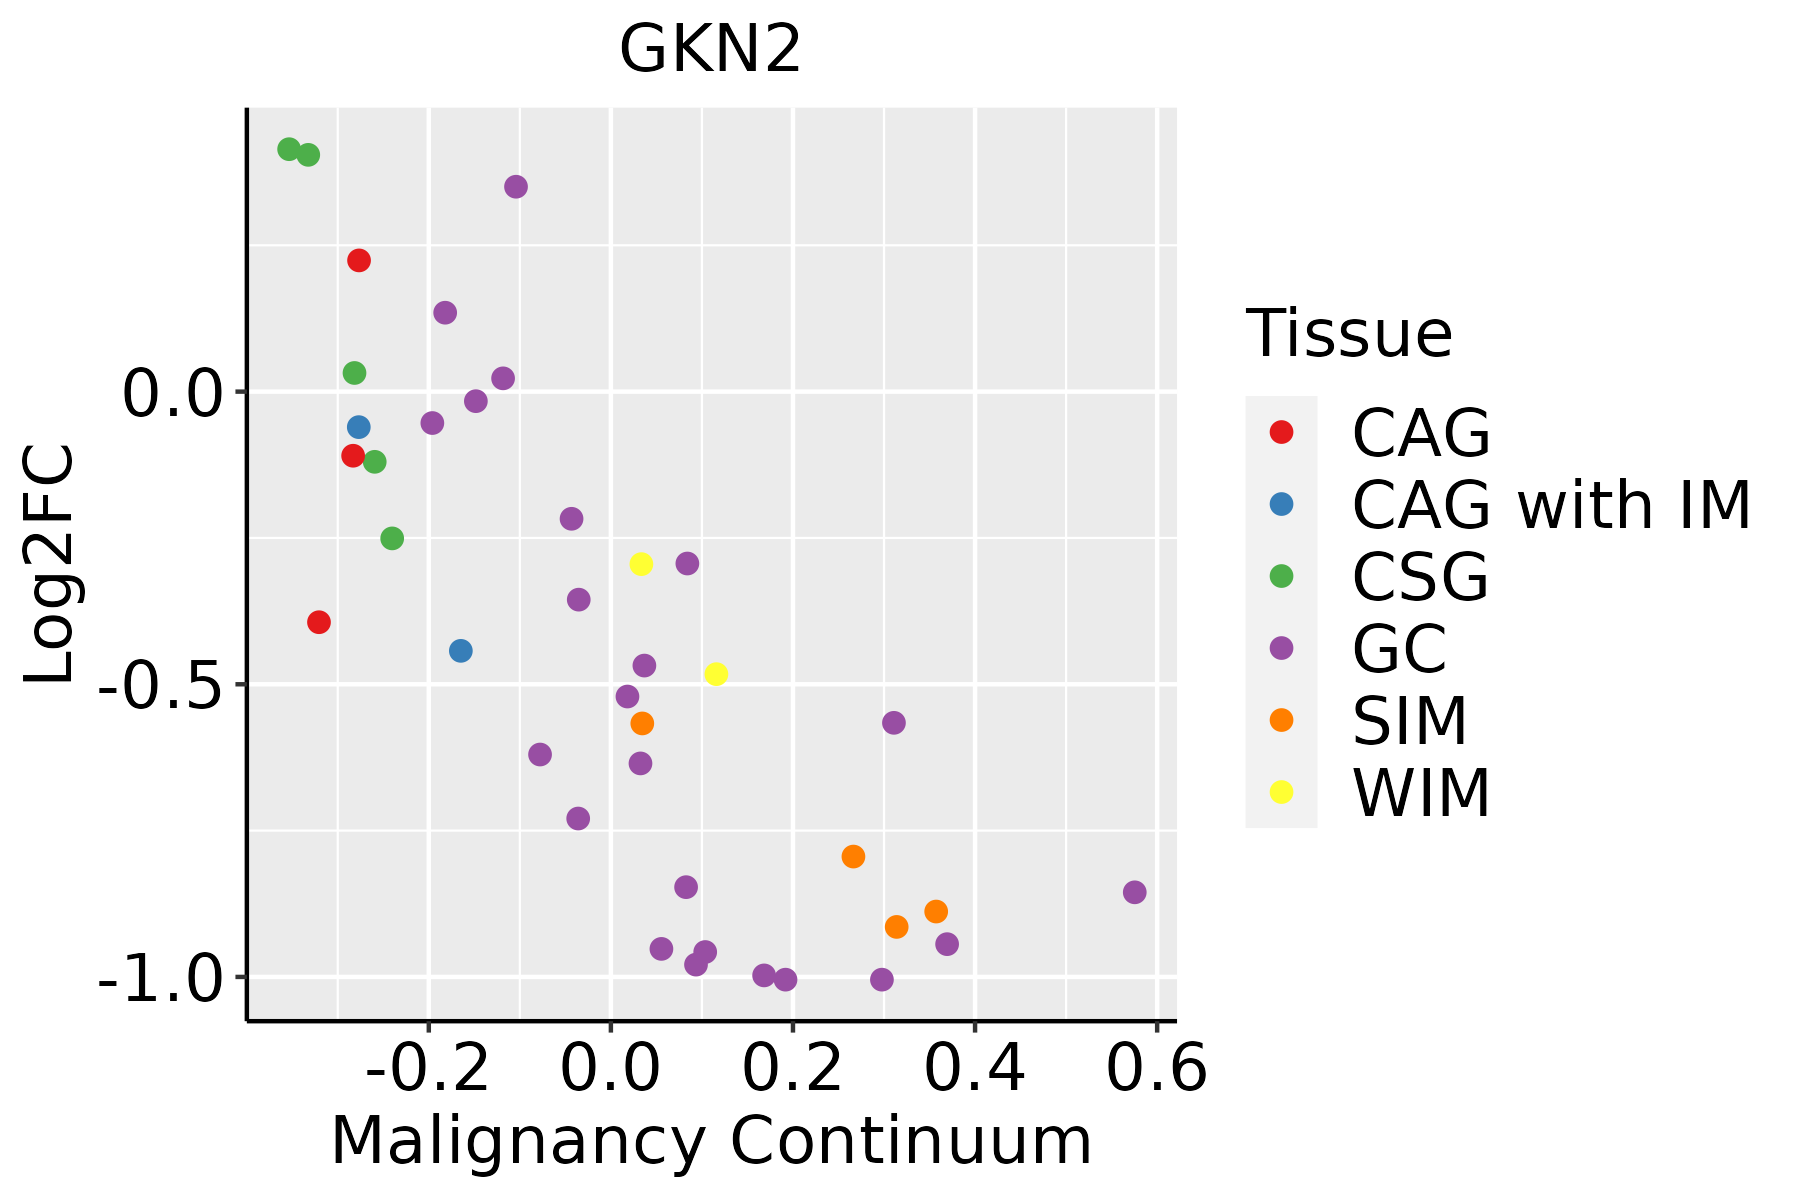 | CAG: Chronic atrophic gastritis |
| CAG with IM: Chronic atrophic gastritis with intestinal metaplasia | ||
| CSG: Chronic superficial gastritis | ||
| GC: Gastric cancer | ||
| SIM: Severe intestinal metaplasia | ||
| WIM: Wild intestinal metaplasia |
| ∗log2FC in expression of this searched gene in stem-like cells from each diseased tissue sample relative to stem-like cells in normal samples in each tissue plotted against the malignancy continuum. Samples are colored based on if they are from different disease stage. |
Top |
Malignant transformation related pathway analysis |
| Find out the enriched GO biological processes and KEGG pathways involved in transition from healthy to precancer to cancer |
| Tissue | Disease Stage | Enriched GO biological Processes |
| Colorectum | AD |  |
| Colorectum | SER |  |
| Colorectum | MSS |  |
| Colorectum | MSI-H |  |
| Colorectum | FAP |  |
| ∗Top 15 enriched GO BP terms are showed in the bar plot of each disease state in each tissue. Each row represents a significant GO biological process which is colored according to the -log10(p.adjust). |
| Page: 1 2 3 4 5 6 7 8 9 |
| GO ID | Tissue | Disease Stage | Description | Gene Ratio | Bg Ratio | pvalue | p.adjust | Count |
| Page: 1 |
| Pathway ID | Tissue | Disease Stage | Description | Gene Ratio | Bg Ratio | pvalue | p.adjust | qvalue | Count |
| Page: 1 |
Top |
Cell-cell communication analysis |
| Identification of potential cell-cell interactions between two cell types and their ligand-receptor pairs for different disease states |
| Ligand | Receptor | LRpair | Pathway | Tissue | Disease Stage |
| Page: 1 |
Top |
Single-cell gene regulatory network inference analysis |
| Find out the significant the regulons (TFs) and the target genes of each regulon across cell types for different disease states |
| TF | Cell Type | Tissue | Disease Stage | Target Gene | RSS | Regulon Activity |
| ∗The dot plots of a searched regulon are shown for all cell subpopulations in each disease state of each tissue based on the regulon specific score inferred using pySCENIC and by calculating the average expression. |
| Page: 1 |
Top |
Somatic mutation of malignant transformation related genes |
| Annotation of somatic variants for genes involved in malignant transformation |
| Hugo Symbol | Variant Class | Variant Classification | dbSNP RS | HGVSc | HGVSp | HGVSp Short | SWISSPROT | BIOTYPE | SIFT | PolyPhen | Tumor Sample Barcode | Tissue | Histology | Sex | Age | Stage | Therapy Types | Drugs | Outcome |
| GKN2 | SNV | Missense_Mutation | c.259N>C | p.Asp87His | p.D87H | Q86XP6 | protein_coding | deleterious(0.03) | probably_damaging(0.954) | TCGA-AN-A0AK-01 | Breast | breast invasive carcinoma | Female | >=65 | I/II | Unknown | Unknown | SD | |
| GKN2 | SNV | Missense_Mutation | novel | c.62N>G | p.Tyr21Cys | p.Y21C | Q86XP6 | protein_coding | tolerated(0.11) | possibly_damaging(0.527) | TCGA-AJ-A3EL-01 | Endometrium | uterine corpus endometrioid carcinoma | Female | <65 | I/II | Unknown | Unknown | SD |
| GKN2 | SNV | Missense_Mutation | novel | c.424N>A | p.Leu142Ile | p.L142I | Q86XP6 | protein_coding | deleterious(0) | probably_damaging(0.954) | TCGA-AP-A051-01 | Endometrium | uterine corpus endometrioid carcinoma | Female | >=65 | I/II | Unknown | Unknown | SD |
| GKN2 | SNV | Missense_Mutation | c.149N>G | p.Ile50Ser | p.I50S | Q86XP6 | protein_coding | tolerated(0.37) | benign(0.122) | TCGA-AP-A051-01 | Endometrium | uterine corpus endometrioid carcinoma | Female | >=65 | I/II | Unknown | Unknown | SD | |
| GKN2 | SNV | Missense_Mutation | novel | c.331N>C | p.Phe111Leu | p.F111L | Q86XP6 | protein_coding | tolerated(0.12) | benign(0.192) | TCGA-AP-A056-01 | Endometrium | uterine corpus endometrioid carcinoma | Female | <65 | I/II | Unknown | Unknown | SD |
| GKN2 | SNV | Missense_Mutation | c.29N>C | p.Val10Ala | p.V10A | Q86XP6 | protein_coding | tolerated(0.13) | benign(0.006) | TCGA-AP-A0LD-01 | Endometrium | uterine corpus endometrioid carcinoma | Female | <65 | I/II | Unknown | Unknown | SD | |
| GKN2 | SNV | Missense_Mutation | novel | c.137N>G | p.Lys46Arg | p.K46R | Q86XP6 | protein_coding | deleterious(0.04) | benign(0.335) | TCGA-BG-A222-01 | Endometrium | uterine corpus endometrioid carcinoma | Female | <65 | I/II | Unknown | Unknown | SD |
| GKN2 | SNV | Missense_Mutation | novel | c.316N>A | p.Ala106Thr | p.A106T | Q86XP6 | protein_coding | tolerated(1) | benign(0.012) | TCGA-DF-A2KN-01 | Endometrium | uterine corpus endometrioid carcinoma | Female | Unknown | I/II | Unknown | Unknown | SD |
| GKN2 | SNV | Missense_Mutation | novel | c.187A>G | p.Ile63Val | p.I63V | Q86XP6 | protein_coding | tolerated(0.23) | benign(0.106) | TCGA-E6-A1LX-01 | Endometrium | uterine corpus endometrioid carcinoma | Female | <65 | I/II | Unknown | Unknown | SD |
| GKN2 | SNV | Missense_Mutation | novel | c.309G>T | p.Glu103Asp | p.E103D | Q86XP6 | protein_coding | deleterious(0.02) | probably_damaging(0.998) | TCGA-FI-A2D5-01 | Endometrium | uterine corpus endometrioid carcinoma | Female | <65 | III/IV | Chemotherapy | carboplatinum | PD |
| Page: 1 2 3 |
Top |
Related drugs of malignant transformation related genes |
| Identification of chemicals and drugs interact with genes involved in malignant transfromation |
| (DGIdb 4.0) |
| Entrez ID | Symbol | Category | Interaction Types | Drug Claim Name | Drug Name | PMIDs |
| Page: 1 |

Copyright 2023-Present -The University of Texas Health Science Center at Houston |