
|
|||||
|
 | |
| |
| |
| |
| |
| |
|
Gene: GKN1 |
Gene summary for GKN1 |
| Gene information | Species | Human | Gene symbol | GKN1 | Gene ID | 56287 |
| Gene name | gastrokine 1 | |
| Gene Alias | AMP18 | |
| Cytomap | 2p13.3 | |
| Gene Type | protein-coding | GO ID | GO:0007586 | UniProtAcc | Q53YU7 |
Top |
Malignant transformation analysis |
| Identification of the aberrant gene expression in precancerous and cancerous lesions by comparing the gene expression of stem-like cells in diseased tissues with normal stem cells |
| Entrez ID | Symbol | Replicates | Species | Organ | Tissue | Adj P-value | Log2FC | Malignancy |
| 56287 | GKN1 | Pat01-B | Human | Stomach | GC | 1.12e-10 | -8.10e-01 | 0.5754 |
| 56287 | GKN1 | Pat02-B | Human | Stomach | GC | 4.07e-05 | -6.92e-01 | 0.0368 |
| 56287 | GKN1 | Pat03-B | Human | Stomach | GC | 1.68e-16 | -9.42e-01 | 0.3693 |
| 56287 | GKN1 | Pat05-B | Human | Stomach | GC | 1.10e-02 | -6.24e-01 | -0.0353 |
| 56287 | GKN1 | Pat07-B | Human | Stomach | GC | 3.68e-04 | -9.55e-01 | 0.0935 |
| 56287 | GKN1 | Pat09-B | Human | Stomach | GC | 7.55e-03 | -6.45e-01 | -0.0359 |
| 56287 | GKN1 | Pat11-B | Human | Stomach | GC | 1.93e-02 | 3.38e-02 | -0.182 |
| 56287 | GKN1 | Pat12-B | Human | Stomach | GC | 8.65e-04 | -4.32e-01 | 0.0325 |
| 56287 | GKN1 | Pat13-B | Human | Stomach | GC | 1.28e-05 | -8.66e-01 | 0.0555 |
| 56287 | GKN1 | Pat15-B | Human | Stomach | GC | 9.74e-03 | -5.50e-01 | -0.0778 |
| 56287 | GKN1 | Pat16-B | Human | Stomach | GC | 4.81e-21 | -9.55e-01 | 0.1918 |
| 56287 | GKN1 | Pat17-B | Human | Stomach | GC | 2.05e-05 | -1.94e-01 | 0.3109 |
| 56287 | GKN1 | Pat19-B | Human | Stomach | GC | 3.65e-06 | -8.18e-01 | 0.0826 |
| 56287 | GKN1 | Pat22-B | Human | Stomach | GC | 4.65e-05 | 2.75e-01 | -0.1042 |
| 56287 | GKN1 | Pat25-A | Human | Stomach | CAG with IM | 9.01e-13 | -6.73e-01 | -0.1648 |
| 56287 | GKN1 | Pat26-A | Human | Stomach | CSG | 2.77e-06 | -5.05e-01 | -0.2402 |
| 56287 | GKN1 | Pat28-A | Human | Stomach | CSG | 4.03e-08 | -2.80e-01 | -0.2594 |
| 56287 | GKN1 | Pat29-A | Human | Stomach | CAG with IM | 7.09e-09 | 9.98e-02 | -0.2769 |
| 56287 | GKN1 | NAG_1 | Human | Stomach | CSG | 7.43e-39 | 8.14e-01 | -0.3534 |
| 56287 | GKN1 | NAG_2 | Human | Stomach | CSG | 2.34e-04 | 2.23e-01 | -0.3324 |
| Page: 1 2 |
| Tissue | Expression Dynamics | Abbreviation |
| GC | 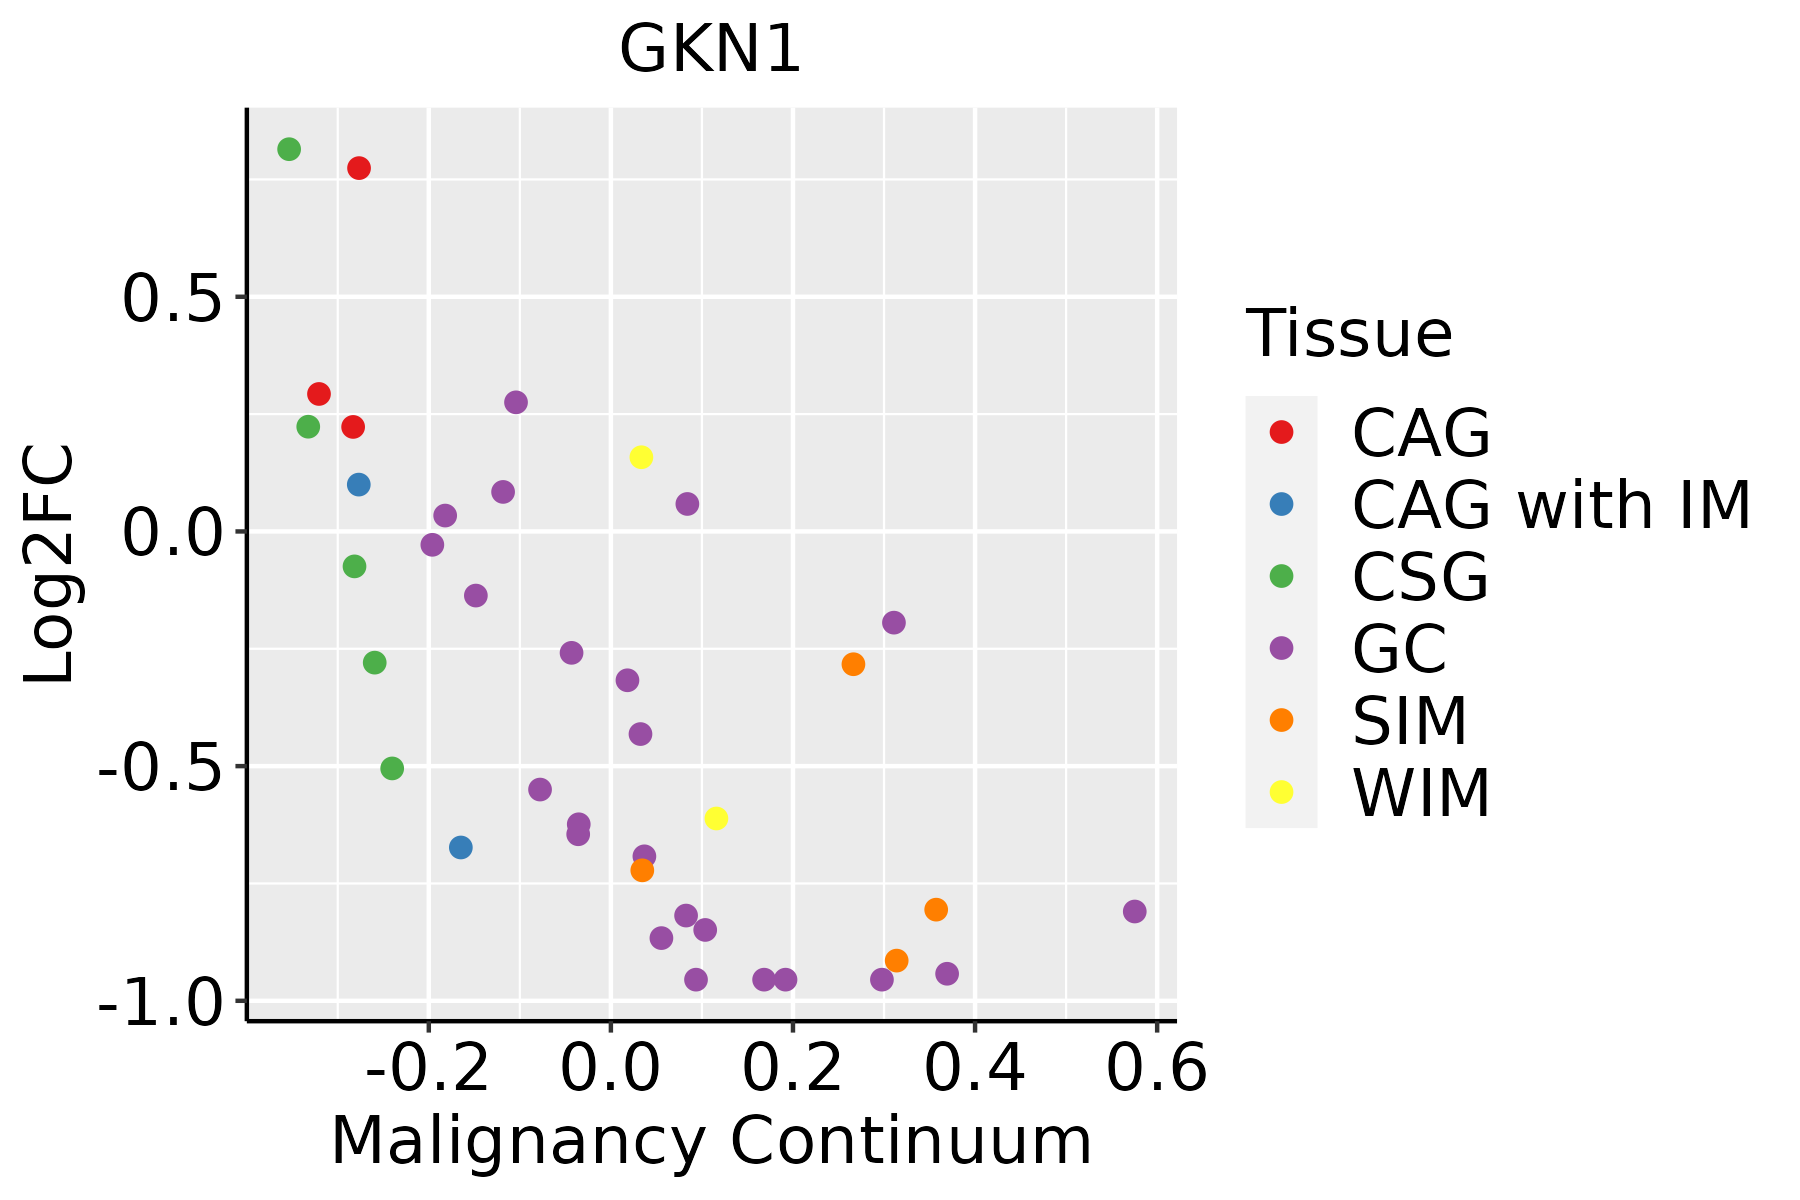 | CAG: Chronic atrophic gastritis |
| CAG with IM: Chronic atrophic gastritis with intestinal metaplasia | ||
| CSG: Chronic superficial gastritis | ||
| GC: Gastric cancer | ||
| SIM: Severe intestinal metaplasia | ||
| WIM: Wild intestinal metaplasia |
| ∗log2FC in expression of this searched gene in stem-like cells from each diseased tissue sample relative to stem-like cells in normal samples in each tissue plotted against the malignancy continuum. Samples are colored based on if they are from different disease stage. |
Top |
Malignant transformation related pathway analysis |
| Find out the enriched GO biological processes and KEGG pathways involved in transition from healthy to precancer to cancer |
| Tissue | Disease Stage | Enriched GO biological Processes |
| Colorectum | AD |  |
| Colorectum | SER |  |
| Colorectum | MSS |  |
| Colorectum | MSI-H |  |
| Colorectum | FAP |  |
| ∗Top 15 enriched GO BP terms are showed in the bar plot of each disease state in each tissue. Each row represents a significant GO biological process which is colored according to the -log10(p.adjust). |
| Page: 1 2 3 4 5 6 7 8 9 |
| GO ID | Tissue | Disease Stage | Description | Gene Ratio | Bg Ratio | pvalue | p.adjust | Count |
| GO:0007586 | Stomach | GC | digestion | 38/1159 | 137/18723 | 1.80e-15 | 1.22e-12 | 38 |
| GO:00075861 | Stomach | CAG with IM | digestion | 29/1050 | 137/18723 | 4.42e-10 | 6.93e-08 | 29 |
| GO:00075862 | Stomach | CSG | digestion | 25/1034 | 137/18723 | 1.15e-07 | 8.25e-06 | 25 |
| GO:00075863 | Stomach | CAG | digestion | 17/552 | 137/18723 | 6.00e-07 | 4.32e-05 | 17 |
| GO:00075864 | Stomach | WIM | digestion | 17/426 | 137/18723 | 1.48e-08 | 1.95e-06 | 17 |
| GO:00075865 | Stomach | SIM | digestion | 24/708 | 137/18723 | 3.20e-10 | 6.29e-08 | 24 |
| Page: 1 |
| Pathway ID | Tissue | Disease Stage | Description | Gene Ratio | Bg Ratio | pvalue | p.adjust | qvalue | Count |
| Page: 1 |
Top |
Cell-cell communication analysis |
| Identification of potential cell-cell interactions between two cell types and their ligand-receptor pairs for different disease states |
| Ligand | Receptor | LRpair | Pathway | Tissue | Disease Stage |
| Page: 1 |
Top |
Single-cell gene regulatory network inference analysis |
| Find out the significant the regulons (TFs) and the target genes of each regulon across cell types for different disease states |
| TF | Cell Type | Tissue | Disease Stage | Target Gene | RSS | Regulon Activity |
| ∗The dot plots of a searched regulon are shown for all cell subpopulations in each disease state of each tissue based on the regulon specific score inferred using pySCENIC and by calculating the average expression. |
| Page: 1 |
Top |
Somatic mutation of malignant transformation related genes |
| Annotation of somatic variants for genes involved in malignant transformation |
| Hugo Symbol | Variant Class | Variant Classification | dbSNP RS | HGVSc | HGVSp | HGVSp Short | SWISSPROT | BIOTYPE | SIFT | PolyPhen | Tumor Sample Barcode | Tissue | Histology | Sex | Age | Stage | Therapy Types | Drugs | Outcome |
| GKN1 | SNV | Missense_Mutation | c.130N>G | p.Asn44Asp | p.N44D | Q9NS71 | protein_coding | tolerated(0.32) | benign(0.005) | TCGA-AA-3818-01 | Colorectum | colon adenocarcinoma | Female | >=65 | I/II | Unknown | Unknown | PD | |
| GKN1 | SNV | Missense_Mutation | rs200701146 | c.542N>T | p.Thr181Met | p.T181M | Q9NS71 | protein_coding | tolerated(0.06) | benign(0.2) | TCGA-NH-A5IV-01 | Colorectum | colon adenocarcinoma | Female | >=65 | I/II | Unknown | Unknown | SD |
| GKN1 | SNV | Missense_Mutation | rs141746794 | c.31N>T | p.Arg11Cys | p.R11C | Q9NS71 | protein_coding | tolerated(0.14) | benign(0) | TCGA-AG-A002-01 | Colorectum | rectum adenocarcinoma | Male | <65 | I/II | Unknown | Unknown | SD |
| GKN1 | insertion | Frame_Shift_Ins | novel | c.452dupA | p.Asn151LysfsTer15 | p.N151Kfs*15 | Q9NS71 | protein_coding | TCGA-AA-3877-01 | Colorectum | colon adenocarcinoma | Female | >=65 | I/II | Unknown | Unknown | SD | ||
| GKN1 | deletion | Frame_Shift_Del | rs759880395 | c.523delT | p.Tyr175ThrfsTer38 | p.Y175Tfs*38 | Q9NS71 | protein_coding | TCGA-AA-3877-01 | Colorectum | colon adenocarcinoma | Female | >=65 | I/II | Unknown | Unknown | SD | ||
| GKN1 | SNV | Missense_Mutation | c.248N>A | p.Gly83Asp | p.G83D | Q9NS71 | protein_coding | deleterious(0.04) | benign(0.096) | TCGA-AP-A051-01 | Endometrium | uterine corpus endometrioid carcinoma | Female | >=65 | I/II | Unknown | Unknown | SD | |
| GKN1 | SNV | Missense_Mutation | rs377408917 | c.427N>A | p.Asp143Asn | p.D143N | Q9NS71 | protein_coding | tolerated(0.39) | benign(0.019) | TCGA-AP-A0LM-01 | Endometrium | uterine corpus endometrioid carcinoma | Female | <65 | III/IV | Chemotherapy | cisplatin | SD |
| GKN1 | SNV | Missense_Mutation | c.427G>T | p.Asp143Tyr | p.D143Y | Q9NS71 | protein_coding | deleterious(0.01) | possibly_damaging(0.902) | TCGA-AP-A1DR-01 | Endometrium | uterine corpus endometrioid carcinoma | Female | <65 | III/IV | Chemotherapy | cisplatin | SD | |
| GKN1 | SNV | Missense_Mutation | novel | c.473G>T | p.Gly158Val | p.G158V | Q9NS71 | protein_coding | deleterious(0) | probably_damaging(0.997) | TCGA-AX-A2HC-01 | Endometrium | uterine corpus endometrioid carcinoma | Female | <65 | III/IV | Chemotherapy | paclitaxel | PD |
| GKN1 | SNV | Missense_Mutation | novel | c.482C>T | p.Thr161Ile | p.T161I | Q9NS71 | protein_coding | deleterious(0) | probably_damaging(0.964) | TCGA-B5-A1MX-01 | Endometrium | uterine corpus endometrioid carcinoma | Female | <65 | I/II | Hormone Therapy | megace | SD |
| Page: 1 2 3 |
Top |
Related drugs of malignant transformation related genes |
| Identification of chemicals and drugs interact with genes involved in malignant transfromation |
| (DGIdb 4.0) |
| Entrez ID | Symbol | Category | Interaction Types | Drug Claim Name | Drug Name | PMIDs |
| Page: 1 |

Copyright 2023-Present -The University of Texas Health Science Center at Houston |