| Tissue | Expression Dynamics | Abbreviation |
| Cervix | 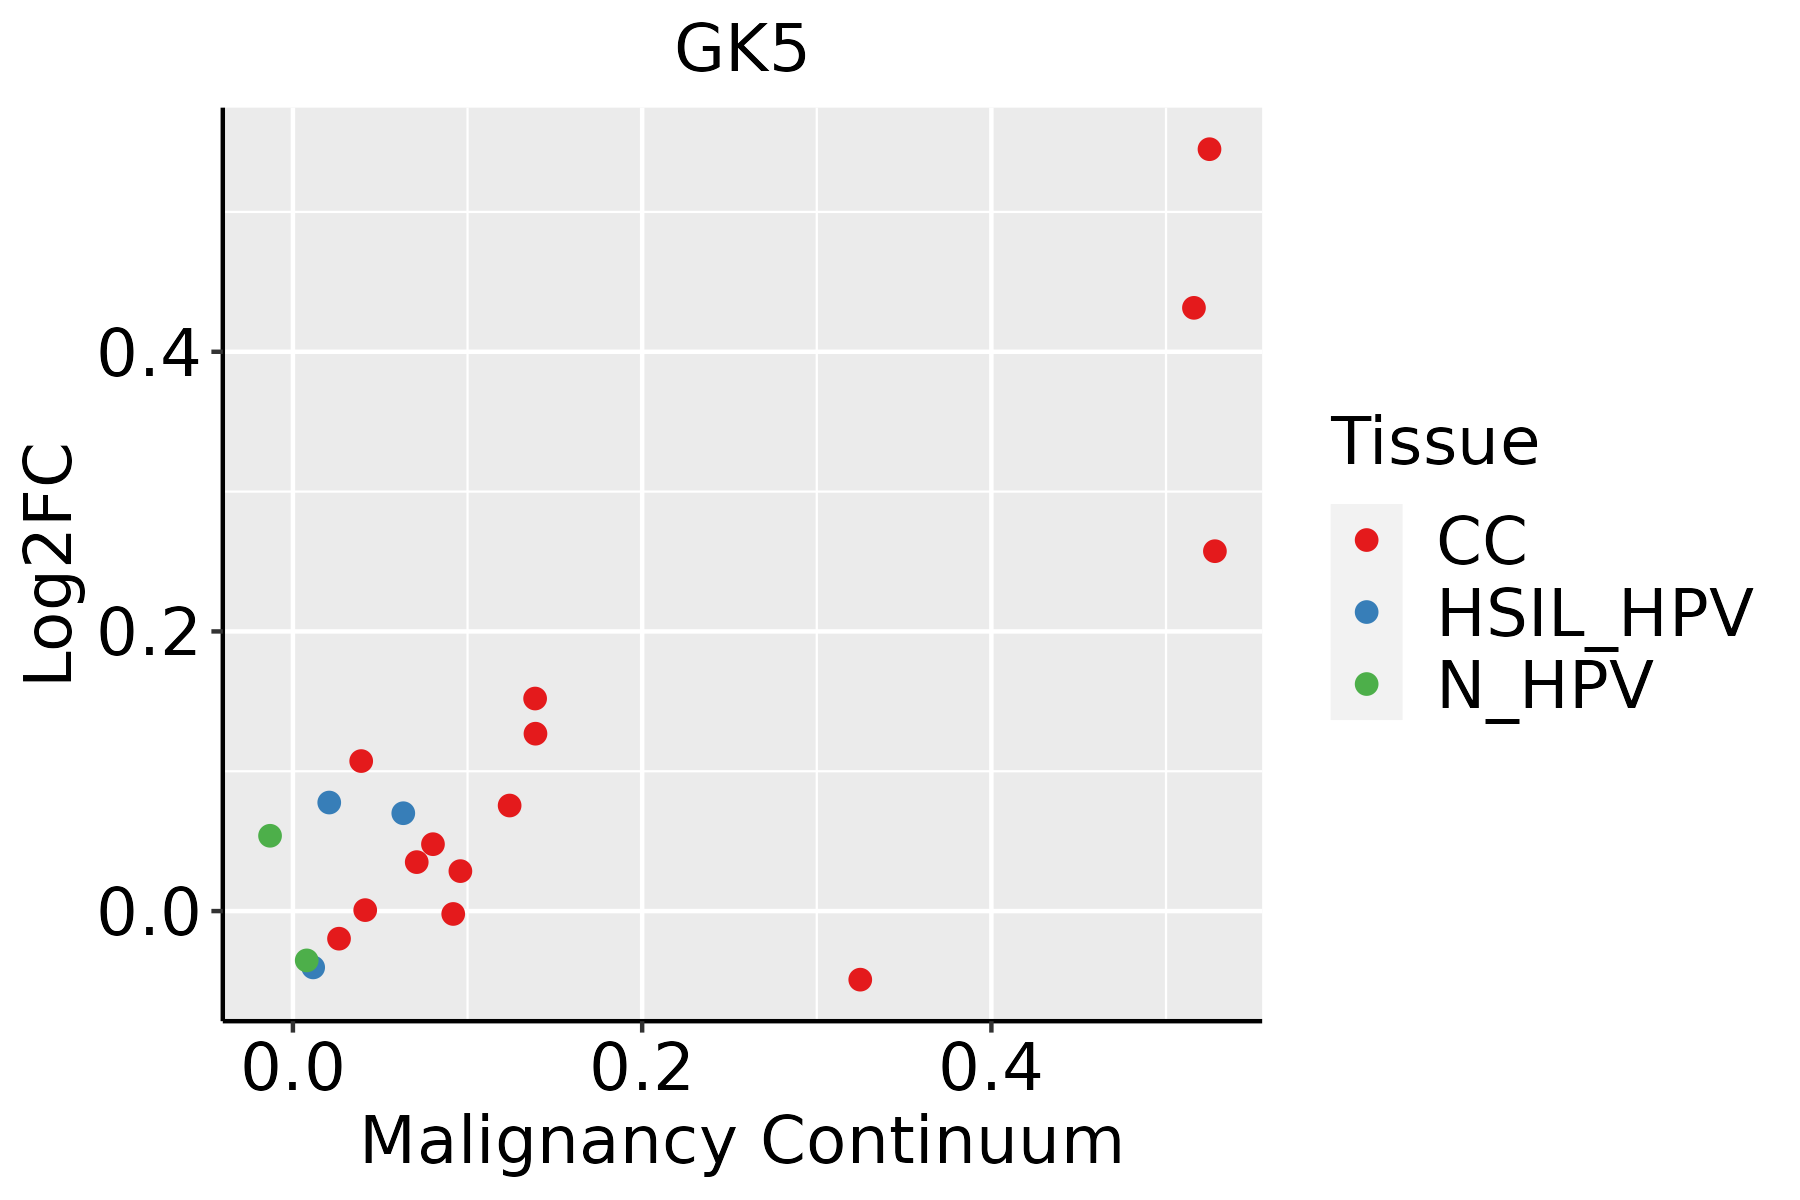 | CC: Cervix cancer |
| HSIL_HPV: HPV-infected high-grade squamous intraepithelial lesions |
| N_HPV: HPV-infected normal cervix |
| Esophagus |  | ESCC: Esophageal squamous cell carcinoma |
| HGIN: High-grade intraepithelial neoplasias |
| LGIN: Low-grade intraepithelial neoplasias |
| Liver | 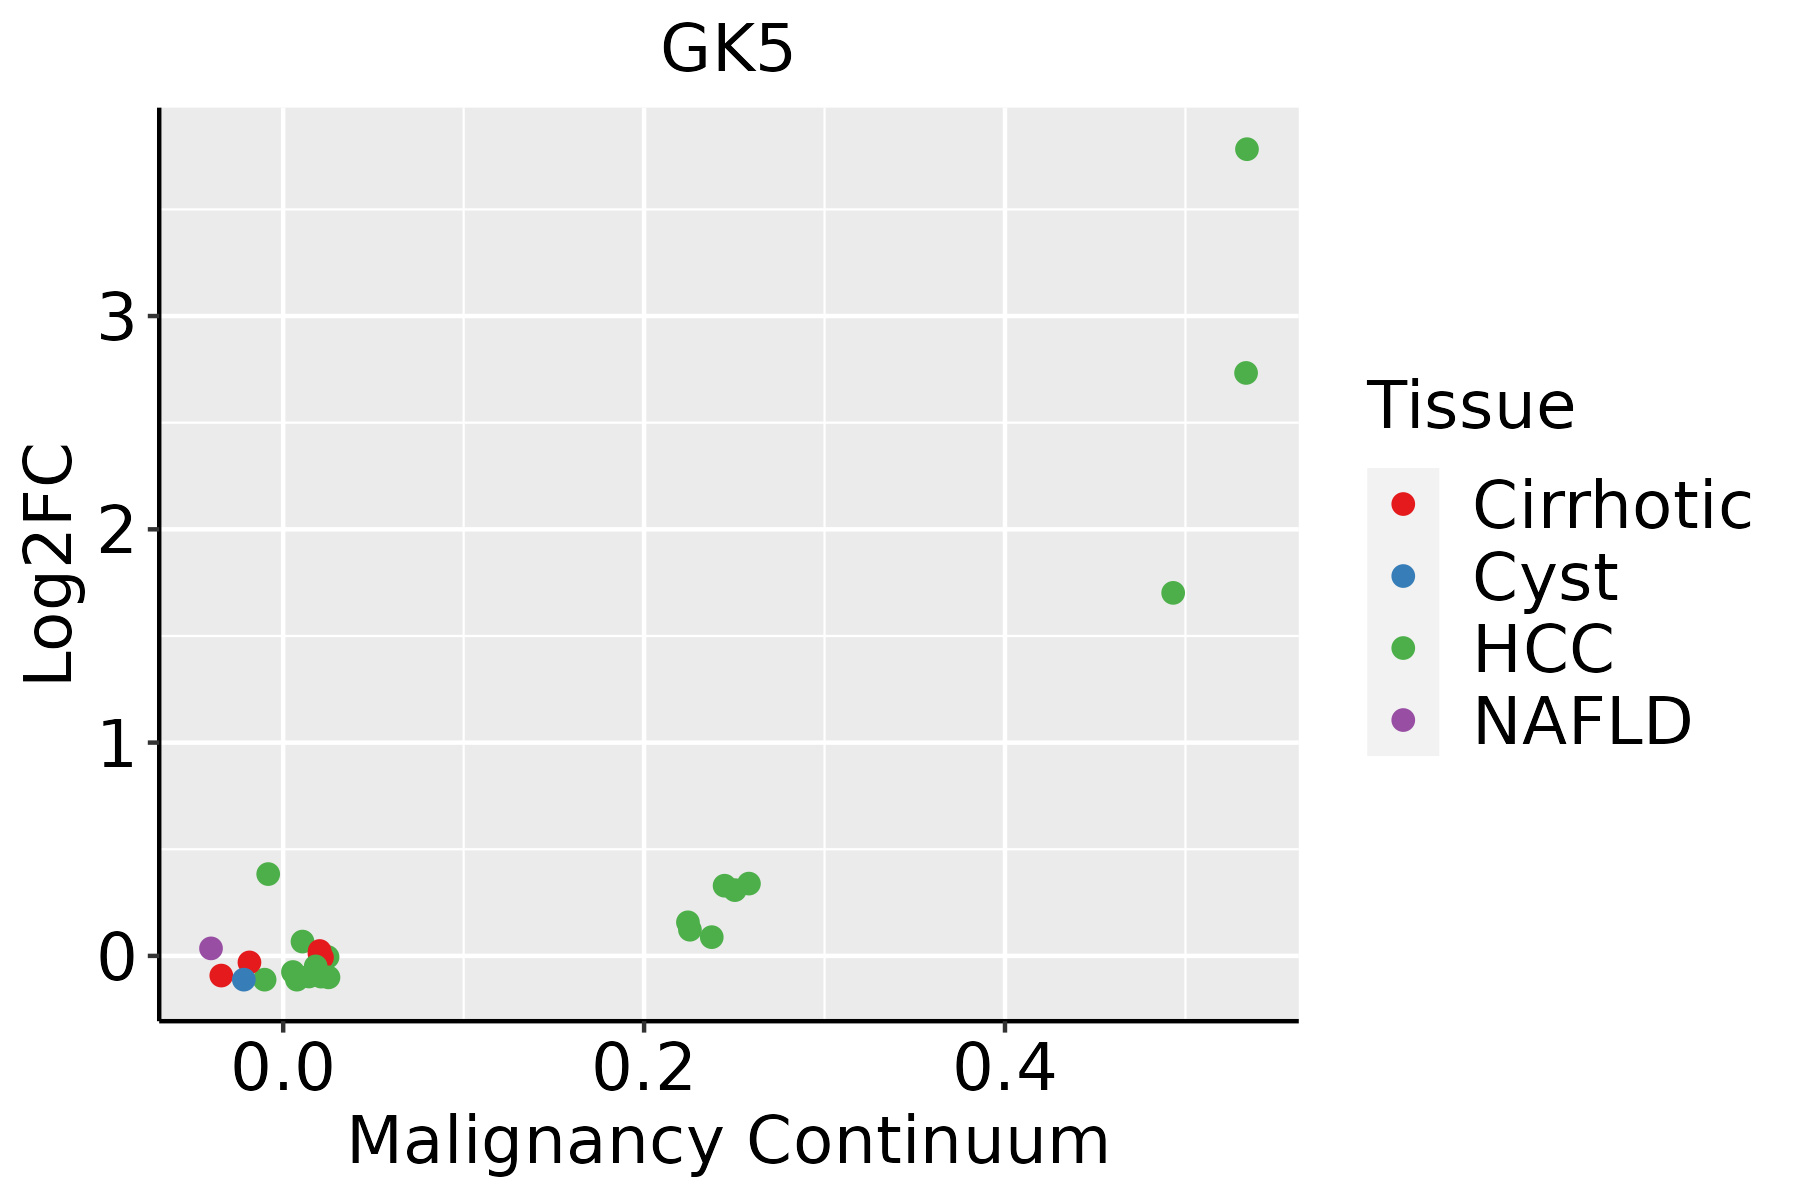 | HCC: Hepatocellular carcinoma |
| NAFLD: Non-alcoholic fatty liver disease |
| Lung | 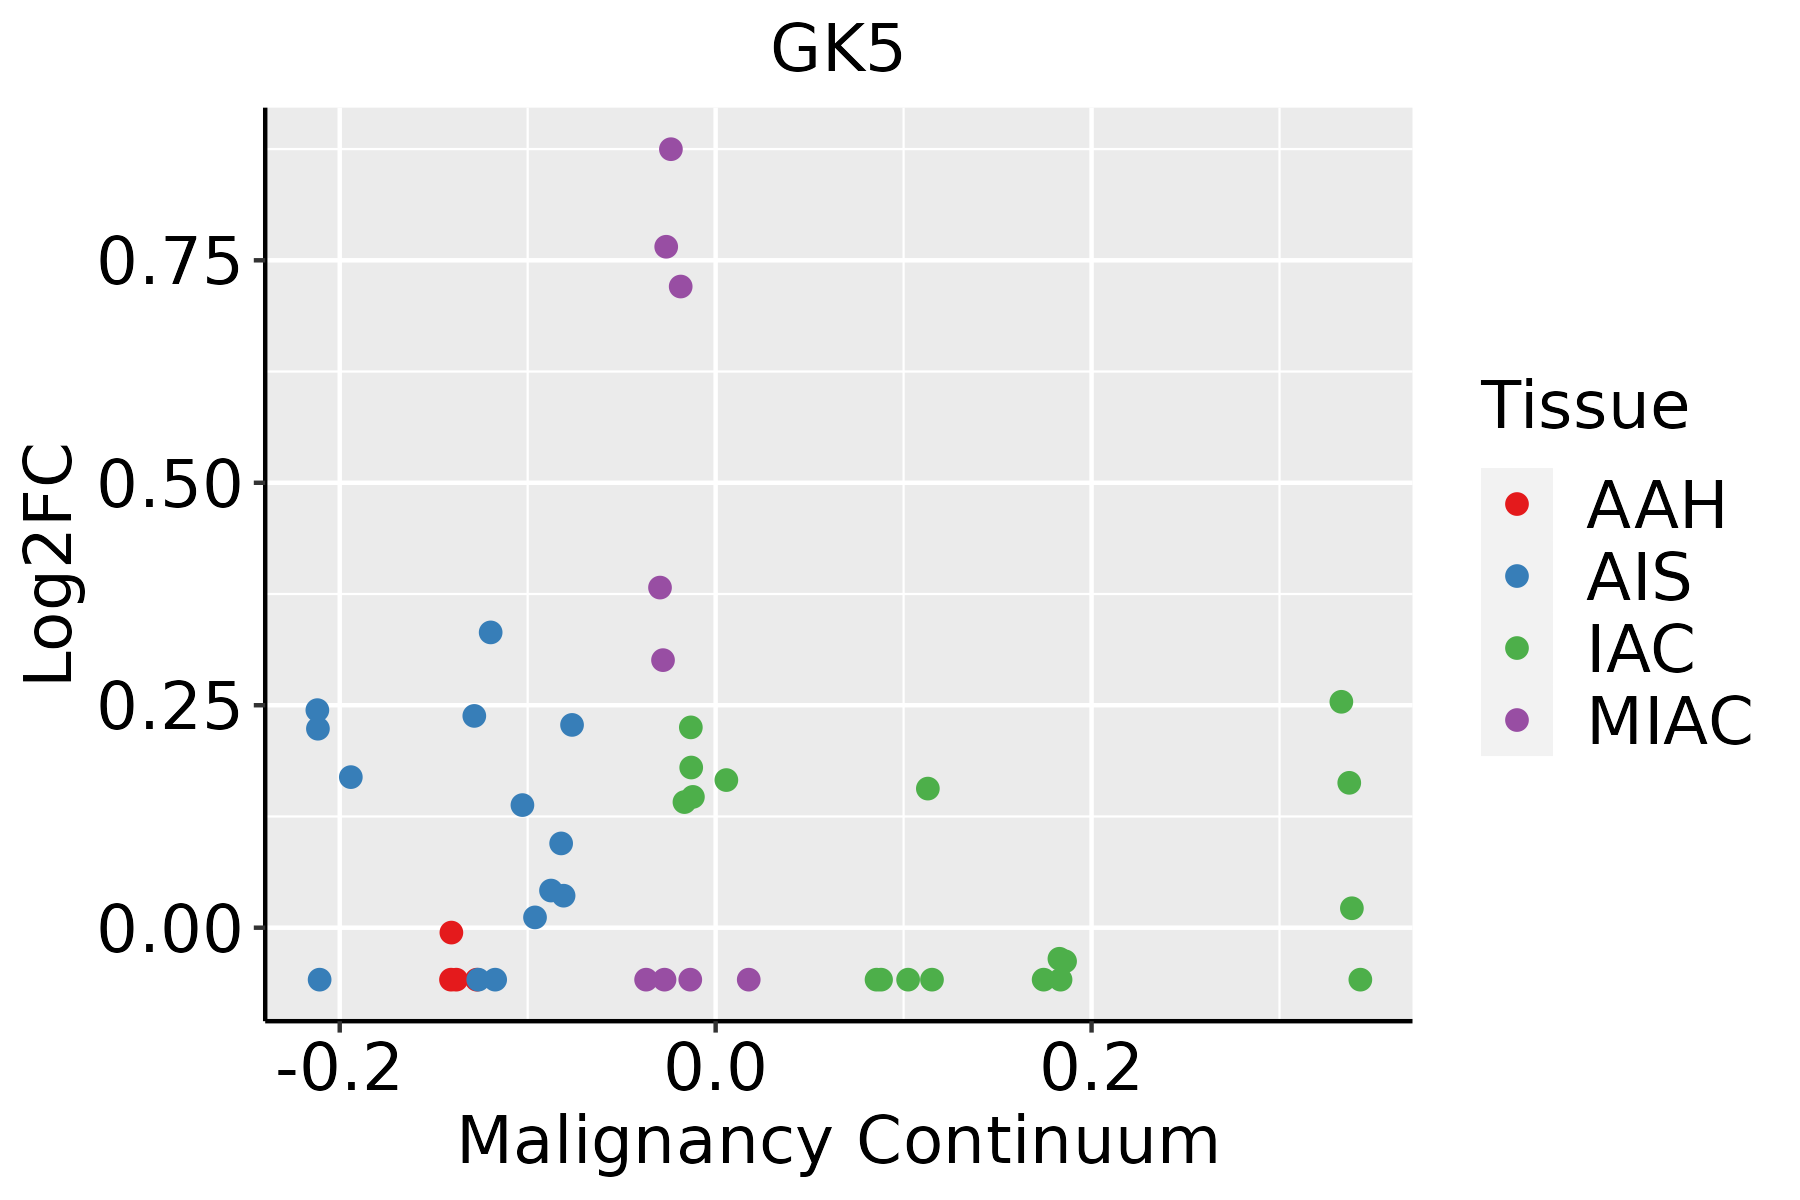 | AAH: Atypical adenomatous hyperplasia |
| AIS: Adenocarcinoma in situ |
| IAC: Invasive lung adenocarcinoma |
| MIA: Minimally invasive adenocarcinoma |
| Prostate |  | BPH: Benign Prostatic Hyperplasia |
| Thyroid | 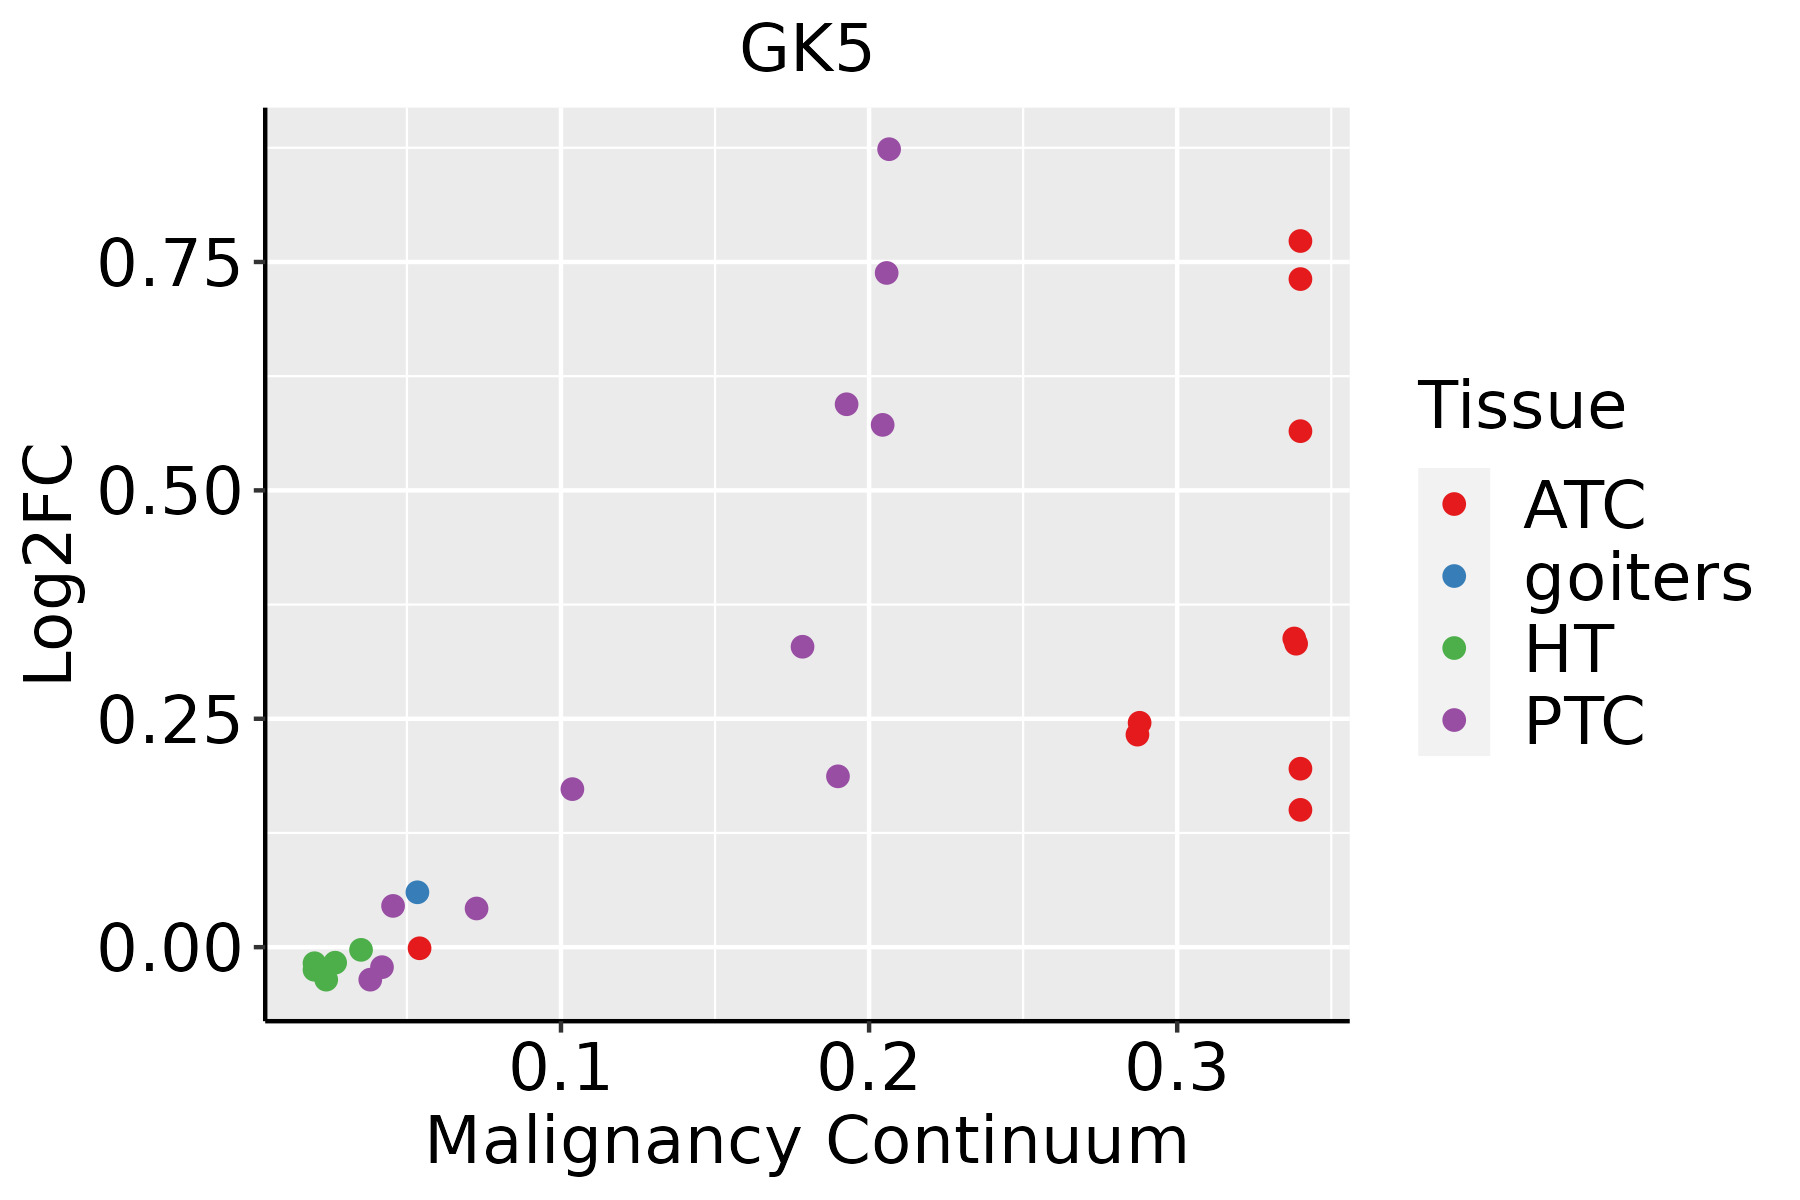 | ATC: Anaplastic thyroid cancer |
| HT: Hashimoto's thyroiditis |
| PTC: Papillary thyroid cancer |
| GO ID | Tissue | Disease Stage | Description | Gene Ratio | Bg Ratio | pvalue | p.adjust | Count |
| GO:00060668 | Esophagus | ESCC | alcohol metabolic process | 202/8552 | 353/18723 | 7.32e-06 | 7.26e-05 | 202 |
| GO:00442626 | Esophagus | ESCC | cellular carbohydrate metabolic process | 160/8552 | 283/18723 | 1.43e-04 | 9.66e-04 | 160 |
| GO:001605216 | Esophagus | ESCC | carbohydrate catabolic process | 91/8552 | 154/18723 | 5.39e-04 | 2.97e-03 | 91 |
| GO:00464864 | Esophagus | ESCC | glycerolipid metabolic process | 211/8552 | 392/18723 | 6.51e-04 | 3.46e-03 | 211 |
| GO:00442827 | Esophagus | ESCC | small molecule catabolic process | 201/8552 | 376/18723 | 1.35e-03 | 6.41e-03 | 201 |
| GO:00442751 | Esophagus | ESCC | cellular carbohydrate catabolic process | 27/8552 | 40/18723 | 4.39e-03 | 1.73e-02 | 27 |
| GO:004428221 | Liver | HCC | small molecule catabolic process | 225/7958 | 376/18723 | 6.50e-12 | 2.80e-10 | 225 |
| GO:000606621 | Liver | HCC | alcohol metabolic process | 208/7958 | 353/18723 | 2.80e-10 | 9.50e-09 | 208 |
| GO:001605222 | Liver | HCC | carbohydrate catabolic process | 99/7958 | 154/18723 | 3.79e-08 | 8.30e-07 | 99 |
| GO:004648611 | Liver | HCC | glycerolipid metabolic process | 215/7958 | 392/18723 | 4.54e-07 | 7.49e-06 | 215 |
| GO:004426221 | Liver | HCC | cellular carbohydrate metabolic process | 153/7958 | 283/18723 | 5.27e-05 | 5.00e-04 | 153 |
| GO:00066412 | Liver | HCC | triglyceride metabolic process | 59/7958 | 100/18723 | 6.35e-04 | 3.93e-03 | 59 |
| GO:000663911 | Liver | HCC | acylglycerol metabolic process | 72/7958 | 128/18723 | 1.16e-03 | 6.54e-03 | 72 |
| GO:000663811 | Liver | HCC | neutral lipid metabolic process | 72/7958 | 129/18723 | 1.54e-03 | 8.14e-03 | 72 |
| GO:00461642 | Liver | HCC | alcohol catabolic process | 33/7958 | 55/18723 | 6.63e-03 | 2.69e-02 | 33 |
| GO:0052646 | Liver | HCC | alditol phosphate metabolic process | 9/7958 | 11/18723 | 9.51e-03 | 3.60e-02 | 9 |
| GO:00160529 | Prostate | BPH | carbohydrate catabolic process | 40/3107 | 154/18723 | 2.00e-03 | 1.13e-02 | 40 |
| GO:00442624 | Prostate | BPH | cellular carbohydrate metabolic process | 66/3107 | 283/18723 | 2.06e-03 | 1.16e-02 | 66 |
| GO:0044275 | Prostate | BPH | cellular carbohydrate catabolic process | 13/3107 | 40/18723 | 1.01e-02 | 4.25e-02 | 13 |
| GO:001605214 | Prostate | Tumor | carbohydrate catabolic process | 42/3246 | 154/18723 | 1.35e-03 | 8.44e-03 | 42 |
| Hugo Symbol | Variant Class | Variant Classification | dbSNP RS | HGVSc | HGVSp | HGVSp Short | SWISSPROT | BIOTYPE | SIFT | PolyPhen | Tumor Sample Barcode | Tissue | Histology | Sex | Age | Stage | Therapy Types | Drugs | Outcome |
| GK5 | SNV | Missense_Mutation | rs771868963 | c.716N>T | p.Ser239Leu | p.S239L | Q6ZS86 | protein_coding | deleterious(0.01) | possibly_damaging(0.503) | TCGA-AN-A046-01 | Breast | breast invasive carcinoma | Female | >=65 | I/II | Unknown | Unknown | SD |
| GK5 | SNV | Missense_Mutation | | c.1264N>C | p.Glu422Gln | p.E422Q | Q6ZS86 | protein_coding | tolerated(0.11) | benign(0.314) | TCGA-E2-A14R-01 | Breast | breast invasive carcinoma | Female | <65 | I/II | Chemotherapy | doxorubicin | PD |
| GK5 | insertion | Nonsense_Mutation | novel | c.251_252insTGTCTTGTTCTATGTTATAAATTAATGATGCCACTTTC | p.Gln85ValfsTer8 | p.Q85Vfs*8 | Q6ZS86 | protein_coding | | | TCGA-A8-A0A1-01 | Breast | breast invasive carcinoma | Female | >=65 | I/II | Hormone Therapy | tamoxiphen | SD |
| GK5 | insertion | Frame_Shift_Ins | novel | c.1477_1478insTTTTGTTTTTGCTGTC | p.Arg493IlefsTer9 | p.R493Ifs*9 | Q6ZS86 | protein_coding | | | TCGA-AN-A03X-01 | Breast | breast invasive carcinoma | Female | >=65 | I/II | Unknown | Unknown | SD |
| GK5 | insertion | Frame_Shift_Ins | novel | c.1476_1477insGAGAGATTTATAGAGA | p.Arg493GlufsTer9 | p.R493Efs*9 | Q6ZS86 | protein_coding | | | TCGA-AN-A03X-01 | Breast | breast invasive carcinoma | Female | >=65 | I/II | Unknown | Unknown | SD |
| GK5 | SNV | Missense_Mutation | | c.1357G>T | p.Asp453Tyr | p.D453Y | Q6ZS86 | protein_coding | deleterious(0) | probably_damaging(0.998) | TCGA-2W-A8YY-01 | Cervix | cervical & endocervical cancer | Female | <65 | I/II | Chemotherapy | cisplatin | CR |
| GK5 | SNV | Missense_Mutation | rs377316725 | c.985N>A | p.Val329Ile | p.V329I | Q6ZS86 | protein_coding | tolerated(0.15) | benign(0.053) | TCGA-C5-A1M9-01 | Cervix | cervical & endocervical cancer | Female | <65 | I/II | Chemotherapy | cisplatin | PD |
| GK5 | SNV | Missense_Mutation | novel | c.707N>T | p.Ser236Phe | p.S236F | Q6ZS86 | protein_coding | tolerated(0.31) | benign(0.021) | TCGA-JW-A5VL-01 | Cervix | cervical & endocervical cancer | Female | <65 | I/II | Unknown | Unknown | SD |
| GK5 | SNV | Missense_Mutation | | c.326N>A | p.Gly109Glu | p.G109E | Q6ZS86 | protein_coding | deleterious(0.01) | probably_damaging(0.986) | TCGA-AA-3510-01 | Colorectum | colon adenocarcinoma | Male | >=65 | I/II | Unknown | Unknown | SD |
| GK5 | SNV | Missense_Mutation | | c.740N>A | p.Pro247His | p.P247H | Q6ZS86 | protein_coding | deleterious(0.02) | possibly_damaging(0.852) | TCGA-AA-3663-01 | Colorectum | colon adenocarcinoma | Male | <65 | I/II | Unknown | Unknown | SD |


