
|
|||||
|
 | |
| |
| |
| |
| |
| |
|
Gene: GJC1 |
Gene summary for GJC1 |
| Gene information | Species | Human | Gene symbol | GJC1 | Gene ID | 10052 |
| Gene name | gap junction protein gamma 1 | |
| Gene Alias | CX45 | |
| Cytomap | 17q21.31 | |
| Gene Type | protein-coding | GO ID | GO:0001508 | UniProtAcc | P36383 |
Top |
Malignant transformation analysis |
| Identification of the aberrant gene expression in precancerous and cancerous lesions by comparing the gene expression of stem-like cells in diseased tissues with normal stem cells |
| Entrez ID | Symbol | Replicates | Species | Organ | Tissue | Adj P-value | Log2FC | Malignancy |
| 10052 | GJC1 | HCC1 | Human | Liver | HCC | 4.31e-18 | 2.00e+00 | 0.5336 |
| 10052 | GJC1 | HCC2 | Human | Liver | HCC | 1.28e-27 | 2.21e+00 | 0.5341 |
| 10052 | GJC1 | HCC5 | Human | Liver | HCC | 1.44e-24 | 1.68e+00 | 0.4932 |
| 10052 | GJC1 | Pt13.b | Human | Liver | HCC | 2.33e-17 | 4.56e-01 | 0.0251 |
| Page: 1 |
| Tissue | Expression Dynamics | Abbreviation |
| Liver | 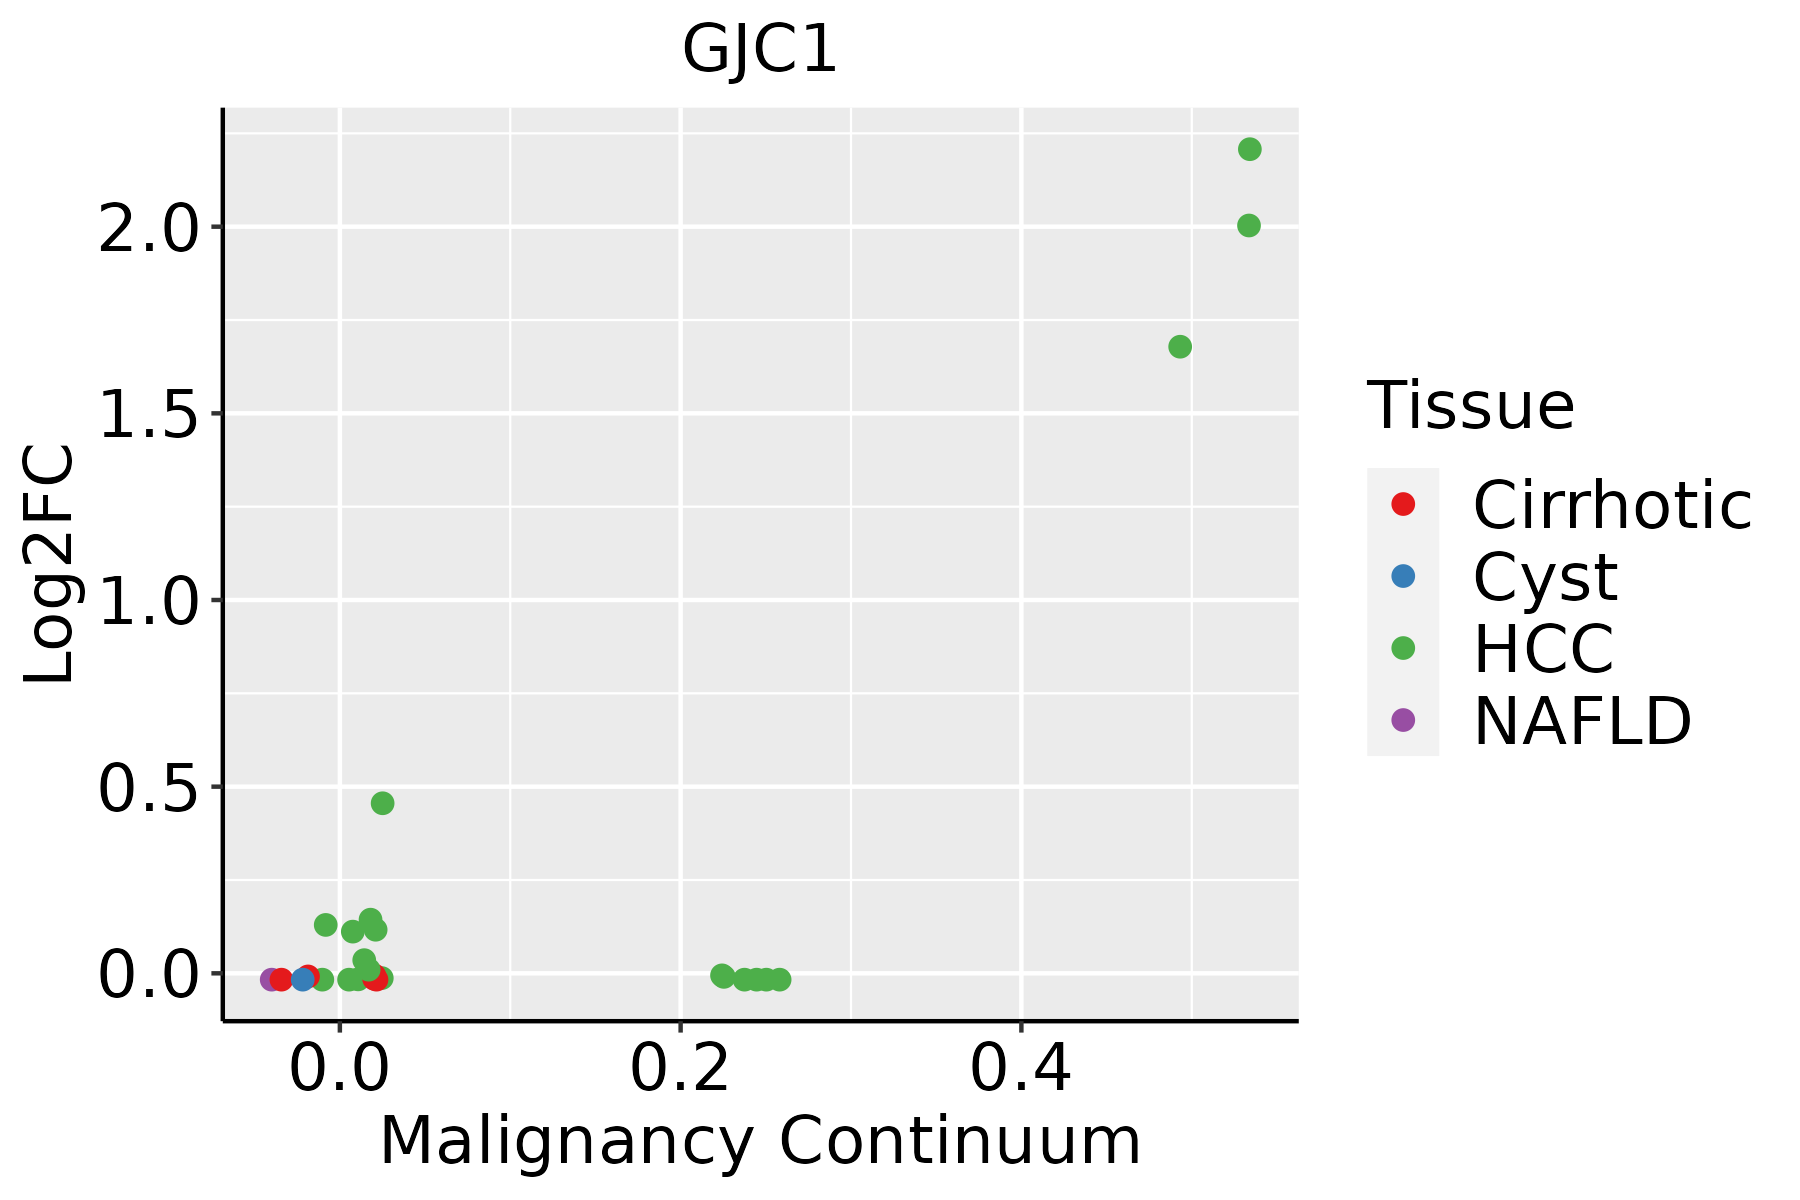 | HCC: Hepatocellular carcinoma |
| NAFLD: Non-alcoholic fatty liver disease |
| ∗log2FC in expression of this searched gene in stem-like cells from each diseased tissue sample relative to stem-like cells in normal samples in each tissue plotted against the malignancy continuum. Samples are colored based on if they are from different disease stage. |
Top |
Malignant transformation related pathway analysis |
| Find out the enriched GO biological processes and KEGG pathways involved in transition from healthy to precancer to cancer |
| Tissue | Disease Stage | Enriched GO biological Processes |
| Colorectum | AD |  |
| Colorectum | SER |  |
| Colorectum | MSS |  |
| Colorectum | MSI-H |  |
| Colorectum | FAP |  |
| ∗Top 15 enriched GO BP terms are showed in the bar plot of each disease state in each tissue. Each row represents a significant GO biological process which is colored according to the -log10(p.adjust). |
| Page: 1 2 3 4 5 6 7 8 9 |
| GO ID | Tissue | Disease Stage | Description | Gene Ratio | Bg Ratio | pvalue | p.adjust | Count |
| GO:004521622 | Liver | HCC | cell-cell junction organization | 107/7958 | 200/18723 | 1.06e-03 | 6.11e-03 | 107 |
| GO:00860642 | Liver | HCC | cell communication by electrical coupling involved in cardiac conduction | 17/7958 | 25/18723 | 8.94e-03 | 3.45e-02 | 17 |
| GO:000704312 | Liver | HCC | cell-cell junction assembly | 76/7958 | 146/18723 | 1.23e-02 | 4.47e-02 | 76 |
| Page: 1 |
| Pathway ID | Tissue | Disease Stage | Description | Gene Ratio | Bg Ratio | pvalue | p.adjust | qvalue | Count |
| Page: 1 |
Top |
Cell-cell communication analysis |
| Identification of potential cell-cell interactions between two cell types and their ligand-receptor pairs for different disease states |
| Ligand | Receptor | LRpair | Pathway | Tissue | Disease Stage |
| Page: 1 |
Top |
Single-cell gene regulatory network inference analysis |
| Find out the significant the regulons (TFs) and the target genes of each regulon across cell types for different disease states |
| TF | Cell Type | Tissue | Disease Stage | Target Gene | RSS | Regulon Activity |
| ∗The dot plots of a searched regulon are shown for all cell subpopulations in each disease state of each tissue based on the regulon specific score inferred using pySCENIC and by calculating the average expression. |
| Page: 1 |
Top |
Somatic mutation of malignant transformation related genes |
| Annotation of somatic variants for genes involved in malignant transformation |
| Hugo Symbol | Variant Class | Variant Classification | dbSNP RS | HGVSc | HGVSp | HGVSp Short | SWISSPROT | BIOTYPE | SIFT | PolyPhen | Tumor Sample Barcode | Tissue | Histology | Sex | Age | Stage | Therapy Types | Drugs | Outcome |
| GJC1 | SNV | Missense_Mutation | c.36N>C | p.Glu12Asp | p.E12D | P36383 | protein_coding | deleterious(0) | probably_damaging(0.998) | TCGA-A8-A079-01 | Breast | breast invasive carcinoma | Female | >=65 | III/IV | Chemotherapy | 5-fluorouracil | SD | |
| GJC1 | SNV | Missense_Mutation | novel | c.7N>A | p.Trp3Arg | p.W3R | P36383 | protein_coding | deleterious(0) | probably_damaging(1) | TCGA-A8-A0A4-01 | Breast | breast invasive carcinoma | Female | >=65 | I/II | Hormone Therapy | tamoxiphen | CR |
| GJC1 | SNV | Missense_Mutation | novel | c.358N>T | p.Arg120Cys | p.R120C | P36383 | protein_coding | tolerated(0.2) | benign(0.003) | TCGA-BH-A6R8-01 | Breast | breast invasive carcinoma | Female | <65 | I/II | Unknown | Unknown | SD |
| GJC1 | insertion | In_Frame_Ins | novel | c.4_5insAAGTGGGGTCCAAAGCTGGGTCCAACAAAAGCACTGCCA | p.Met1_Ser2insLysValGlySerLysAlaGlySerAsnLysSerThrAla | p.M1_S2insKVGSKAGSNKSTA | P36383 | protein_coding | TCGA-A8-A0A4-01 | Breast | breast invasive carcinoma | Female | >=65 | I/II | Hormone Therapy | tamoxiphen | CR | ||
| GJC1 | deletion | Frame_Shift_Del | c.1131delN | p.Ser378ProfsTer34 | p.S378Pfs*34 | P36383 | protein_coding | TCGA-AN-A0AK-01 | Breast | breast invasive carcinoma | Female | >=65 | I/II | Unknown | Unknown | SD | |||
| GJC1 | insertion | Frame_Shift_Ins | novel | c.126_127insTACCCCCACCAAAAAAAAGAAACTC | p.Ile43TyrfsTer13 | p.I43Yfs*13 | P36383 | protein_coding | TCGA-AN-A0FK-01 | Breast | breast invasive carcinoma | Female | >=65 | III/IV | Unknown | Unknown | SD | ||
| GJC1 | deletion | Frame_Shift_Del | novel | c.917delN | p.Asn306MetfsTer106 | p.N306Mfs*106 | P36383 | protein_coding | TCGA-D8-A27V-01 | Breast | breast invasive carcinoma | Female | <65 | I/II | Hormone Therapy | tamoxiphen | SD | ||
| GJC1 | SNV | Missense_Mutation | c.690N>G | p.Ile230Met | p.I230M | P36383 | protein_coding | deleterious(0) | probably_damaging(0.983) | TCGA-C5-A1BQ-01 | Cervix | cervical & endocervical cancer | Female | >=65 | III/IV | Chemotherapy | cisplatin | CR | |
| GJC1 | SNV | Missense_Mutation | rs776242102 | c.23N>A | p.Arg8His | p.R8H | P36383 | protein_coding | deleterious(0) | possibly_damaging(0.868) | TCGA-A6-6651-01 | Colorectum | colon adenocarcinoma | Female | <65 | III/IV | Ancillary | leucovorin | SD |
| GJC1 | SNV | Missense_Mutation | c.136N>A | p.Asp46Asn | p.D46N | P36383 | protein_coding | deleterious(0) | probably_damaging(0.999) | TCGA-AA-3977-01 | Colorectum | colon adenocarcinoma | Male | >=65 | I/II | Unknown | Unknown | SD |
| Page: 1 2 3 4 5 6 7 8 |
Top |
Related drugs of malignant transformation related genes |
| Identification of chemicals and drugs interact with genes involved in malignant transfromation |
| (DGIdb 4.0) |
| Entrez ID | Symbol | Category | Interaction Types | Drug Claim Name | Drug Name | PMIDs |
| 10052 | GJC1 | ION CHANNEL | inhibitor | 135650269 | ||
| 10052 | GJC1 | ION CHANNEL | inhibitor | 178101095 | OCTANOL | |
| 10052 | GJC1 | ION CHANNEL | inhibitor | 178100972 | CARBENOXOLONE | |
| 10052 | GJC1 | ION CHANNEL | inhibitor | 135652731 |
| Page: 1 |

Copyright 2023-Present -The University of Texas Health Science Center at Houston |