
|
|||||
|
 | |
| |
| |
| |
| |
| |
|
Gene: GJB6 |
Gene summary for GJB6 |
| Gene information | Species | Human | Gene symbol | GJB6 | Gene ID | 10804 |
| Gene name | gap junction protein beta 6 | |
| Gene Alias | CX30 | |
| Cytomap | 13q12.11 | |
| Gene Type | protein-coding | GO ID | GO:0001678 | UniProtAcc | A0A024RDS4 |
Top |
Malignant transformation analysis |
| Identification of the aberrant gene expression in precancerous and cancerous lesions by comparing the gene expression of stem-like cells in diseased tissues with normal stem cells |
| Entrez ID | Symbol | Replicates | Species | Organ | Tissue | Adj P-value | Log2FC | Malignancy |
| 10804 | GJB6 | CA_HPV_3 | Human | Cervix | CC | 1.70e-04 | 2.20e-01 | 0.0414 |
| 10804 | GJB6 | Tumor | Human | Cervix | CC | 3.45e-33 | 7.51e-01 | 0.1241 |
| 10804 | GJB6 | sample3 | Human | Cervix | CC | 2.43e-46 | 8.68e-01 | 0.1387 |
| 10804 | GJB6 | L1 | Human | Cervix | CC | 1.77e-04 | 4.03e-01 | 0.0802 |
| 10804 | GJB6 | T3 | Human | Cervix | CC | 7.50e-49 | 8.92e-01 | 0.1389 |
| 10804 | GJB6 | LZE4T | Human | Esophagus | ESCC | 6.82e-15 | 9.63e-01 | 0.0811 |
| 10804 | GJB6 | LZE8T | Human | Esophagus | ESCC | 1.85e-02 | 6.72e-02 | 0.067 |
| 10804 | GJB6 | P4T-E | Human | Esophagus | ESCC | 1.24e-22 | 1.03e+00 | 0.1323 |
| 10804 | GJB6 | P5T-E | Human | Esophagus | ESCC | 4.84e-03 | 1.77e-01 | 0.1327 |
| 10804 | GJB6 | P9T-E | Human | Esophagus | ESCC | 9.17e-12 | 5.77e-01 | 0.1131 |
| 10804 | GJB6 | P10T-E | Human | Esophagus | ESCC | 2.89e-56 | 1.78e+00 | 0.116 |
| 10804 | GJB6 | P11T-E | Human | Esophagus | ESCC | 3.94e-05 | 1.37e+00 | 0.1426 |
| 10804 | GJB6 | P12T-E | Human | Esophagus | ESCC | 5.96e-13 | 4.10e-01 | 0.1122 |
| 10804 | GJB6 | P15T-E | Human | Esophagus | ESCC | 8.60e-13 | 5.03e-01 | 0.1149 |
| 10804 | GJB6 | P17T-E | Human | Esophagus | ESCC | 4.06e-06 | 1.35e+00 | 0.1278 |
| 10804 | GJB6 | P19T-E | Human | Esophagus | ESCC | 3.03e-02 | 1.15e+00 | 0.1662 |
| 10804 | GJB6 | P21T-E | Human | Esophagus | ESCC | 1.41e-30 | 1.07e+00 | 0.1617 |
| 10804 | GJB6 | P22T-E | Human | Esophagus | ESCC | 8.30e-55 | 1.50e+00 | 0.1236 |
| 10804 | GJB6 | P23T-E | Human | Esophagus | ESCC | 4.44e-06 | 2.76e-01 | 0.108 |
| 10804 | GJB6 | P26T-E | Human | Esophagus | ESCC | 1.38e-14 | 4.91e-01 | 0.1276 |
| Page: 1 2 3 4 |
| Tissue | Expression Dynamics | Abbreviation |
| Cervix |  | CC: Cervix cancer |
| HSIL_HPV: HPV-infected high-grade squamous intraepithelial lesions | ||
| N_HPV: HPV-infected normal cervix | ||
| Esophagus | 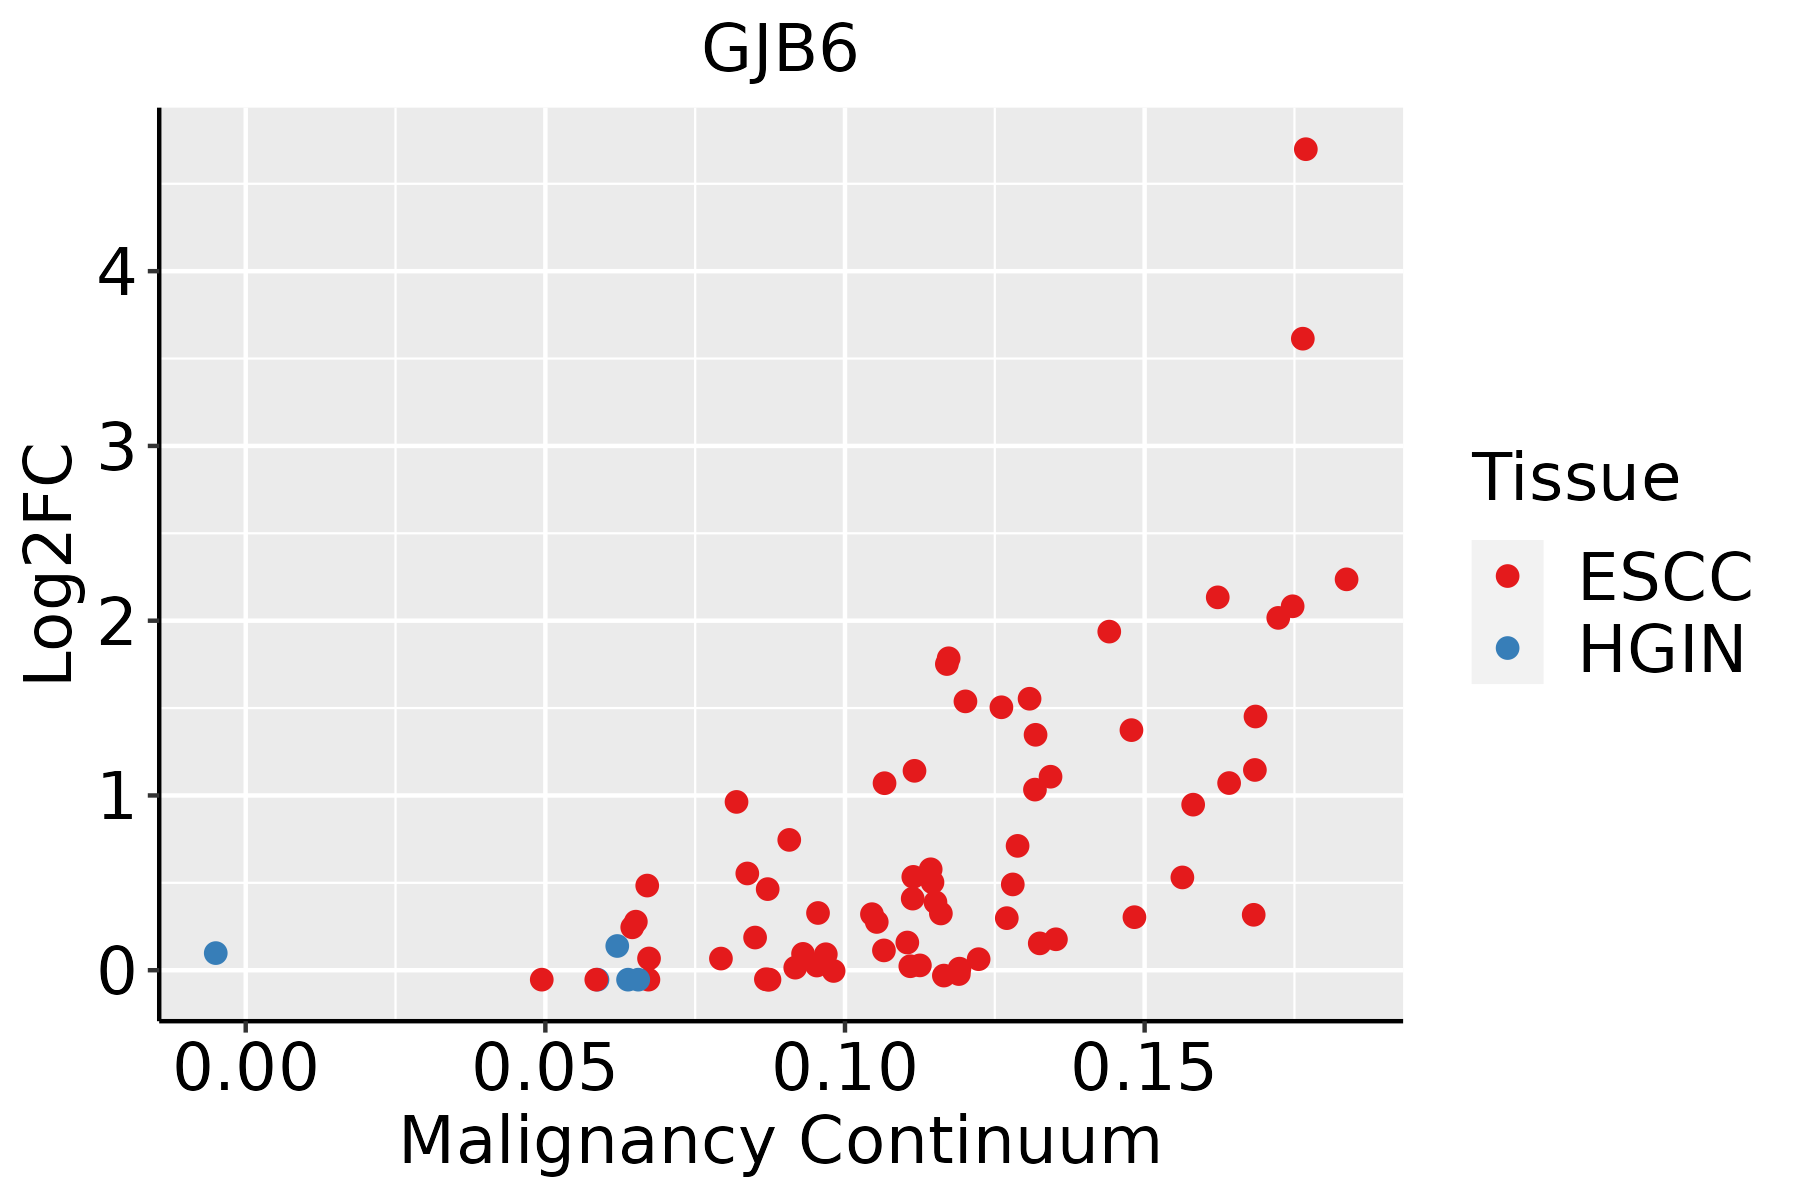 | ESCC: Esophageal squamous cell carcinoma |
| HGIN: High-grade intraepithelial neoplasias | ||
| LGIN: Low-grade intraepithelial neoplasias | ||
| Liver | 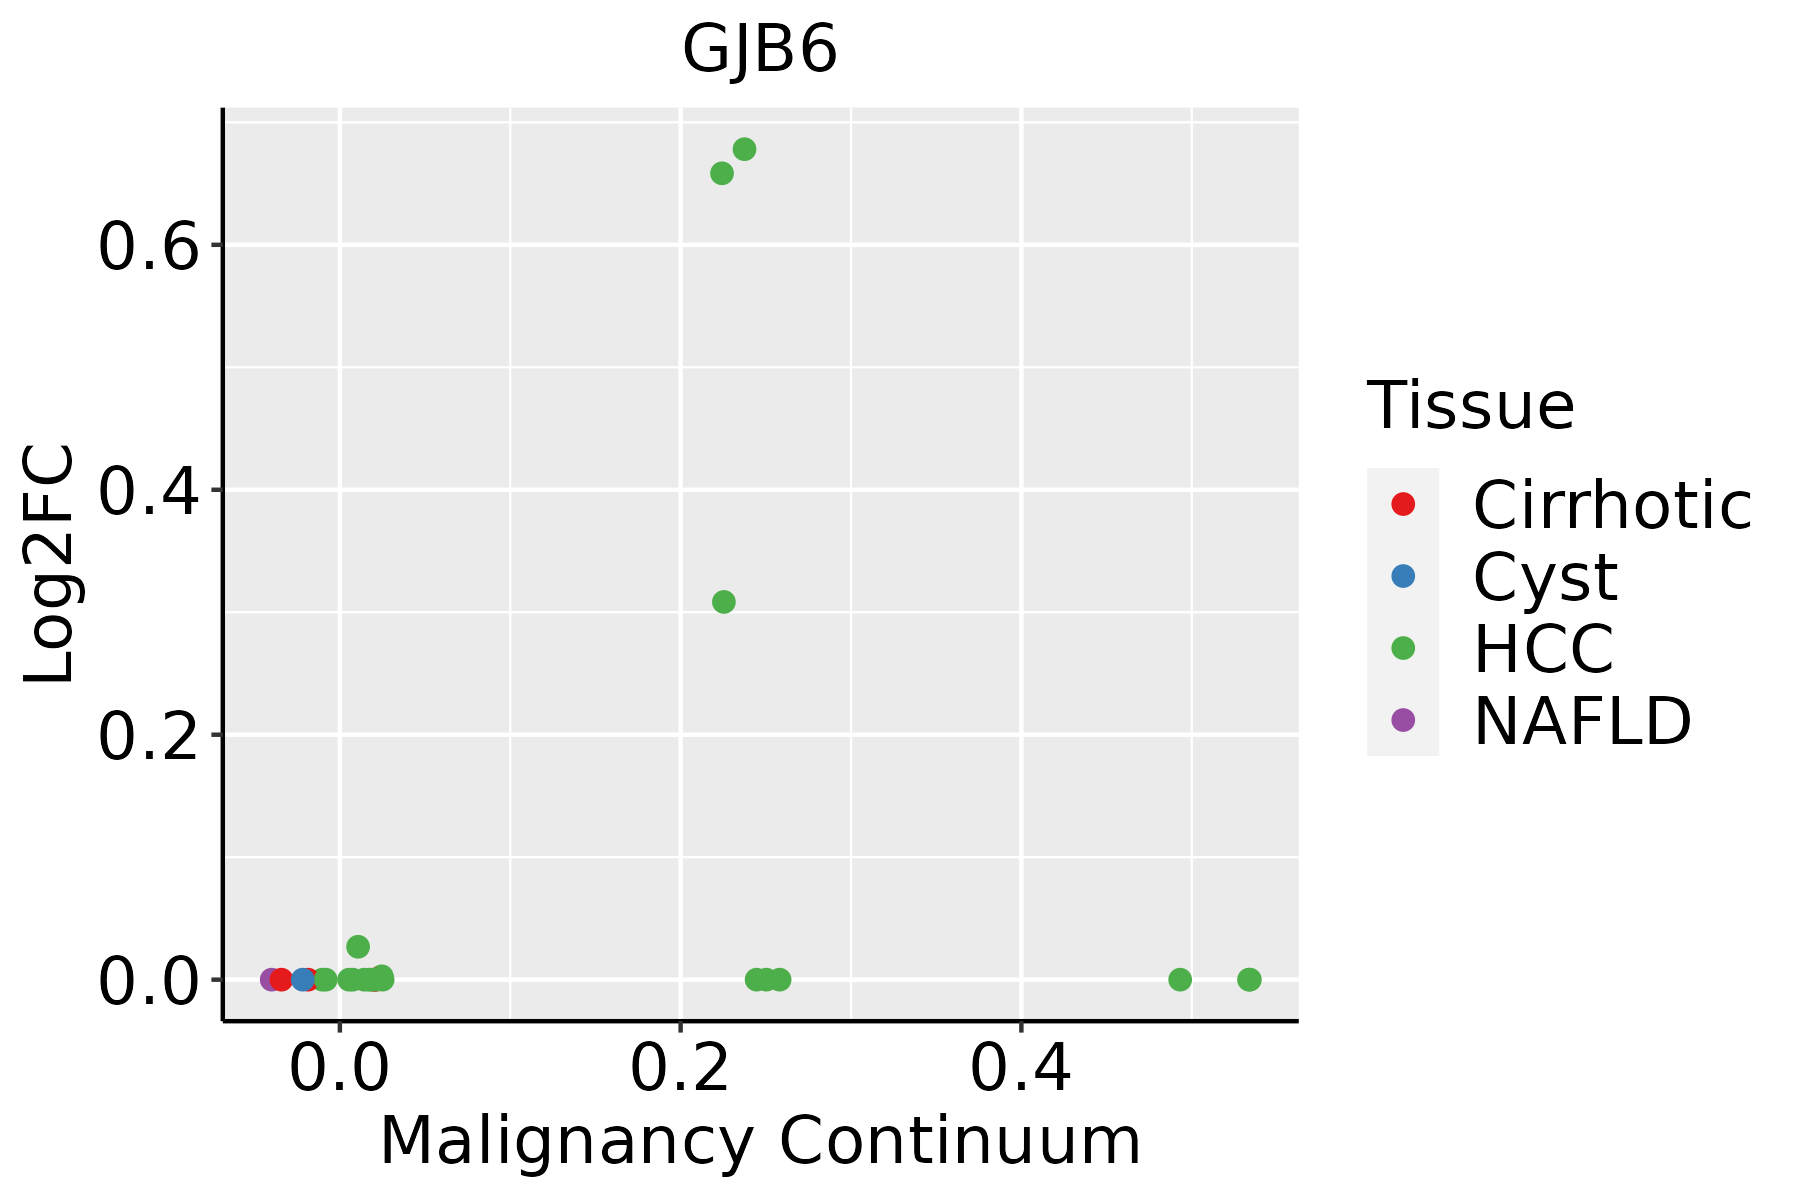 | HCC: Hepatocellular carcinoma |
| NAFLD: Non-alcoholic fatty liver disease | ||
| Oral Cavity |  | EOLP: Erosive Oral lichen planus |
| LP: leukoplakia | ||
| NEOLP: Non-erosive oral lichen planus | ||
| OSCC: Oral squamous cell carcinoma | ||
| Skin | 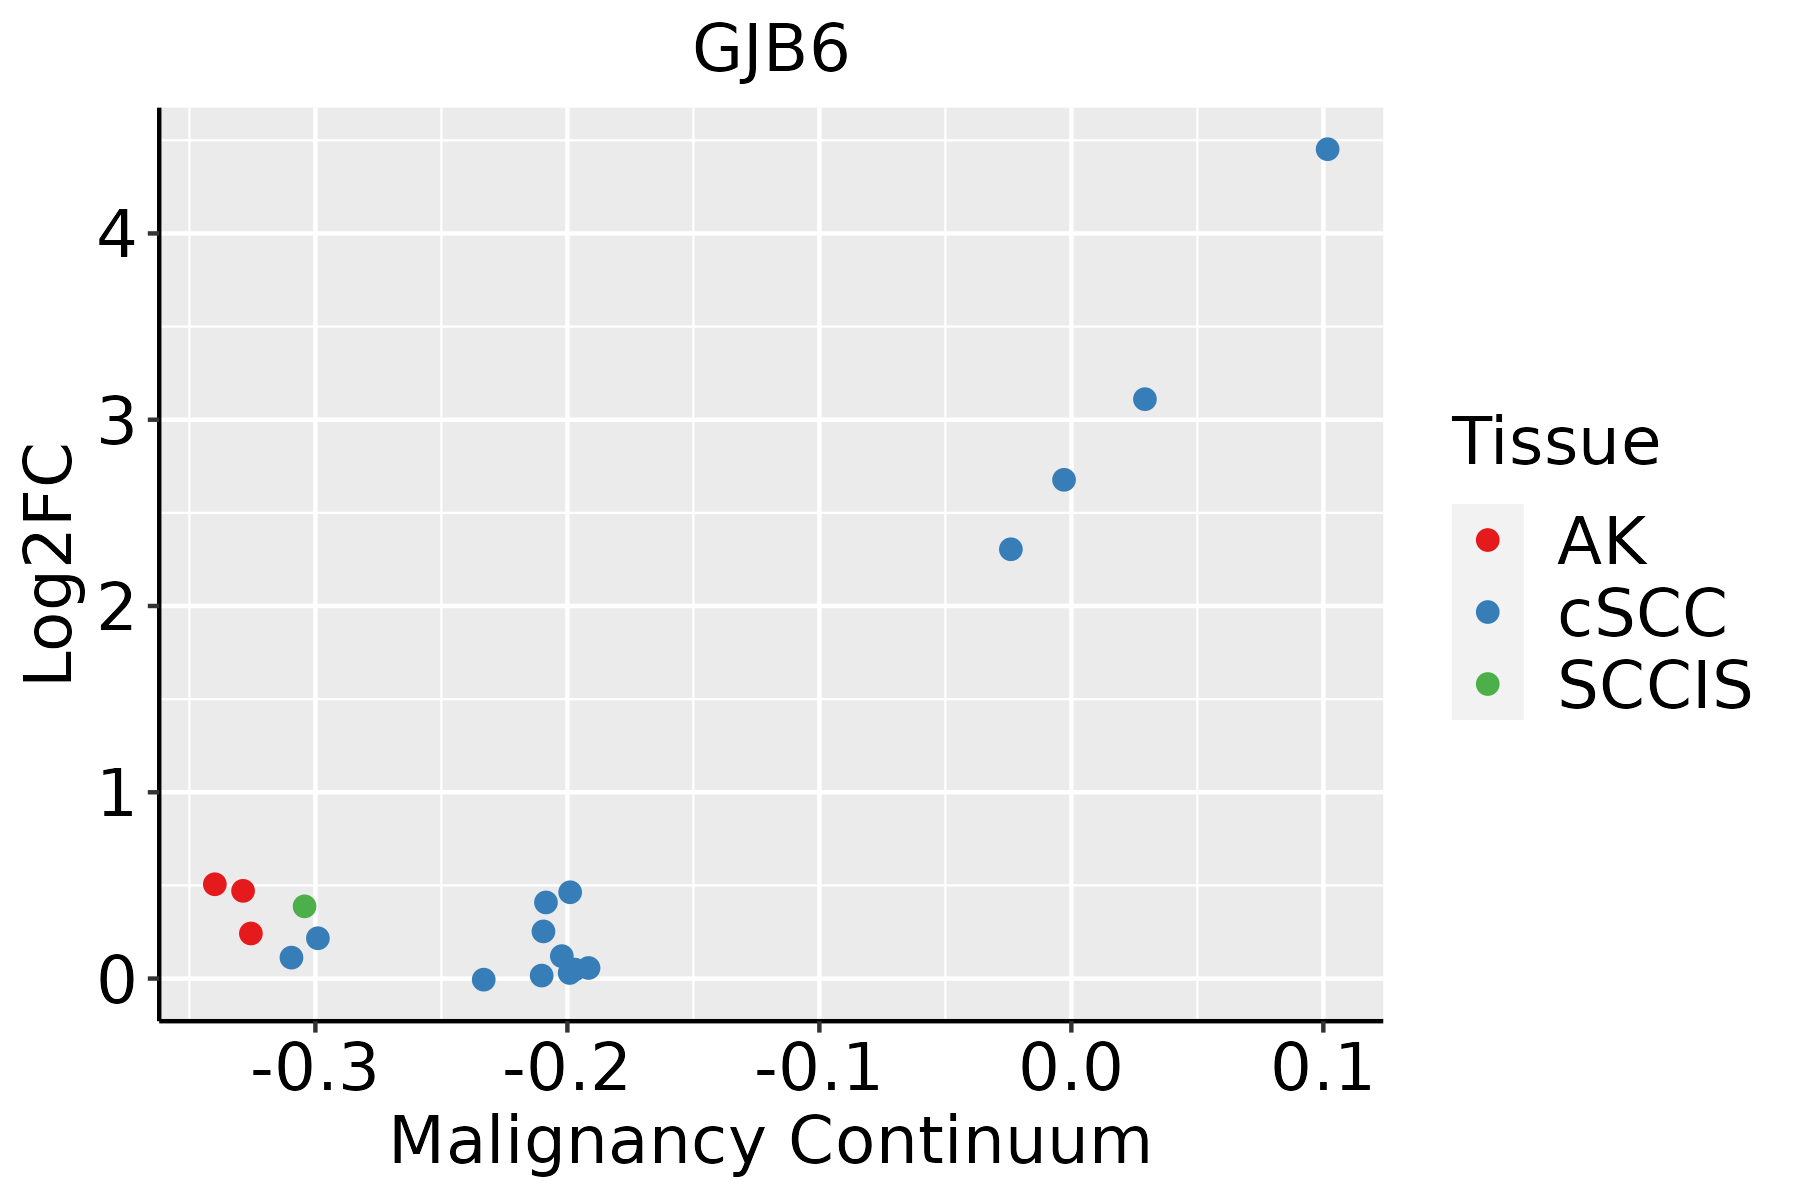 | AK: Actinic keratosis |
| cSCC: Cutaneous squamous cell carcinoma | ||
| SCCIS:squamous cell carcinoma in situ |
| ∗log2FC in expression of this searched gene in stem-like cells from each diseased tissue sample relative to stem-like cells in normal samples in each tissue plotted against the malignancy continuum. Samples are colored based on if they are from different disease stage. |
Top |
Malignant transformation related pathway analysis |
| Find out the enriched GO biological processes and KEGG pathways involved in transition from healthy to precancer to cancer |
| Tissue | Disease Stage | Enriched GO biological Processes |
| Colorectum | AD |  |
| Colorectum | SER |  |
| Colorectum | MSS |  |
| Colorectum | MSI-H |  |
| Colorectum | FAP |  |
| ∗Top 15 enriched GO BP terms are showed in the bar plot of each disease state in each tissue. Each row represents a significant GO biological process which is colored according to the -log10(p.adjust). |
| Page: 1 2 3 4 5 6 7 8 9 |
| GO ID | Tissue | Disease Stage | Description | Gene Ratio | Bg Ratio | pvalue | p.adjust | Count |
| GO:00452169 | Cervix | CC | cell-cell junction organization | 53/2311 | 200/18723 | 3.83e-08 | 2.53e-06 | 53 |
| GO:00075689 | Cervix | CC | aging | 75/2311 | 339/18723 | 2.75e-07 | 1.13e-05 | 75 |
| GO:00343298 | Cervix | CC | cell junction assembly | 88/2311 | 420/18723 | 3.42e-07 | 1.38e-05 | 88 |
| GO:00022379 | Cervix | CC | response to molecule of bacterial origin | 78/2311 | 363/18723 | 5.55e-07 | 2.06e-05 | 78 |
| GO:00324969 | Cervix | CC | response to lipopolysaccharide | 74/2311 | 343/18723 | 9.15e-07 | 3.25e-05 | 74 |
| GO:00070439 | Cervix | CC | cell-cell junction assembly | 39/2311 | 146/18723 | 1.86e-06 | 5.94e-05 | 39 |
| GO:00018949 | Cervix | CC | tissue homeostasis | 57/2311 | 268/18723 | 2.43e-05 | 4.21e-04 | 57 |
| GO:00602498 | Cervix | CC | anatomical structure homeostasis | 63/2311 | 314/18723 | 6.03e-05 | 8.68e-04 | 63 |
| GO:000974310 | Cervix | CC | response to carbohydrate | 53/2311 | 253/18723 | 7.02e-05 | 9.85e-04 | 53 |
| GO:003428410 | Cervix | CC | response to monosaccharide | 48/2311 | 225/18723 | 9.48e-05 | 1.25e-03 | 48 |
| GO:00605375 | Cervix | CC | muscle tissue development | 76/2311 | 403/18723 | 9.76e-05 | 1.27e-03 | 76 |
| GO:00147064 | Cervix | CC | striated muscle tissue development | 72/2311 | 384/18723 | 1.76e-04 | 2.07e-03 | 72 |
| GO:00106444 | Cervix | CC | cell communication by electrical coupling | 12/2311 | 32/18723 | 2.53e-04 | 2.79e-03 | 12 |
| GO:000974610 | Cervix | CC | response to hexose | 45/2311 | 219/18723 | 3.73e-04 | 3.86e-03 | 45 |
| GO:00356336 | Cervix | CC | maintenance of blood-brain barrier | 12/2311 | 35/18723 | 6.55e-04 | 6.05e-03 | 12 |
| GO:00425939 | Cervix | CC | glucose homeostasis | 50/2311 | 258/18723 | 7.57e-04 | 6.76e-03 | 50 |
| GO:00335009 | Cervix | CC | carbohydrate homeostasis | 50/2311 | 259/18723 | 8.28e-04 | 7.22e-03 | 50 |
| GO:00016788 | Cervix | CC | cellular glucose homeostasis | 36/2311 | 172/18723 | 9.65e-04 | 8.09e-03 | 36 |
| GO:00097499 | Cervix | CC | response to glucose | 42/2311 | 212/18723 | 1.23e-03 | 9.87e-03 | 42 |
| GO:00713229 | Cervix | CC | cellular response to carbohydrate stimulus | 33/2311 | 163/18723 | 2.71e-03 | 1.85e-02 | 33 |
| Page: 1 2 3 4 5 6 |
| Pathway ID | Tissue | Disease Stage | Description | Gene Ratio | Bg Ratio | pvalue | p.adjust | qvalue | Count |
| Page: 1 |
Top |
Cell-cell communication analysis |
| Identification of potential cell-cell interactions between two cell types and their ligand-receptor pairs for different disease states |
| Ligand | Receptor | LRpair | Pathway | Tissue | Disease Stage |
| Page: 1 |
Top |
Single-cell gene regulatory network inference analysis |
| Find out the significant the regulons (TFs) and the target genes of each regulon across cell types for different disease states |
| TF | Cell Type | Tissue | Disease Stage | Target Gene | RSS | Regulon Activity |
| ∗The dot plots of a searched regulon are shown for all cell subpopulations in each disease state of each tissue based on the regulon specific score inferred using pySCENIC and by calculating the average expression. |
| Page: 1 |
Top |
Somatic mutation of malignant transformation related genes |
| Annotation of somatic variants for genes involved in malignant transformation |
| Hugo Symbol | Variant Class | Variant Classification | dbSNP RS | HGVSc | HGVSp | HGVSp Short | SWISSPROT | BIOTYPE | SIFT | PolyPhen | Tumor Sample Barcode | Tissue | Histology | Sex | Age | Stage | Therapy Types | Drugs | Outcome |
| GJB6 | SNV | Missense_Mutation | c.202N>A | p.Phe68Ile | p.F68I | O95452 | protein_coding | tolerated(0.07) | possibly_damaging(0.847) | TCGA-E9-A22G-01 | Breast | breast invasive carcinoma | Female | <65 | I/II | Chemotherapy | doxorubicin | SD | |
| GJB6 | SNV | Missense_Mutation | rs571454176 | c.301N>A | p.Glu101Lys | p.E101K | O95452 | protein_coding | tolerated(0.33) | benign(0.089) | TCGA-AA-3510-01 | Colorectum | colon adenocarcinoma | Male | >=65 | I/II | Unknown | Unknown | SD |
| GJB6 | SNV | Missense_Mutation | c.409N>G | p.Thr137Ala | p.T137A | O95452 | protein_coding | deleterious(0.04) | benign(0.02) | TCGA-CA-6718-01 | Colorectum | colon adenocarcinoma | Male | <65 | I/II | Unknown | Unknown | PD | |
| GJB6 | SNV | Missense_Mutation | c.596C>A | p.Ser199Tyr | p.S199Y | O95452 | protein_coding | deleterious(0) | probably_damaging(1) | TCGA-AP-A056-01 | Endometrium | uterine corpus endometrioid carcinoma | Female | <65 | I/II | Unknown | Unknown | SD | |
| GJB6 | SNV | Missense_Mutation | rs200881320 | c.593C>T | p.Ala198Val | p.A198V | O95452 | protein_coding | tolerated(0.28) | benign(0.014) | TCGA-AX-A0J0-01 | Endometrium | uterine corpus endometrioid carcinoma | Female | <65 | I/II | Unknown | Unknown | SD |
| GJB6 | SNV | Missense_Mutation | novel | c.305C>T | p.Thr102Ile | p.T102I | O95452 | protein_coding | tolerated(0.08) | benign(0.062) | TCGA-AX-A2HD-01 | Endometrium | uterine corpus endometrioid carcinoma | Female | >=65 | III/IV | Unknown | Unknown | SD |
| GJB6 | SNV | Missense_Mutation | rs28937872 | c.263N>T | p.Ala88Val | p.A88V | O95452 | protein_coding | deleterious(0) | probably_damaging(0.989) | TCGA-AX-A2HJ-01 | Endometrium | uterine corpus endometrioid carcinoma | Female | <65 | I/II | Unknown | Unknown | SD |
| GJB6 | SNV | Missense_Mutation | rs104894414 | c.14N>T | p.Thr5Met | p.T5M | O95452 | protein_coding | tolerated(0.11) | probably_damaging(0.927) | TCGA-B5-A0JR-01 | Endometrium | uterine corpus endometrioid carcinoma | Female | >=65 | I/II | Unknown | Unknown | SD |
| GJB6 | SNV | Missense_Mutation | novel | c.457N>C | p.Val153Leu | p.V153L | O95452 | protein_coding | tolerated(0.93) | benign(0.001) | TCGA-B5-A3FC-01 | Endometrium | uterine corpus endometrioid carcinoma | Female | <65 | I/II | Unknown | Unknown | SD |
| GJB6 | SNV | Missense_Mutation | novel | c.337N>G | p.Asn113Asp | p.N113D | O95452 | protein_coding | tolerated(0.49) | benign(0) | TCGA-BG-A222-01 | Endometrium | uterine corpus endometrioid carcinoma | Female | <65 | I/II | Unknown | Unknown | SD |
| Page: 1 2 3 |
Top |
Related drugs of malignant transformation related genes |
| Identification of chemicals and drugs interact with genes involved in malignant transfromation |
| (DGIdb 4.0) |
| Entrez ID | Symbol | Category | Interaction Types | Drug Claim Name | Drug Name | PMIDs |
| 10804 | GJB6 | ION CHANNEL | inhibitor | 178101095 | OCTANOL | |
| 10804 | GJB6 | ION CHANNEL | inhibitor | 135650269 | ||
| 10804 | GJB6 | ION CHANNEL | inhibitor | 178100972 | CARBENOXOLONE | |
| 10804 | GJB6 | ION CHANNEL | inhibitor | 135652731 |
| Page: 1 |

Copyright 2023-Present -The University of Texas Health Science Center at Houston |