
|
|||||
|
 | |
| |
| |
| |
| |
| |
|
Gene: GJB5 |
Gene summary for GJB5 |
| Gene information | Species | Human | Gene symbol | GJB5 | Gene ID | 2709 |
| Gene name | gap junction protein beta 5 | |
| Gene Alias | CX31.1 | |
| Cytomap | 1p34.3 | |
| Gene Type | protein-coding | GO ID | GO:0000003 | UniProtAcc | O95377 |
Top |
Malignant transformation analysis |
| Identification of the aberrant gene expression in precancerous and cancerous lesions by comparing the gene expression of stem-like cells in diseased tissues with normal stem cells |
| Entrez ID | Symbol | Replicates | Species | Organ | Tissue | Adj P-value | Log2FC | Malignancy |
| 2709 | GJB5 | LZE8T | Human | Esophagus | ESCC | 1.12e-05 | 2.15e-01 | 0.067 |
| 2709 | GJB5 | LZE24T | Human | Esophagus | ESCC | 3.82e-07 | 4.24e-01 | 0.0596 |
| 2709 | GJB5 | LZE21T | Human | Esophagus | ESCC | 6.28e-03 | 1.68e-01 | 0.0655 |
| 2709 | GJB5 | P2T-E | Human | Esophagus | ESCC | 2.89e-15 | 1.48e-01 | 0.1177 |
| 2709 | GJB5 | P4T-E | Human | Esophagus | ESCC | 3.22e-11 | 3.71e-01 | 0.1323 |
| 2709 | GJB5 | P5T-E | Human | Esophagus | ESCC | 4.75e-07 | 2.25e-01 | 0.1327 |
| 2709 | GJB5 | P8T-E | Human | Esophagus | ESCC | 4.92e-06 | 1.07e-01 | 0.0889 |
| 2709 | GJB5 | P9T-E | Human | Esophagus | ESCC | 4.03e-09 | 3.74e-01 | 0.1131 |
| 2709 | GJB5 | P10T-E | Human | Esophagus | ESCC | 3.95e-25 | 5.04e-01 | 0.116 |
| 2709 | GJB5 | P11T-E | Human | Esophagus | ESCC | 4.33e-03 | 4.87e-01 | 0.1426 |
| 2709 | GJB5 | P12T-E | Human | Esophagus | ESCC | 2.47e-19 | 5.04e-01 | 0.1122 |
| 2709 | GJB5 | P15T-E | Human | Esophagus | ESCC | 1.70e-06 | 3.77e-01 | 0.1149 |
| 2709 | GJB5 | P16T-E | Human | Esophagus | ESCC | 5.68e-09 | 3.30e-02 | 0.1153 |
| 2709 | GJB5 | P19T-E | Human | Esophagus | ESCC | 2.19e-04 | 4.40e-01 | 0.1662 |
| 2709 | GJB5 | P20T-E | Human | Esophagus | ESCC | 4.04e-18 | 5.44e-01 | 0.1124 |
| 2709 | GJB5 | P21T-E | Human | Esophagus | ESCC | 3.47e-56 | 1.48e+00 | 0.1617 |
| 2709 | GJB5 | P22T-E | Human | Esophagus | ESCC | 1.34e-20 | 4.61e-01 | 0.1236 |
| 2709 | GJB5 | P23T-E | Human | Esophagus | ESCC | 1.10e-26 | 9.64e-01 | 0.108 |
| 2709 | GJB5 | P26T-E | Human | Esophagus | ESCC | 3.24e-31 | 6.10e-01 | 0.1276 |
| 2709 | GJB5 | P27T-E | Human | Esophagus | ESCC | 1.36e-21 | 5.17e-01 | 0.1055 |
| Page: 1 2 3 4 |
| Tissue | Expression Dynamics | Abbreviation |
| Esophagus | 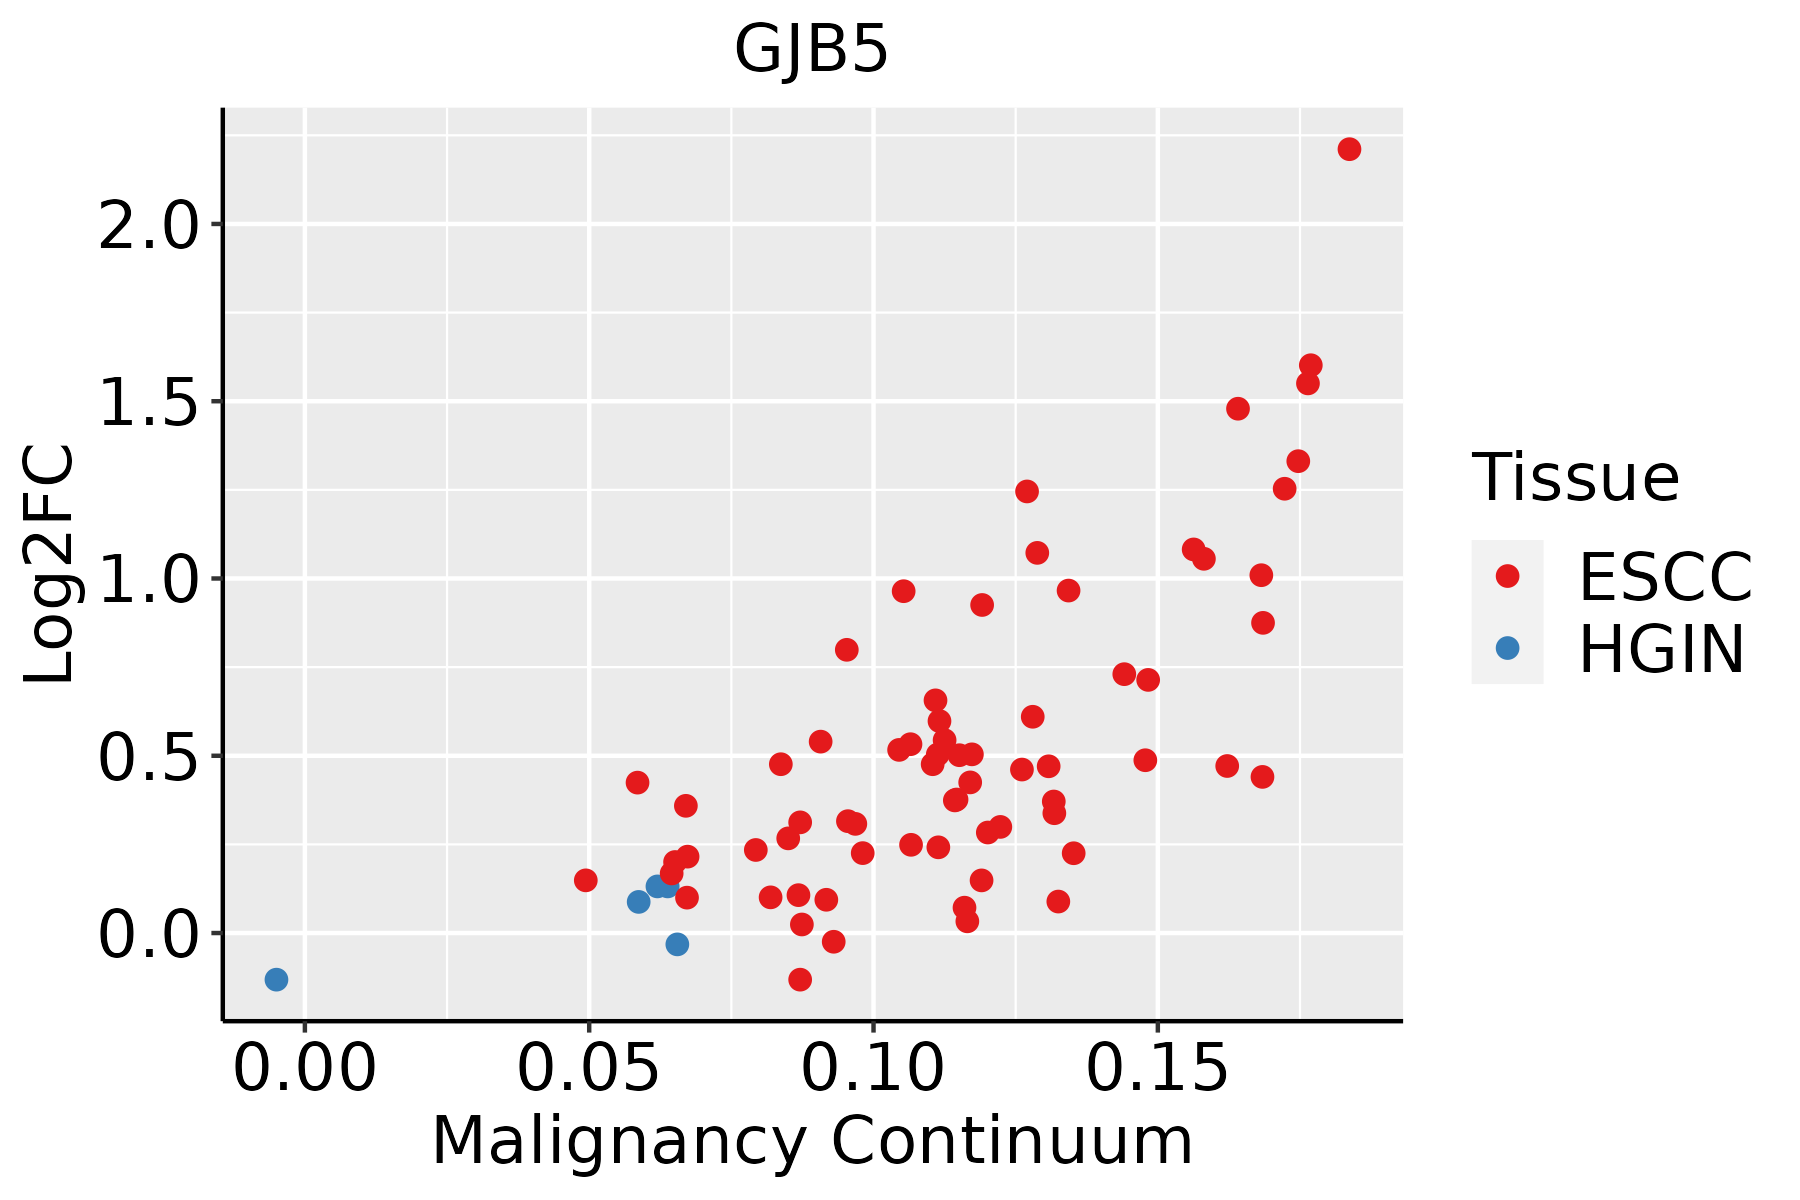 | ESCC: Esophageal squamous cell carcinoma |
| HGIN: High-grade intraepithelial neoplasias | ||
| LGIN: Low-grade intraepithelial neoplasias | ||
| Oral Cavity | 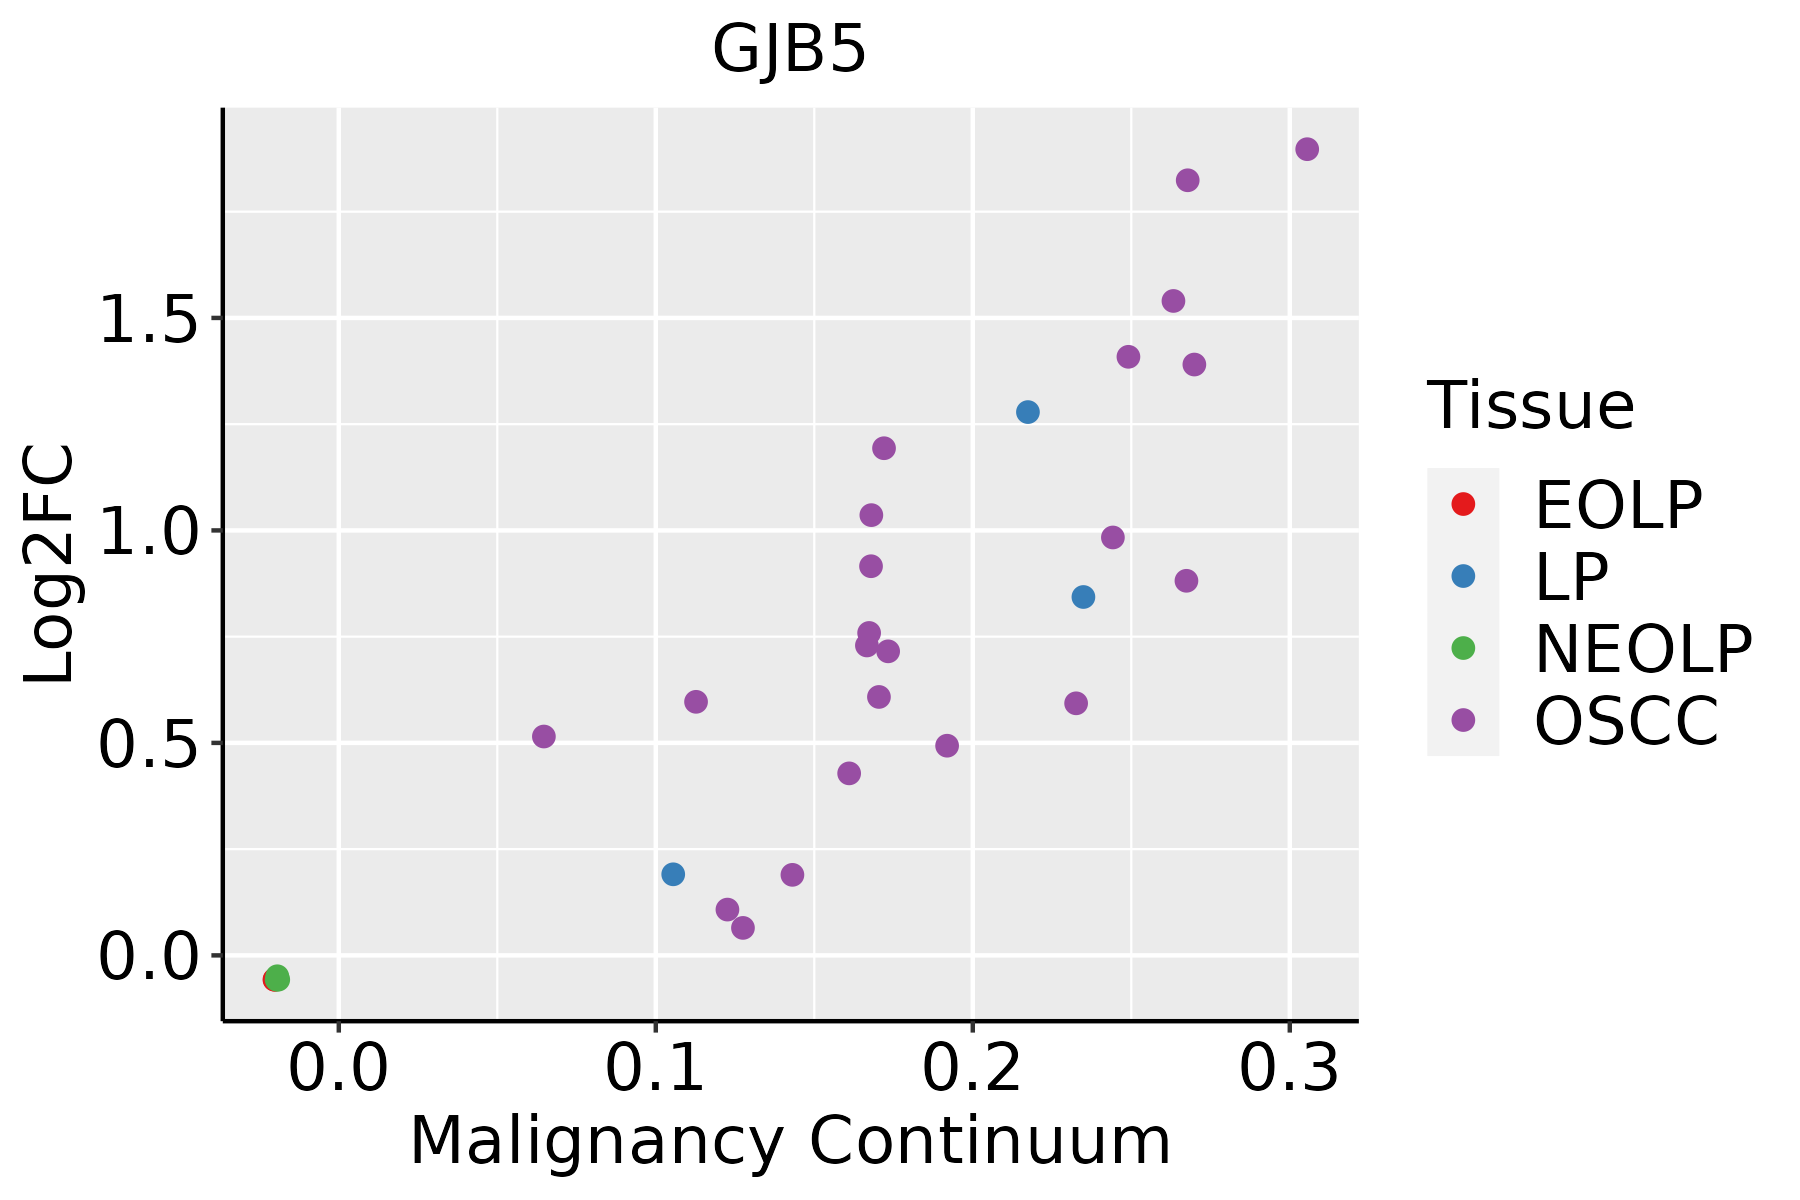 | EOLP: Erosive Oral lichen planus |
| LP: leukoplakia | ||
| NEOLP: Non-erosive oral lichen planus | ||
| OSCC: Oral squamous cell carcinoma | ||
| Skin | 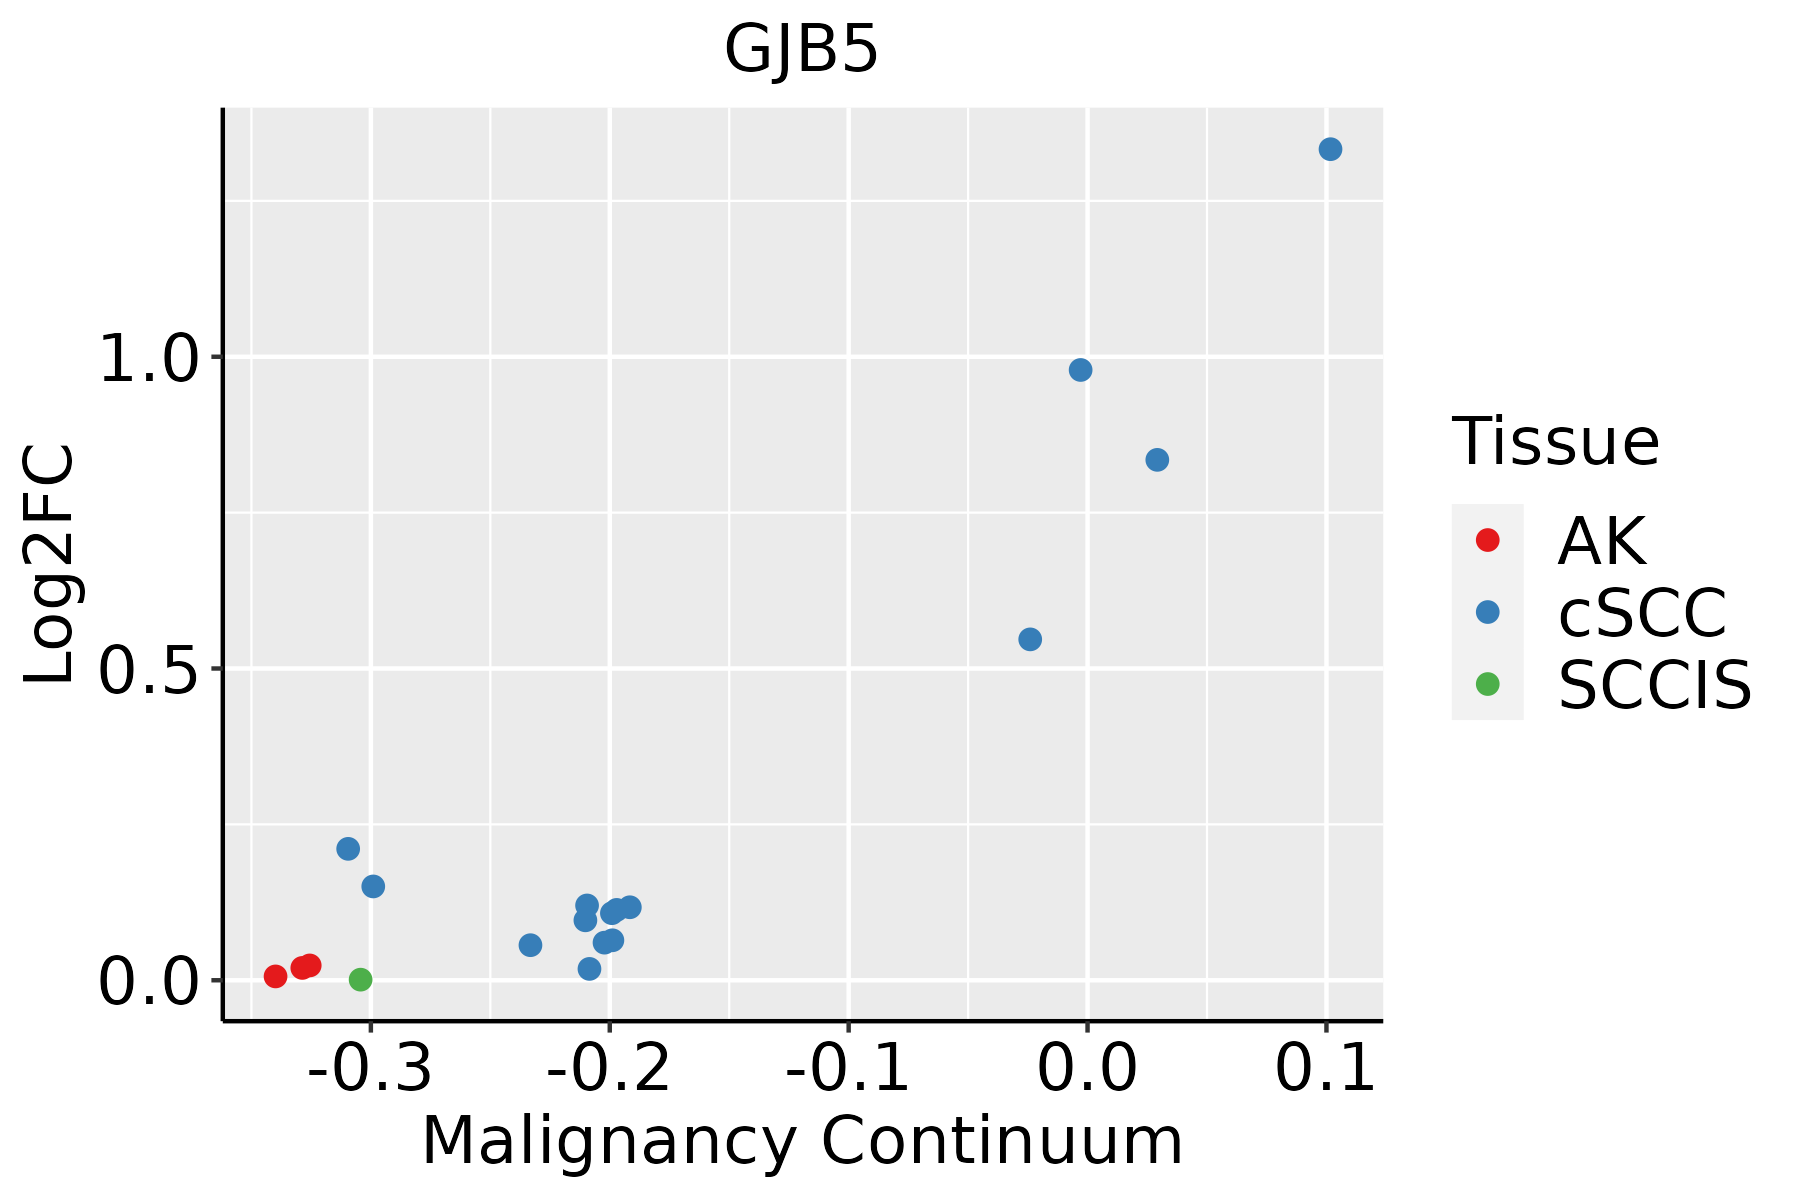 | AK: Actinic keratosis |
| cSCC: Cutaneous squamous cell carcinoma | ||
| SCCIS:squamous cell carcinoma in situ |
| ∗log2FC in expression of this searched gene in stem-like cells from each diseased tissue sample relative to stem-like cells in normal samples in each tissue plotted against the malignancy continuum. Samples are colored based on if they are from different disease stage. |
Top |
Malignant transformation related pathway analysis |
| Find out the enriched GO biological processes and KEGG pathways involved in transition from healthy to precancer to cancer |
| Tissue | Disease Stage | Enriched GO biological Processes |
| Colorectum | AD |  |
| Colorectum | SER |  |
| Colorectum | MSS |  |
| Colorectum | MSI-H |  |
| Colorectum | FAP |  |
| ∗Top 15 enriched GO BP terms are showed in the bar plot of each disease state in each tissue. Each row represents a significant GO biological process which is colored according to the -log10(p.adjust). |
| Page: 1 2 3 4 5 6 7 8 9 |
| GO ID | Tissue | Disease Stage | Description | Gene Ratio | Bg Ratio | pvalue | p.adjust | Count |
| GO:000170119 | Esophagus | ESCC | in utero embryonic development | 243/8552 | 367/18723 | 1.00e-15 | 6.86e-14 | 243 |
| GO:0001890110 | Esophagus | ESCC | placenta development | 98/8552 | 144/18723 | 4.46e-08 | 8.11e-07 | 98 |
| GO:0061458110 | Esophagus | ESCC | reproductive system development | 247/8552 | 427/18723 | 2.24e-07 | 3.42e-06 | 247 |
| GO:004860818 | Esophagus | ESCC | reproductive structure development | 245/8552 | 424/18723 | 2.82e-07 | 4.14e-06 | 245 |
| GO:000854410 | Esophagus | ESCC | epidermis development | 193/8552 | 324/18723 | 2.87e-07 | 4.19e-06 | 193 |
| GO:000189219 | Esophagus | ESCC | embryonic placenta development | 57/8552 | 82/18723 | 1.06e-05 | 1.01e-04 | 57 |
| GO:00485687 | Esophagus | ESCC | embryonic organ development | 228/8552 | 427/18723 | 7.28e-04 | 3.79e-03 | 228 |
| GO:006066914 | Esophagus | ESCC | embryonic placenta morphogenesis | 20/8552 | 26/18723 | 1.19e-03 | 5.88e-03 | 20 |
| GO:00607119 | Esophagus | ESCC | labyrinthine layer development | 30/8552 | 44/18723 | 2.14e-03 | 9.54e-03 | 30 |
| GO:006071310 | Esophagus | ESCC | labyrinthine layer morphogenesis | 17/8552 | 22/18723 | 2.60e-03 | 1.11e-02 | 17 |
| GO:00607065 | Esophagus | ESCC | cell differentiation involved in embryonic placenta development | 18/8552 | 25/18723 | 7.04e-03 | 2.56e-02 | 18 |
| GO:000170116 | Oral cavity | OSCC | in utero embryonic development | 207/7305 | 367/18723 | 7.92e-12 | 2.95e-10 | 207 |
| GO:000189017 | Oral cavity | OSCC | placenta development | 87/7305 | 144/18723 | 1.54e-07 | 2.56e-06 | 87 |
| GO:00085449 | Oral cavity | OSCC | epidermis development | 171/7305 | 324/18723 | 2.89e-07 | 4.43e-06 | 171 |
| GO:006145817 | Oral cavity | OSCC | reproductive system development | 217/7305 | 427/18723 | 3.75e-07 | 5.63e-06 | 217 |
| GO:004860816 | Oral cavity | OSCC | reproductive structure development | 214/7305 | 424/18723 | 8.58e-07 | 1.18e-05 | 214 |
| GO:000189216 | Oral cavity | OSCC | embryonic placenta development | 50/7305 | 82/18723 | 4.58e-05 | 3.90e-04 | 50 |
| GO:00607118 | Oral cavity | OSCC | labyrinthine layer development | 28/7305 | 44/18723 | 8.15e-04 | 4.35e-03 | 28 |
| GO:00607139 | Oral cavity | OSCC | labyrinthine layer morphogenesis | 16/7305 | 22/18723 | 1.40e-03 | 6.79e-03 | 16 |
| GO:00606699 | Oral cavity | OSCC | embryonic placenta morphogenesis | 17/7305 | 26/18723 | 5.83e-03 | 2.23e-02 | 17 |
| Page: 1 2 |
| Pathway ID | Tissue | Disease Stage | Description | Gene Ratio | Bg Ratio | pvalue | p.adjust | qvalue | Count |
| Page: 1 |
Top |
Cell-cell communication analysis |
| Identification of potential cell-cell interactions between two cell types and their ligand-receptor pairs for different disease states |
| Ligand | Receptor | LRpair | Pathway | Tissue | Disease Stage |
| Page: 1 |
Top |
Single-cell gene regulatory network inference analysis |
| Find out the significant the regulons (TFs) and the target genes of each regulon across cell types for different disease states |
| TF | Cell Type | Tissue | Disease Stage | Target Gene | RSS | Regulon Activity |
| ∗The dot plots of a searched regulon are shown for all cell subpopulations in each disease state of each tissue based on the regulon specific score inferred using pySCENIC and by calculating the average expression. |
| Page: 1 |
Top |
Somatic mutation of malignant transformation related genes |
| Annotation of somatic variants for genes involved in malignant transformation |
| Hugo Symbol | Variant Class | Variant Classification | dbSNP RS | HGVSc | HGVSp | HGVSp Short | SWISSPROT | BIOTYPE | SIFT | PolyPhen | Tumor Sample Barcode | Tissue | Histology | Sex | Age | Stage | Therapy Types | Drugs | Outcome |
| GJB5 | SNV | Missense_Mutation | c.690N>A | p.His230Gln | p.H230Q | O95377 | protein_coding | tolerated(0.61) | benign(0) | TCGA-AO-A0J6-01 | Breast | breast invasive carcinoma | Female | <65 | I/II | Chemotherapy | doxorubicin | SD | |
| GJB5 | SNV | Missense_Mutation | c.719A>C | p.Gln240Pro | p.Q240P | O95377 | protein_coding | tolerated(0.07) | benign(0) | TCGA-E2-A1IH-01 | Breast | breast invasive carcinoma | Female | >=65 | I/II | Hormone Therapy | aromasin | SD | |
| GJB5 | insertion | Nonsense_Mutation | novel | c.100_101insAAGTCTGTGATAAATGTAGGAAATGATTGTTCT | p.Val33_Leu34insGlnValCysAspLysCysArgLysTerLeuPhe | p.V33_L34insQVCDKCRK*LF | O95377 | protein_coding | TCGA-A8-A07R-01 | Breast | breast invasive carcinoma | Female | >=65 | III/IV | Ancillary | zoledronic | SD | ||
| GJB5 | SNV | Missense_Mutation | novel | c.533C>T | p.Ser178Phe | p.S178F | O95377 | protein_coding | deleterious(0) | probably_damaging(0.99) | TCGA-2W-A8YY-01 | Cervix | cervical & endocervical cancer | Female | <65 | I/II | Chemotherapy | cisplatin | CR |
| GJB5 | SNV | Missense_Mutation | rs142097965 | c.343N>T | p.Arg115Cys | p.R115C | O95377 | protein_coding | deleterious(0.04) | benign(0.009) | TCGA-EA-A3HS-01 | Cervix | cervical & endocervical cancer | Female | <65 | I/II | Unknown | Unknown | SD |
| GJB5 | SNV | Missense_Mutation | novel | c.549N>C | p.Lys183Asn | p.K183N | O95377 | protein_coding | deleterious(0) | probably_damaging(1) | TCGA-EA-A3Y4-01 | Cervix | cervical & endocervical cancer | Female | <65 | I/II | Unknown | Unknown | SD |
| GJB5 | SNV | Missense_Mutation | c.567N>A | p.Phe189Leu | p.F189L | O95377 | protein_coding | deleterious(0.02) | possibly_damaging(0.81) | TCGA-AZ-5407-01 | Colorectum | colon adenocarcinoma | Female | <65 | I/II | Unknown | Unknown | SD | |
| GJB5 | SNV | Missense_Mutation | novel | c.775N>A | p.Leu259Ile | p.L259I | O95377 | protein_coding | tolerated(0.13) | benign(0.15) | TCGA-A5-A0G2-01 | Endometrium | uterine corpus endometrioid carcinoma | Female | <65 | III/IV | Unknown | Unknown | SD |
| GJB5 | SNV | Missense_Mutation | rs142097965 | c.343N>T | p.Arg115Cys | p.R115C | O95377 | protein_coding | deleterious(0.04) | benign(0.009) | TCGA-AP-A1DV-01 | Endometrium | uterine corpus endometrioid carcinoma | Female | <65 | I/II | Unknown | Unknown | SD |
| GJB5 | SNV | Missense_Mutation | novel | c.751N>A | p.Leu251Met | p.L251M | O95377 | protein_coding | tolerated(0.12) | possibly_damaging(0.592) | TCGA-AP-A1DV-01 | Endometrium | uterine corpus endometrioid carcinoma | Female | <65 | I/II | Unknown | Unknown | SD |
| Page: 1 2 3 |
Top |
Related drugs of malignant transformation related genes |
| Identification of chemicals and drugs interact with genes involved in malignant transfromation |
| (DGIdb 4.0) |
| Entrez ID | Symbol | Category | Interaction Types | Drug Claim Name | Drug Name | PMIDs |
| 2709 | GJB5 | ION CHANNEL | inhibitor | 178101095 | OCTANOL | |
| 2709 | GJB5 | ION CHANNEL | inhibitor | 178100972 | CARBENOXOLONE | |
| 2709 | GJB5 | ION CHANNEL | inhibitor | 135650269 | ||
| 2709 | GJB5 | ION CHANNEL | inhibitor | 135652731 |
| Page: 1 |

Copyright 2023-Present -The University of Texas Health Science Center at Houston |