
|
|||||
|
 | |
| |
| |
| |
| |
| |
|
Gene: GJB4 |
Gene summary for GJB4 |
| Gene information | Species | Human | Gene symbol | GJB4 | Gene ID | 127534 |
| Gene name | gap junction protein beta 4 | |
| Gene Alias | CX30.3 | |
| Cytomap | 1p34.3 | |
| Gene Type | protein-coding | GO ID | GO:0003008 | UniProtAcc | Q9NTQ9 |
Top |
Malignant transformation analysis |
| Identification of the aberrant gene expression in precancerous and cancerous lesions by comparing the gene expression of stem-like cells in diseased tissues with normal stem cells |
| Entrez ID | Symbol | Replicates | Species | Organ | Tissue | Adj P-value | Log2FC | Malignancy |
| 127534 | GJB4 | LZE8T | Human | Esophagus | ESCC | 7.18e-05 | 1.89e-01 | 0.067 |
| 127534 | GJB4 | LZE20T | Human | Esophagus | ESCC | 3.13e-03 | 1.41e-01 | 0.0662 |
| 127534 | GJB4 | LZE24T | Human | Esophagus | ESCC | 3.89e-06 | 2.60e-01 | 0.0596 |
| 127534 | GJB4 | P2T-E | Human | Esophagus | ESCC | 7.90e-03 | 5.07e-02 | 0.1177 |
| 127534 | GJB4 | P12T-E | Human | Esophagus | ESCC | 1.66e-02 | 1.03e-01 | 0.1122 |
| 127534 | GJB4 | P22T-E | Human | Esophagus | ESCC | 1.78e-03 | 8.62e-02 | 0.1236 |
| 127534 | GJB4 | P23T-E | Human | Esophagus | ESCC | 1.14e-11 | 2.99e-01 | 0.108 |
| 127534 | GJB4 | P26T-E | Human | Esophagus | ESCC | 2.74e-02 | 1.36e-01 | 0.1276 |
| 127534 | GJB4 | P27T-E | Human | Esophagus | ESCC | 1.05e-02 | 6.78e-02 | 0.1055 |
| 127534 | GJB4 | P28T-E | Human | Esophagus | ESCC | 2.87e-08 | 1.97e-01 | 0.1149 |
| 127534 | GJB4 | P31T-E | Human | Esophagus | ESCC | 3.62e-21 | 4.45e-01 | 0.1251 |
| 127534 | GJB4 | P37T-E | Human | Esophagus | ESCC | 3.54e-10 | 3.00e-01 | 0.1371 |
| 127534 | GJB4 | P42T-E | Human | Esophagus | ESCC | 3.51e-06 | 1.74e-01 | 0.1175 |
| 127534 | GJB4 | P47T-E | Human | Esophagus | ESCC | 4.17e-05 | 1.35e-01 | 0.1067 |
| 127534 | GJB4 | P48T-E | Human | Esophagus | ESCC | 2.02e-06 | 1.23e-01 | 0.0959 |
| 127534 | GJB4 | P52T-E | Human | Esophagus | ESCC | 1.97e-10 | 2.26e-01 | 0.1555 |
| 127534 | GJB4 | P54T-E | Human | Esophagus | ESCC | 1.13e-14 | 4.11e-01 | 0.0975 |
| 127534 | GJB4 | P62T-E | Human | Esophagus | ESCC | 2.62e-34 | 6.57e-01 | 0.1302 |
| 127534 | GJB4 | P74T-E | Human | Esophagus | ESCC | 6.95e-12 | 3.89e-01 | 0.1479 |
| 127534 | GJB4 | P75T-E | Human | Esophagus | ESCC | 2.13e-27 | 5.98e-01 | 0.1125 |
| Page: 1 2 |
| Tissue | Expression Dynamics | Abbreviation |
| Esophagus | 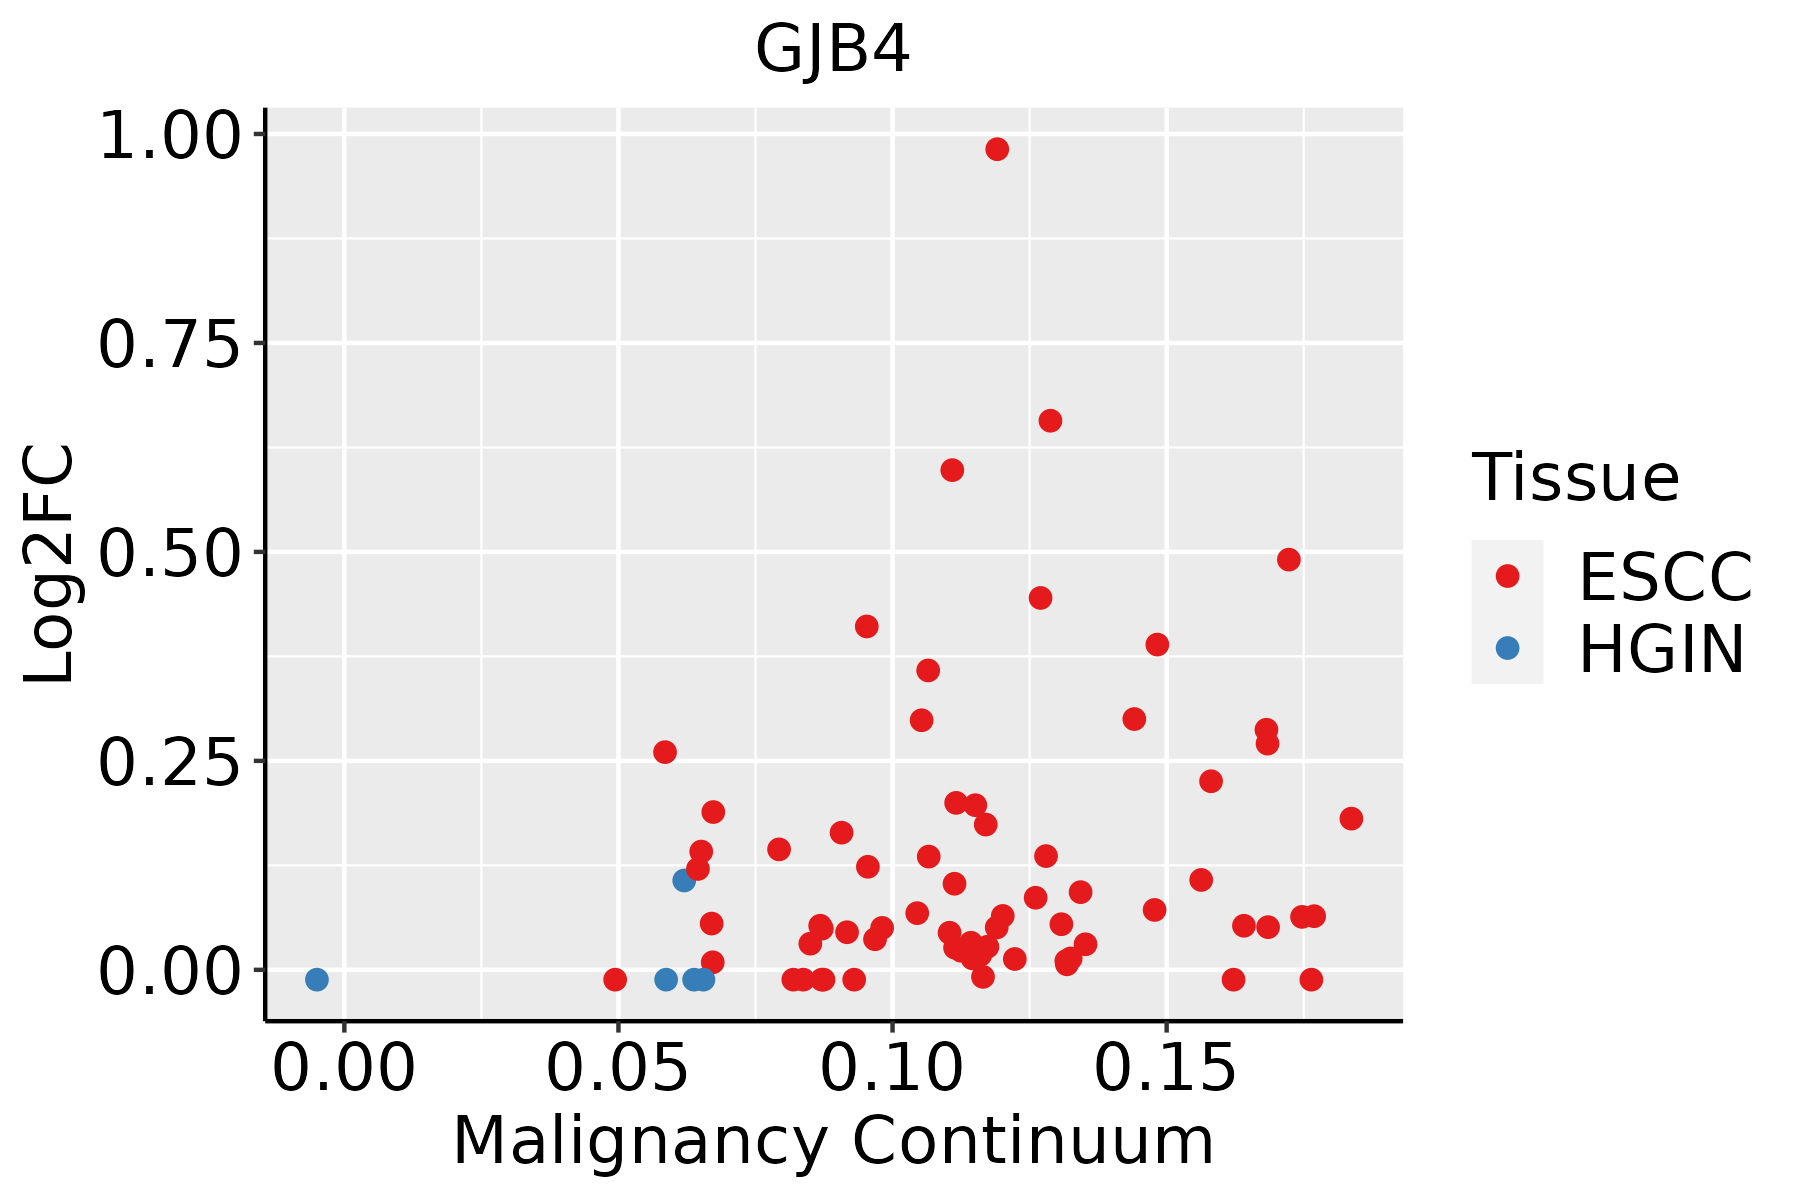 | ESCC: Esophageal squamous cell carcinoma |
| HGIN: High-grade intraepithelial neoplasias | ||
| LGIN: Low-grade intraepithelial neoplasias | ||
| Oral Cavity | 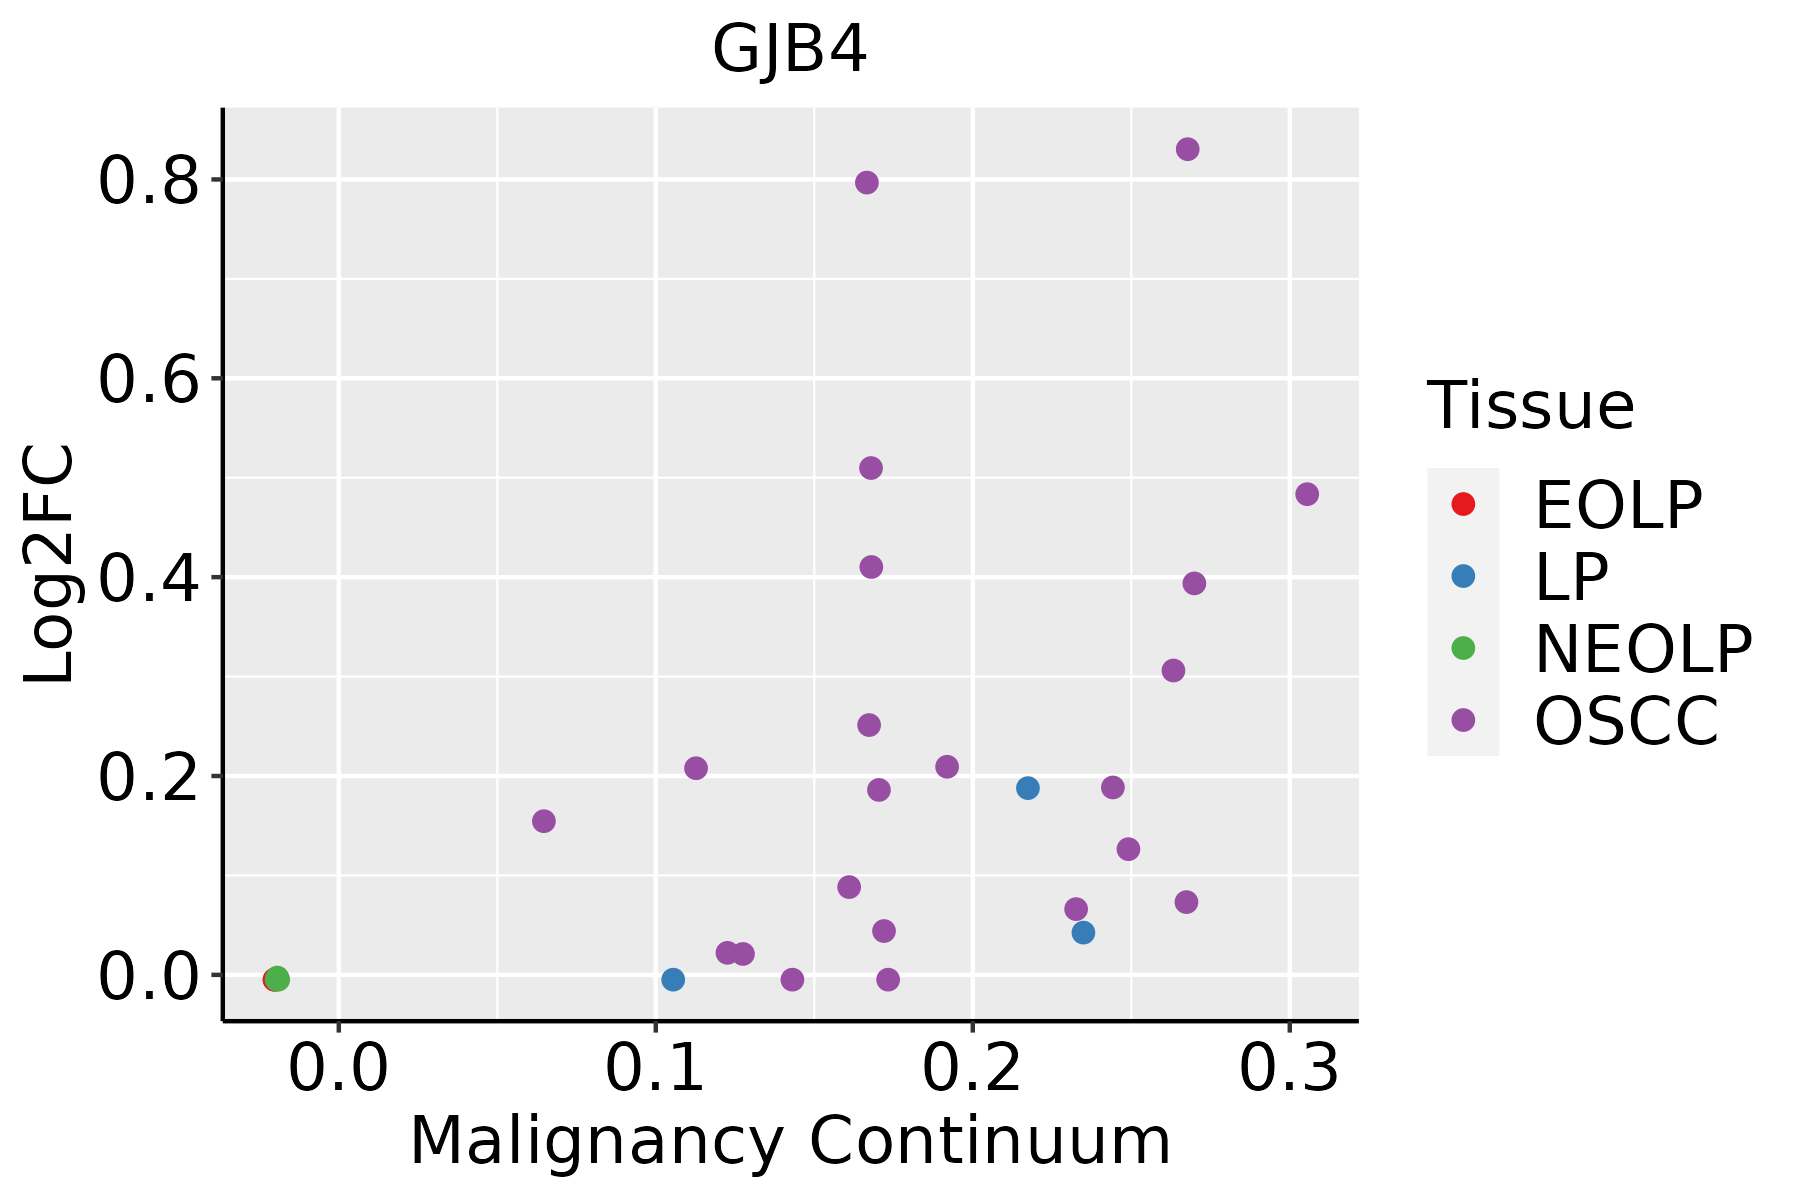 | EOLP: Erosive Oral lichen planus |
| LP: leukoplakia | ||
| NEOLP: Non-erosive oral lichen planus | ||
| OSCC: Oral squamous cell carcinoma |
| ∗log2FC in expression of this searched gene in stem-like cells from each diseased tissue sample relative to stem-like cells in normal samples in each tissue plotted against the malignancy continuum. Samples are colored based on if they are from different disease stage. |
Top |
Malignant transformation related pathway analysis |
| Find out the enriched GO biological processes and KEGG pathways involved in transition from healthy to precancer to cancer |
| Tissue | Disease Stage | Enriched GO biological Processes |
| Colorectum | AD |  |
| Colorectum | SER |  |
| Colorectum | MSS |  |
| Colorectum | MSI-H |  |
| Colorectum | FAP |  |
| ∗Top 15 enriched GO BP terms are showed in the bar plot of each disease state in each tissue. Each row represents a significant GO biological process which is colored according to the -log10(p.adjust). |
| Page: 1 2 3 4 5 6 7 8 9 |
| GO ID | Tissue | Disease Stage | Description | Gene Ratio | Bg Ratio | pvalue | p.adjust | Count |
| Page: 1 |
| Pathway ID | Tissue | Disease Stage | Description | Gene Ratio | Bg Ratio | pvalue | p.adjust | qvalue | Count |
| Page: 1 |
Top |
Cell-cell communication analysis |
| Identification of potential cell-cell interactions between two cell types and their ligand-receptor pairs for different disease states |
| Ligand | Receptor | LRpair | Pathway | Tissue | Disease Stage |
| Page: 1 |
Top |
Single-cell gene regulatory network inference analysis |
| Find out the significant the regulons (TFs) and the target genes of each regulon across cell types for different disease states |
| TF | Cell Type | Tissue | Disease Stage | Target Gene | RSS | Regulon Activity |
| ∗The dot plots of a searched regulon are shown for all cell subpopulations in each disease state of each tissue based on the regulon specific score inferred using pySCENIC and by calculating the average expression. |
| Page: 1 |
Top |
Somatic mutation of malignant transformation related genes |
| Annotation of somatic variants for genes involved in malignant transformation |
| Hugo Symbol | Variant Class | Variant Classification | dbSNP RS | HGVSc | HGVSp | HGVSp Short | SWISSPROT | BIOTYPE | SIFT | PolyPhen | Tumor Sample Barcode | Tissue | Histology | Sex | Age | Stage | Therapy Types | Drugs | Outcome |
| GJB4 | SNV | Missense_Mutation | novel | c.682G>C | p.Glu228Gln | p.E228Q | Q9NTQ9 | protein_coding | tolerated(0.49) | benign(0.03) | TCGA-AC-A23H-01 | Breast | breast invasive carcinoma | Female | >=65 | I/II | Unknown | Unknown | PD |
| GJB4 | SNV | Missense_Mutation | c.643N>A | p.Glu215Lys | p.E215K | Q9NTQ9 | protein_coding | tolerated(0.68) | benign(0.007) | TCGA-BH-A0B6-01 | Breast | breast invasive carcinoma | Female | <65 | I/II | Unknown | Unknown | SD | |
| GJB4 | SNV | Missense_Mutation | novel | c.281A>G | p.His94Arg | p.H94R | Q9NTQ9 | protein_coding | deleterious(0.04) | probably_damaging(1) | TCGA-2W-A8YY-01 | Cervix | cervical & endocervical cancer | Female | <65 | I/II | Chemotherapy | cisplatin | CR |
| GJB4 | SNV | Missense_Mutation | rs185327282 | c.679N>T | p.Arg227Trp | p.R227W | Q9NTQ9 | protein_coding | tolerated(0.23) | benign(0.394) | TCGA-HM-A6W2-06 | Cervix | cervical & endocervical cancer | Female | <65 | I/II | Chemotherapy | cisplatin | SD |
| GJB4 | SNV | Missense_Mutation | rs370587030 | c.211N>A | p.Val71Met | p.V71M | Q9NTQ9 | protein_coding | deleterious(0.03) | probably_damaging(0.963) | TCGA-AA-A01R-01 | Colorectum | colon adenocarcinoma | Male | <65 | III/IV | Chemotherapy | 5-fluorouracil | PD |
| GJB4 | SNV | Missense_Mutation | c.204N>A | p.Phe68Leu | p.F68L | Q9NTQ9 | protein_coding | tolerated(0.07) | benign(0.19) | TCGA-CA-6718-01 | Colorectum | colon adenocarcinoma | Male | <65 | I/II | Unknown | Unknown | PD | |
| GJB4 | SNV | Missense_Mutation | c.428C>T | p.Ala143Val | p.A143V | Q9NTQ9 | protein_coding | tolerated(0.84) | benign(0.001) | TCGA-G4-6304-01 | Colorectum | colon adenocarcinoma | Female | >=65 | I/II | Chemotherapy | fluorouracil | PD | |
| GJB4 | SNV | Missense_Mutation | rs778397300 | c.668N>A | p.Arg223Gln | p.R223Q | Q9NTQ9 | protein_coding | tolerated(0.21) | benign(0.003) | TCGA-G4-6586-01 | Colorectum | colon adenocarcinoma | Female | >=65 | I/II | Unknown | Unknown | SD |
| GJB4 | SNV | Missense_Mutation | c.163A>T | p.Thr55Ser | p.T55S | Q9NTQ9 | protein_coding | deleterious(0.04) | possibly_damaging(0.729) | TCGA-DY-A1DC-01 | Colorectum | rectum adenocarcinoma | Female | >=65 | I/II | Chemotherapy | capecitabine | PR | |
| GJB4 | SNV | Missense_Mutation | rs539139170 | c.479G>A | p.Arg160His | p.R160H | Q9NTQ9 | protein_coding | tolerated(0.17) | benign(0.086) | TCGA-F5-6814-01 | Colorectum | rectum adenocarcinoma | Male | <65 | I/II | Unknown | Unknown | SD |
| Page: 1 2 3 4 5 |
Top |
Related drugs of malignant transformation related genes |
| Identification of chemicals and drugs interact with genes involved in malignant transfromation |
| (DGIdb 4.0) |
| Entrez ID | Symbol | Category | Interaction Types | Drug Claim Name | Drug Name | PMIDs |
| 127534 | GJB4 | ION CHANNEL | inhibitor | 135652731 | ||
| 127534 | GJB4 | ION CHANNEL | inhibitor | 135650269 | ||
| 127534 | GJB4 | ION CHANNEL | inhibitor | 178101095 | OCTANOL | |
| 127534 | GJB4 | ION CHANNEL | inhibitor | 178100972 | CARBENOXOLONE |
| Page: 1 |

Copyright 2023-Present -The University of Texas Health Science Center at Houston |