
|
|||||
|
 | |
| |
| |
| |
| |
| |
|
Gene: GJB3 |
Gene summary for GJB3 |
| Gene information | Species | Human | Gene symbol | GJB3 | Gene ID | 2707 |
| Gene name | gap junction protein beta 3 | |
| Gene Alias | CX31 | |
| Cytomap | 1p34.3 | |
| Gene Type | protein-coding | GO ID | GO:0000003 | UniProtAcc | O75712 |
Top |
Malignant transformation analysis |
| Identification of the aberrant gene expression in precancerous and cancerous lesions by comparing the gene expression of stem-like cells in diseased tissues with normal stem cells |
| Entrez ID | Symbol | Replicates | Species | Organ | Tissue | Adj P-value | Log2FC | Malignancy |
| 2707 | GJB3 | Tumor | Human | Cervix | CC | 1.27e-21 | 4.92e-01 | 0.1241 |
| 2707 | GJB3 | sample3 | Human | Cervix | CC | 1.51e-35 | 6.04e-01 | 0.1387 |
| 2707 | GJB3 | T1 | Human | Cervix | CC | 1.36e-02 | 2.57e-01 | 0.0918 |
| 2707 | GJB3 | T3 | Human | Cervix | CC | 2.42e-33 | 6.11e-01 | 0.1389 |
| 2707 | GJB3 | HTA11_2487_2000001011 | Human | Colorectum | SER | 5.91e-12 | 3.97e-01 | -0.1808 |
| 2707 | GJB3 | HTA11_1938_2000001011 | Human | Colorectum | AD | 7.73e-09 | 3.35e-01 | -0.0811 |
| 2707 | GJB3 | HTA11_347_2000001011 | Human | Colorectum | AD | 1.42e-07 | 1.68e-01 | -0.1954 |
| 2707 | GJB3 | HTA11_411_2000001011 | Human | Colorectum | SER | 1.20e-07 | 7.13e-01 | -0.2602 |
| 2707 | GJB3 | HTA11_696_2000001011 | Human | Colorectum | AD | 3.61e-02 | 8.02e-02 | -0.1464 |
| 2707 | GJB3 | HTA11_1391_2000001011 | Human | Colorectum | AD | 7.96e-09 | 2.56e-01 | -0.059 |
| 2707 | GJB3 | HTA11_5212_2000001011 | Human | Colorectum | AD | 5.12e-05 | 2.75e-01 | -0.2061 |
| 2707 | GJB3 | HTA11_6818_2000001021 | Human | Colorectum | AD | 2.64e-03 | 2.01e-01 | 0.0588 |
| 2707 | GJB3 | HTA11_99999971662_82457 | Human | Colorectum | MSS | 9.04e-05 | 1.50e-01 | 0.3859 |
| 2707 | GJB3 | LZE4T | Human | Esophagus | ESCC | 7.81e-10 | -1.34e-01 | 0.0811 |
| 2707 | GJB3 | LZE7T | Human | Esophagus | ESCC | 3.19e-07 | -9.23e-02 | 0.0667 |
| 2707 | GJB3 | LZE8T | Human | Esophagus | ESCC | 5.44e-03 | -6.94e-02 | 0.067 |
| 2707 | GJB3 | LZE6T | Human | Esophagus | ESCC | 4.24e-02 | -2.88e-01 | 0.0845 |
| 2707 | GJB3 | P4T-E | Human | Esophagus | ESCC | 4.99e-06 | 9.97e-02 | 0.1323 |
| 2707 | GJB3 | P5T-E | Human | Esophagus | ESCC | 2.56e-08 | 3.25e-01 | 0.1327 |
| 2707 | GJB3 | P8T-E | Human | Esophagus | ESCC | 3.65e-14 | 8.06e-03 | 0.0889 |
| Page: 1 2 3 4 5 |
| Tissue | Expression Dynamics | Abbreviation |
| Cervix |  | CC: Cervix cancer |
| HSIL_HPV: HPV-infected high-grade squamous intraepithelial lesions | ||
| N_HPV: HPV-infected normal cervix | ||
| Colorectum (GSE201348) |  | FAP: Familial adenomatous polyposis |
| CRC: Colorectal cancer | ||
| Colorectum (HTA11) |  | AD: Adenomas |
| SER: Sessile serrated lesions | ||
| MSI-H: Microsatellite-high colorectal cancer | ||
| MSS: Microsatellite stable colorectal cancer | ||
| Esophagus |  | ESCC: Esophageal squamous cell carcinoma |
| HGIN: High-grade intraepithelial neoplasias | ||
| LGIN: Low-grade intraepithelial neoplasias | ||
| Oral Cavity | 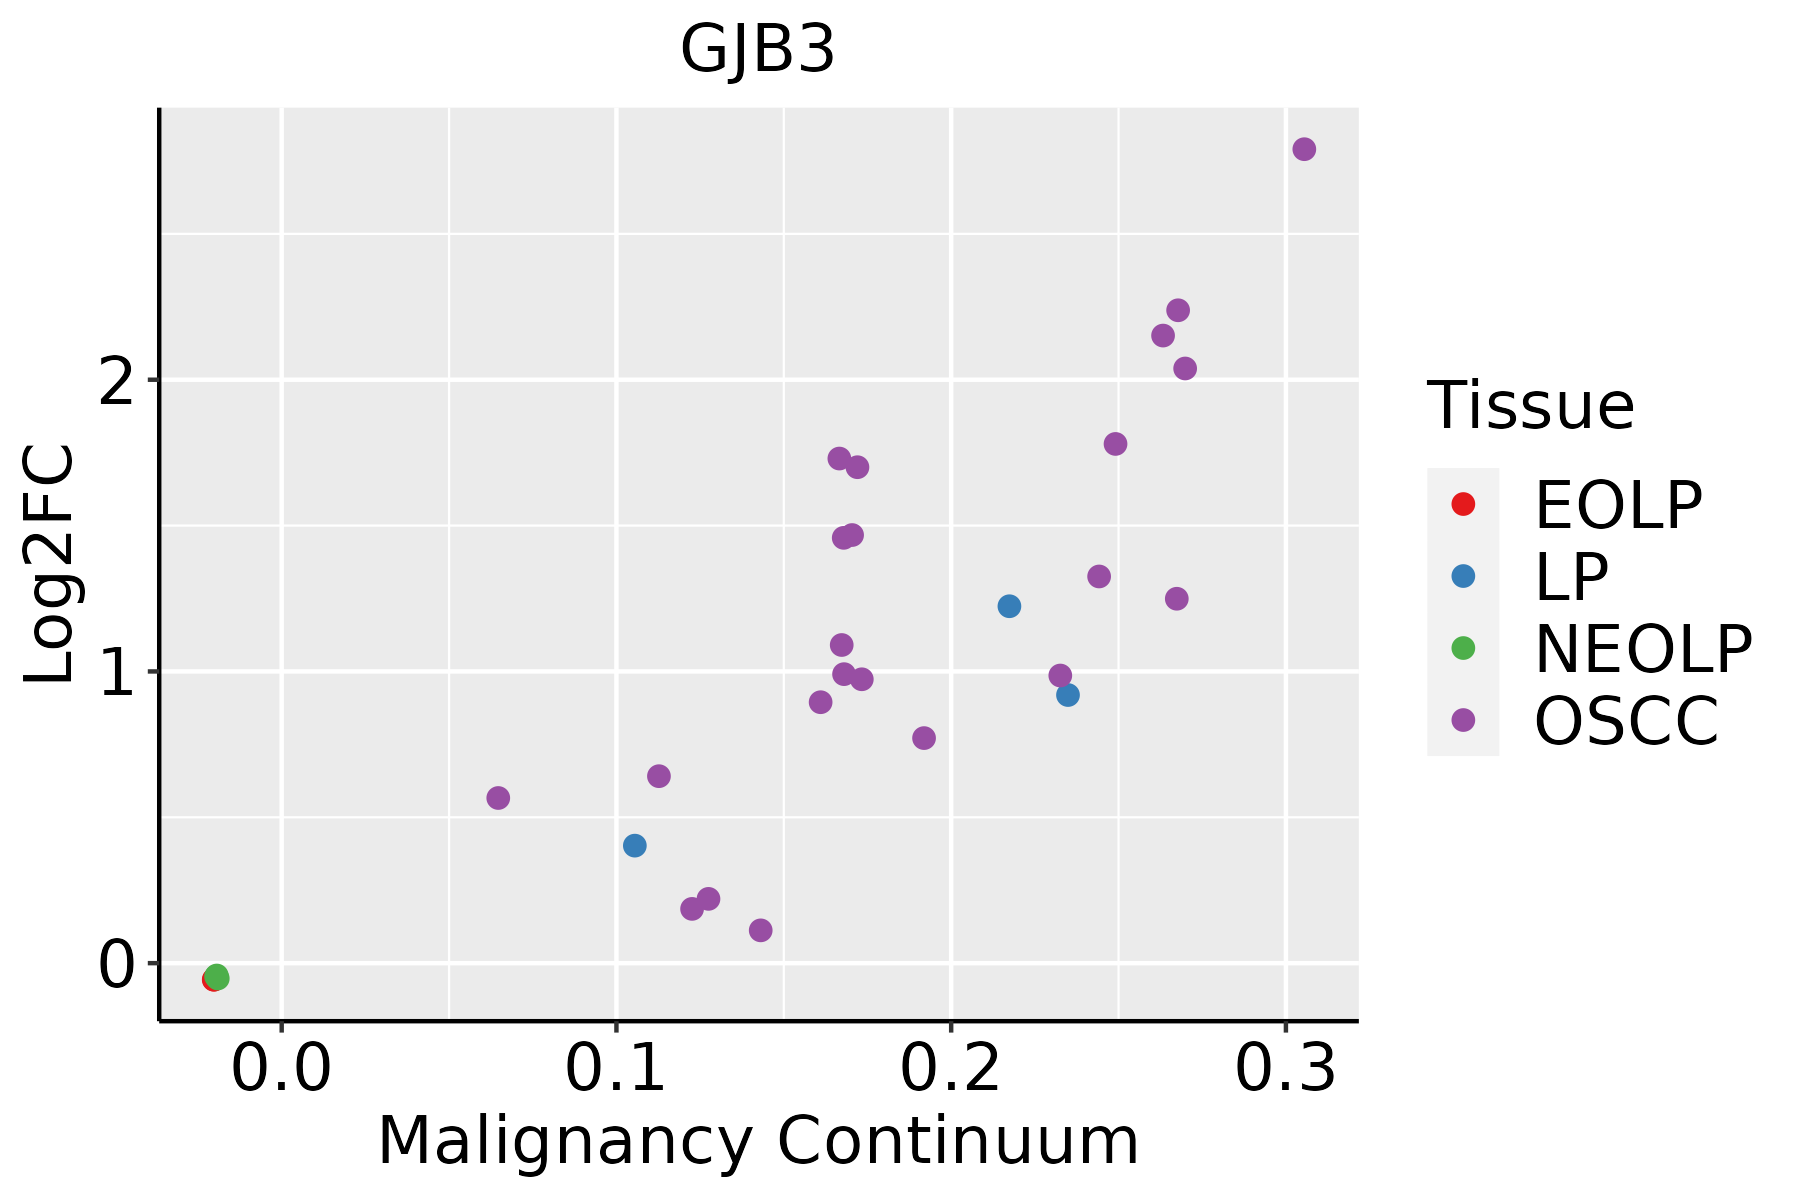 | EOLP: Erosive Oral lichen planus |
| LP: leukoplakia | ||
| NEOLP: Non-erosive oral lichen planus | ||
| OSCC: Oral squamous cell carcinoma | ||
| Skin | 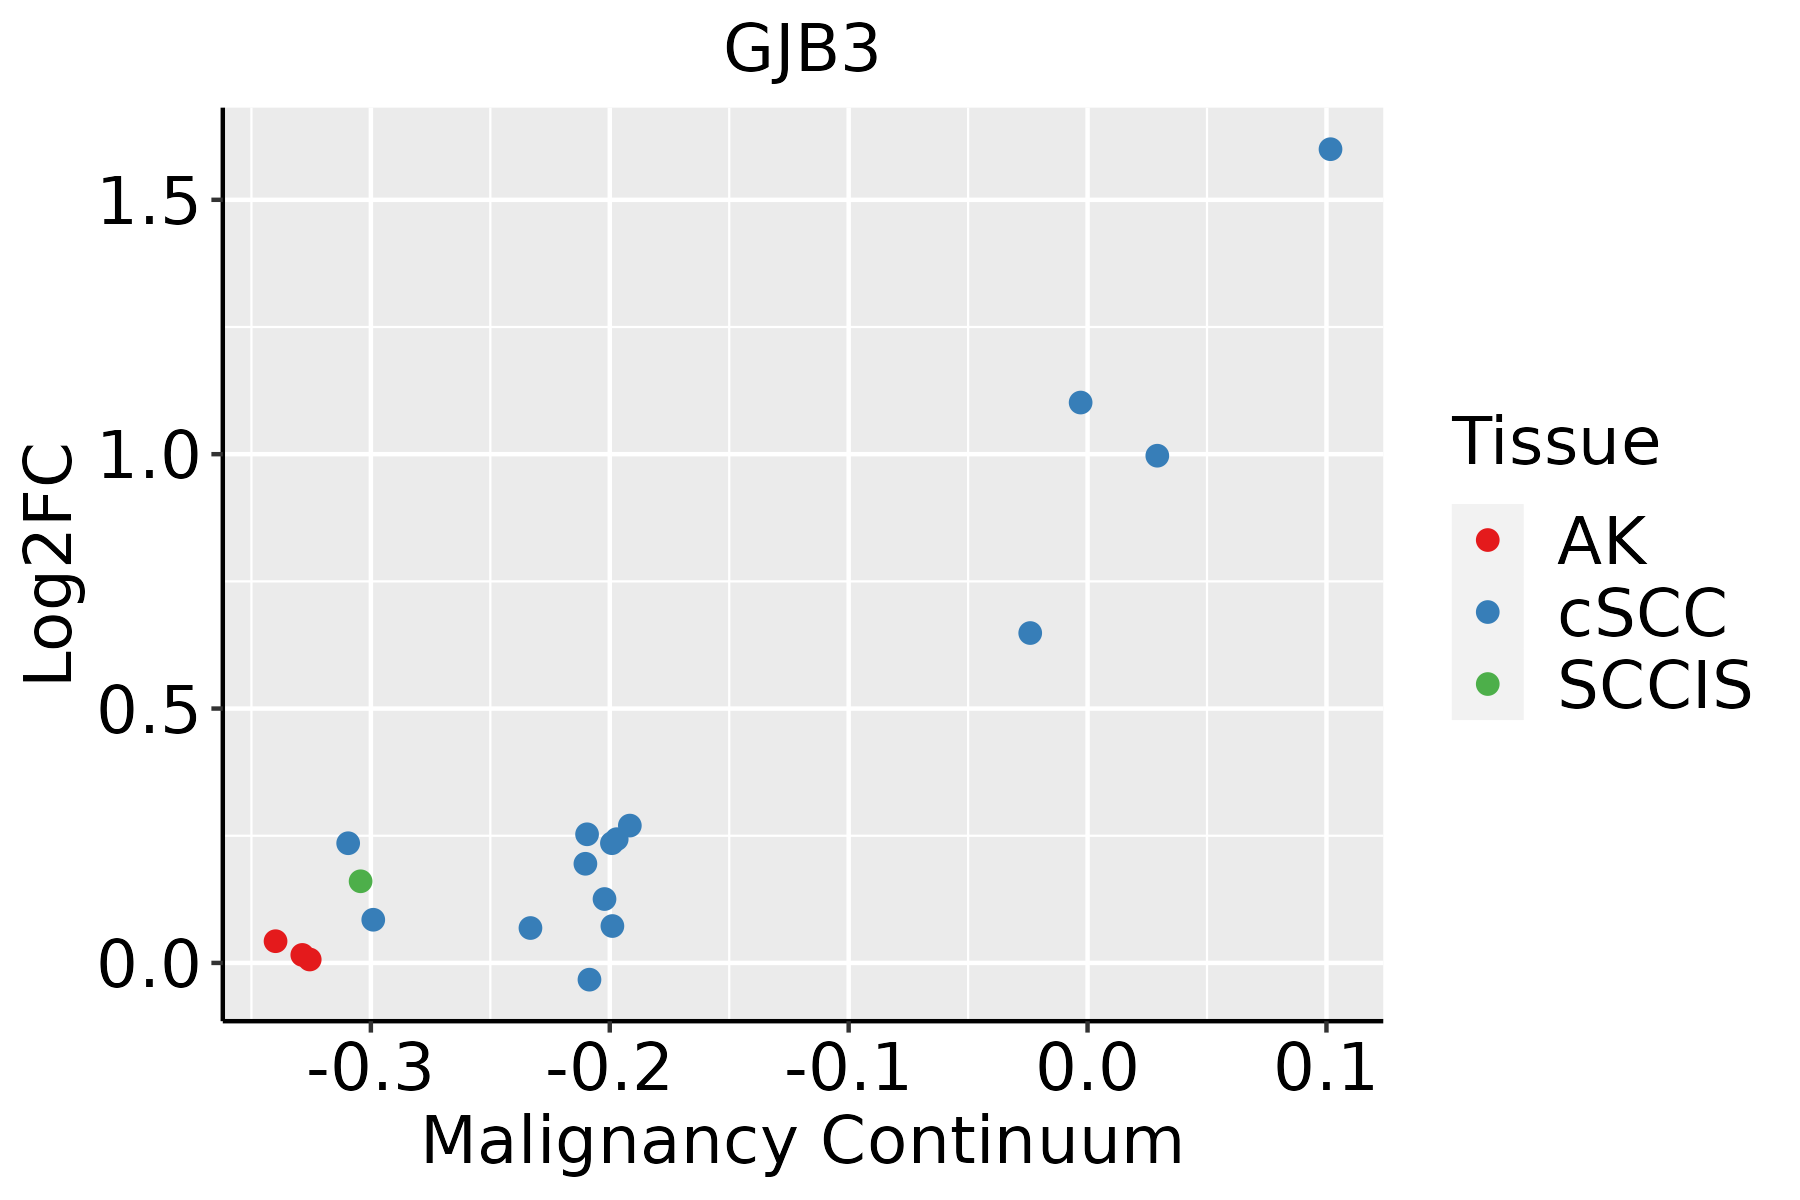 | AK: Actinic keratosis |
| cSCC: Cutaneous squamous cell carcinoma | ||
| SCCIS:squamous cell carcinoma in situ |
| ∗log2FC in expression of this searched gene in stem-like cells from each diseased tissue sample relative to stem-like cells in normal samples in each tissue plotted against the malignancy continuum. Samples are colored based on if they are from different disease stage. |
Top |
Malignant transformation related pathway analysis |
| Find out the enriched GO biological processes and KEGG pathways involved in transition from healthy to precancer to cancer |
| Tissue | Disease Stage | Enriched GO biological Processes |
| Colorectum | AD |  |
| Colorectum | SER |  |
| Colorectum | MSS |  |
| Colorectum | MSI-H |  |
| Colorectum | FAP |  |
| ∗Top 15 enriched GO BP terms are showed in the bar plot of each disease state in each tissue. Each row represents a significant GO biological process which is colored according to the -log10(p.adjust). |
| Page: 1 2 3 4 5 6 7 8 9 |
| GO ID | Tissue | Disease Stage | Description | Gene Ratio | Bg Ratio | pvalue | p.adjust | Count |
| GO:00435884 | Cervix | CC | skin development | 71/2311 | 263/18723 | 8.04e-11 | 1.46e-08 | 71 |
| GO:00018908 | Cervix | CC | placenta development | 40/2311 | 144/18723 | 4.59e-07 | 1.77e-05 | 40 |
| GO:00614588 | Cervix | CC | reproductive system development | 87/2311 | 427/18723 | 1.37e-06 | 4.55e-05 | 87 |
| GO:00486088 | Cervix | CC | reproductive structure development | 86/2311 | 424/18723 | 1.90e-06 | 5.97e-05 | 86 |
| GO:00017018 | Cervix | CC | in utero embryonic development | 71/2311 | 367/18723 | 7.21e-05 | 1.00e-03 | 71 |
| GO:0001701 | Colorectum | AD | in utero embryonic development | 110/3918 | 367/18723 | 2.36e-05 | 4.62e-04 | 110 |
| GO:0001890 | Colorectum | AD | placenta development | 51/3918 | 144/18723 | 3.99e-05 | 7.16e-04 | 51 |
| GO:0061458 | Colorectum | AD | reproductive system development | 116/3918 | 427/18723 | 1.11e-03 | 1.01e-02 | 116 |
| GO:0048608 | Colorectum | AD | reproductive structure development | 114/3918 | 424/18723 | 1.78e-03 | 1.47e-02 | 114 |
| GO:00018901 | Colorectum | SER | placenta development | 43/2897 | 144/18723 | 9.10e-06 | 3.03e-04 | 43 |
| GO:00017011 | Colorectum | SER | in utero embryonic development | 77/2897 | 367/18723 | 2.77e-03 | 2.48e-02 | 77 |
| GO:00614581 | Colorectum | SER | reproductive system development | 87/2897 | 427/18723 | 3.69e-03 | 3.07e-02 | 87 |
| GO:00486081 | Colorectum | SER | reproductive structure development | 85/2897 | 424/18723 | 6.33e-03 | 4.56e-02 | 85 |
| GO:00018902 | Colorectum | MSS | placenta development | 51/3467 | 144/18723 | 1.10e-06 | 3.77e-05 | 51 |
| GO:00614582 | Colorectum | MSS | reproductive system development | 115/3467 | 427/18723 | 9.86e-06 | 2.39e-04 | 115 |
| GO:00486082 | Colorectum | MSS | reproductive structure development | 113/3467 | 424/18723 | 1.94e-05 | 4.18e-04 | 113 |
| GO:00017012 | Colorectum | MSS | in utero embryonic development | 99/3467 | 367/18723 | 3.71e-05 | 7.10e-04 | 99 |
| GO:000170119 | Esophagus | ESCC | in utero embryonic development | 243/8552 | 367/18723 | 1.00e-15 | 6.86e-14 | 243 |
| GO:0001890110 | Esophagus | ESCC | placenta development | 98/8552 | 144/18723 | 4.46e-08 | 8.11e-07 | 98 |
| GO:00435888 | Esophagus | ESCC | skin development | 163/8552 | 263/18723 | 6.48e-08 | 1.14e-06 | 163 |
| Page: 1 2 |
| Pathway ID | Tissue | Disease Stage | Description | Gene Ratio | Bg Ratio | pvalue | p.adjust | qvalue | Count |
| Page: 1 |
Top |
Cell-cell communication analysis |
| Identification of potential cell-cell interactions between two cell types and their ligand-receptor pairs for different disease states |
| Ligand | Receptor | LRpair | Pathway | Tissue | Disease Stage |
| Page: 1 |
Top |
Single-cell gene regulatory network inference analysis |
| Find out the significant the regulons (TFs) and the target genes of each regulon across cell types for different disease states |
| TF | Cell Type | Tissue | Disease Stage | Target Gene | RSS | Regulon Activity |
| ∗The dot plots of a searched regulon are shown for all cell subpopulations in each disease state of each tissue based on the regulon specific score inferred using pySCENIC and by calculating the average expression. |
| Page: 1 |
Top |
Somatic mutation of malignant transformation related genes |
| Annotation of somatic variants for genes involved in malignant transformation |
| Hugo Symbol | Variant Class | Variant Classification | dbSNP RS | HGVSc | HGVSp | HGVSp Short | SWISSPROT | BIOTYPE | SIFT | PolyPhen | Tumor Sample Barcode | Tissue | Histology | Sex | Age | Stage | Therapy Types | Drugs | Outcome |
| GJB3 | SNV | Missense_Mutation | rs763321092 | c.697N>A | p.Ala233Thr | p.A233T | O75712 | protein_coding | tolerated(0.62) | benign(0) | TCGA-AN-A049-01 | Breast | breast invasive carcinoma | Female | <65 | I/II | Unknown | Unknown | SD |
| GJB3 | SNV | Missense_Mutation | rs147106166 | c.316N>T | p.Arg106Cys | p.R106C | O75712 | protein_coding | deleterious(0.02) | probably_damaging(0.959) | TCGA-D8-A1XZ-01 | Breast | breast invasive carcinoma | Female | >=65 | III/IV | Hormone Therapy | tamoxiphen+anastrozolum | SD |
| GJB3 | SNV | Missense_Mutation | rs796807027 | c.280N>A | p.His94Asn | p.H94N | O75712 | protein_coding | deleterious(0) | probably_damaging(1) | TCGA-E2-A1IN-01 | Breast | breast invasive carcinoma | Female | <65 | I/II | Hormone Therapy | arimidex | SD |
| GJB3 | SNV | Missense_Mutation | novel | c.470A>G | p.Asn157Ser | p.N157S | O75712 | protein_coding | tolerated(0.52) | benign(0.003) | TCGA-E9-A2JS-01 | Breast | breast invasive carcinoma | Female | >=65 | I/II | Chemotherapy | cyclophosphamide | PD |
| GJB3 | deletion | Frame_Shift_Del | c.131_132delNN | p.Asp46Ter | p.D46* | O75712 | protein_coding | TCGA-BH-A0HA-01 | Breast | breast invasive carcinoma | Female | <65 | I/II | Unknown | Unknown | SD | |||
| GJB3 | SNV | Missense_Mutation | rs369979083 | c.317N>A | p.Arg106His | p.R106H | O75712 | protein_coding | tolerated(0.07) | benign(0.141) | TCGA-AA-3811-01 | Colorectum | colon adenocarcinoma | Female | >=65 | III/IV | Unknown | Unknown | PD |
| GJB3 | SNV | Missense_Mutation | c.124C>T | p.Arg42Cys | p.R42C | O75712 | protein_coding | deleterious(0) | probably_damaging(0.93) | TCGA-AA-A022-01 | Colorectum | colon adenocarcinoma | Female | >=65 | I/II | Unknown | Unknown | SD | |
| GJB3 | SNV | Missense_Mutation | novel | c.455N>A | p.Leu152His | p.L152H | O75712 | protein_coding | deleterious(0) | probably_damaging(0.98) | TCGA-CA-6717-01 | Colorectum | colon adenocarcinoma | Male | <65 | I/II | Chemotherapy | oxaliplatin | CR |
| GJB3 | SNV | Missense_Mutation | c.124N>T | p.Arg42Cys | p.R42C | O75712 | protein_coding | deleterious(0) | probably_damaging(0.93) | TCGA-D5-6930-01 | Colorectum | colon adenocarcinoma | Male | >=65 | I/II | Unknown | Unknown | SD | |
| GJB3 | SNV | Missense_Mutation | rs759759043 | c.478N>T | p.Arg160Cys | p.R160C | O75712 | protein_coding | deleterious(0.02) | probably_damaging(0.923) | TCGA-F4-6806-01 | Colorectum | colon adenocarcinoma | Female | <65 | I/II | Chemotherapy | irinotecan | PD |
| Page: 1 2 3 |
Top |
Related drugs of malignant transformation related genes |
| Identification of chemicals and drugs interact with genes involved in malignant transfromation |
| (DGIdb 4.0) |
| Entrez ID | Symbol | Category | Interaction Types | Drug Claim Name | Drug Name | PMIDs |
| 2707 | GJB3 | TRANSPORTER, ION CHANNEL | inhibitor | 178101095 | OCTANOL | |
| 2707 | GJB3 | TRANSPORTER, ION CHANNEL | inhibitor | 178100972 | CARBENOXOLONE | |
| 2707 | GJB3 | TRANSPORTER, ION CHANNEL | inhibitor | 135650269 | ||
| 2707 | GJB3 | TRANSPORTER, ION CHANNEL | inhibitor | 135652731 |
| Page: 1 |

Copyright 2023-Present -The University of Texas Health Science Center at Houston |