
|
|||||
|
 | |
| |
| |
| |
| |
| |
|
Gene: GJA1 |
Gene summary for GJA1 |
| Gene information | Species | Human | Gene symbol | GJA1 | Gene ID | 2697 |
| Gene name | gap junction protein alpha 1 | |
| Gene Alias | AVSD3 | |
| Cytomap | 6q22.31 | |
| Gene Type | protein-coding | GO ID | GO:0000003 | UniProtAcc | P17302 |
Top |
Malignant transformation analysis |
| Identification of the aberrant gene expression in precancerous and cancerous lesions by comparing the gene expression of stem-like cells in diseased tissues with normal stem cells |
| Entrez ID | Symbol | Replicates | Species | Organ | Tissue | Adj P-value | Log2FC | Malignancy |
| 2697 | GJA1 | GSM4909281 | Human | Breast | IDC | 4.46e-03 | 1.35e-01 | 0.21 |
| 2697 | GJA1 | GSM4909285 | Human | Breast | IDC | 1.64e-16 | 3.69e-01 | 0.21 |
| 2697 | GJA1 | GSM4909293 | Human | Breast | IDC | 1.31e-09 | 1.97e-01 | 0.1581 |
| 2697 | GJA1 | GSM4909302 | Human | Breast | IDC | 2.33e-26 | 7.65e-01 | 0.1545 |
| 2697 | GJA1 | GSM4909304 | Human | Breast | IDC | 3.23e-92 | 1.23e+00 | 0.1636 |
| 2697 | GJA1 | NCCBC3 | Human | Breast | DCIS | 3.60e-04 | 2.67e-01 | 0.1198 |
| 2697 | GJA1 | DCIS2 | Human | Breast | DCIS | 6.85e-04 | 4.56e-03 | 0.0085 |
| 2697 | GJA1 | CA_HPV_1 | Human | Cervix | CC | 5.98e-15 | -3.54e-01 | 0.0264 |
| 2697 | GJA1 | CA_HPV_3 | Human | Cervix | CC | 1.92e-19 | 6.06e-01 | 0.0414 |
| 2697 | GJA1 | HSIL_HPV_1 | Human | Cervix | HSIL_HPV | 1.67e-02 | -2.25e-01 | 0.0116 |
| 2697 | GJA1 | HSIL_HPV_2 | Human | Cervix | HSIL_HPV | 6.25e-04 | -2.56e-01 | 0.0208 |
| 2697 | GJA1 | CCI_2 | Human | Cervix | CC | 1.57e-02 | -3.61e-01 | 0.5249 |
| 2697 | GJA1 | CCII_1 | Human | Cervix | CC | 3.85e-07 | -3.61e-01 | 0.3249 |
| 2697 | GJA1 | Tumor | Human | Cervix | CC | 2.37e-29 | 8.31e-01 | 0.1241 |
| 2697 | GJA1 | sample3 | Human | Cervix | CC | 6.55e-28 | 7.49e-01 | 0.1387 |
| 2697 | GJA1 | H2 | Human | Cervix | HSIL_HPV | 2.29e-06 | -3.02e-01 | 0.0632 |
| 2697 | GJA1 | T3 | Human | Cervix | CC | 1.71e-27 | 7.59e-01 | 0.1389 |
| 2697 | GJA1 | AEH-subject1 | Human | Endometrium | AEH | 2.24e-23 | -6.47e-01 | -0.3059 |
| 2697 | GJA1 | AEH-subject2 | Human | Endometrium | AEH | 7.92e-19 | -5.99e-01 | -0.2525 |
| 2697 | GJA1 | AEH-subject3 | Human | Endometrium | AEH | 3.92e-14 | -5.71e-01 | -0.2576 |
| Page: 1 2 3 4 5 6 7 |
| Tissue | Expression Dynamics | Abbreviation |
| Breast | 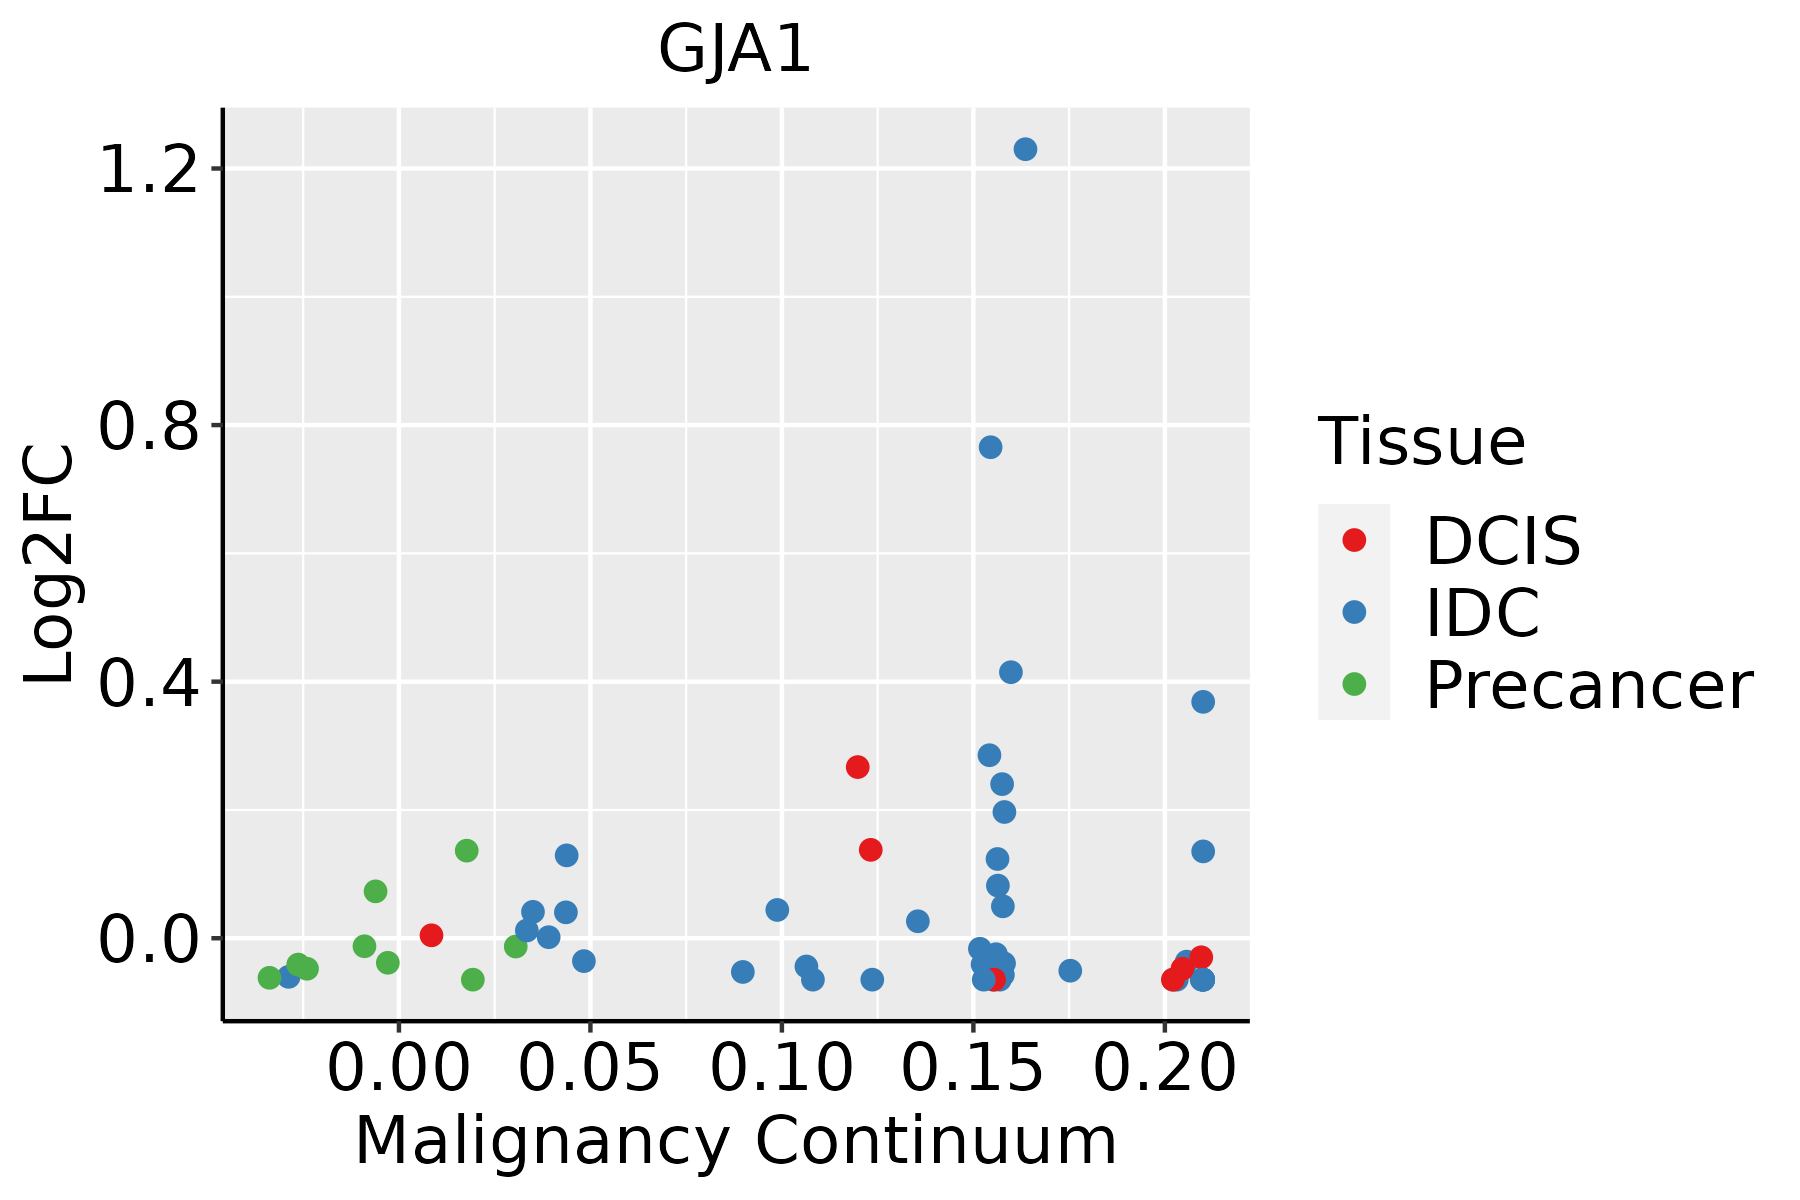 | IDC: Invasive ductal carcinoma |
| DCIS: Ductal carcinoma in situ | ||
| Precancer(BRCA1-mut): Precancerous lesion from BRCA1 mutation carriers | ||
| Cervix | 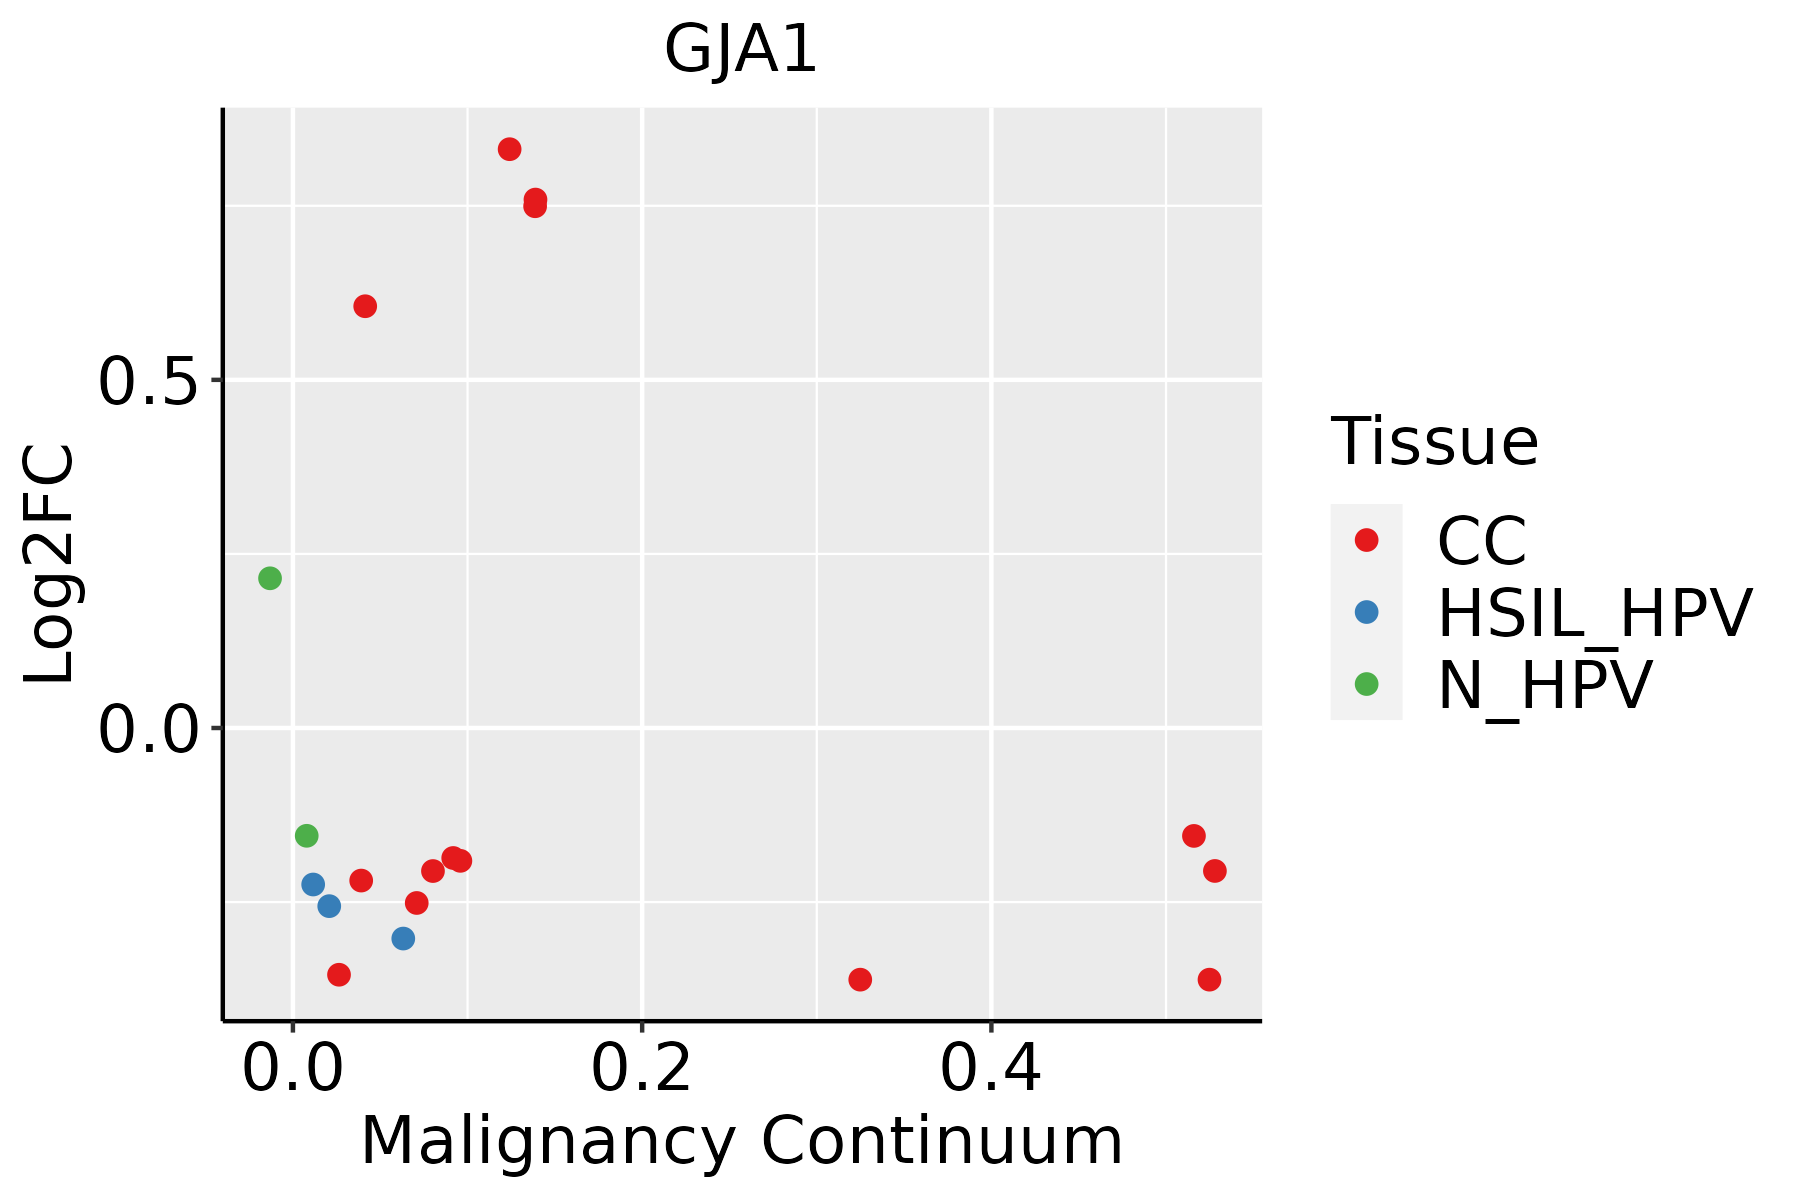 | CC: Cervix cancer |
| HSIL_HPV: HPV-infected high-grade squamous intraepithelial lesions | ||
| N_HPV: HPV-infected normal cervix | ||
| Endometrium | 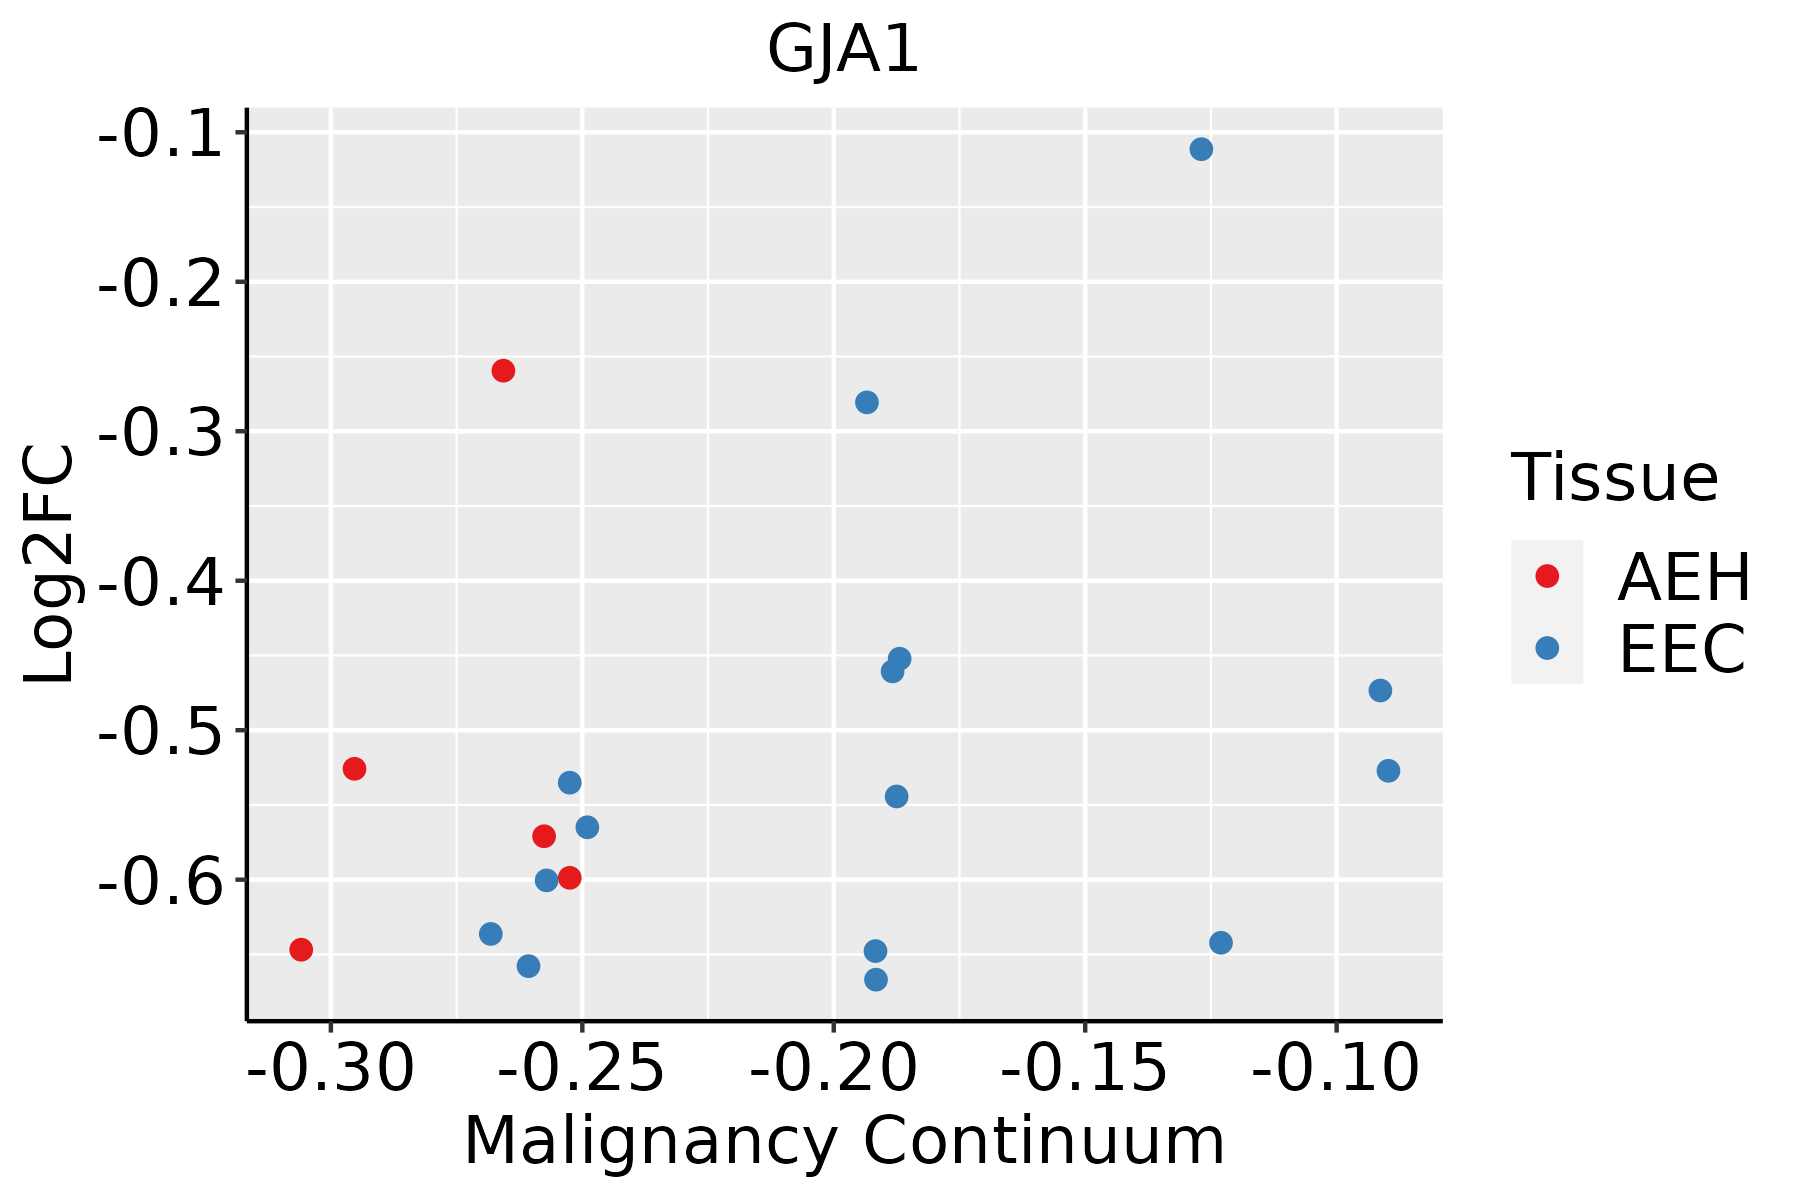 | AEH: Atypical endometrial hyperplasia |
| EEC: Endometrioid Cancer | ||
| Esophagus | 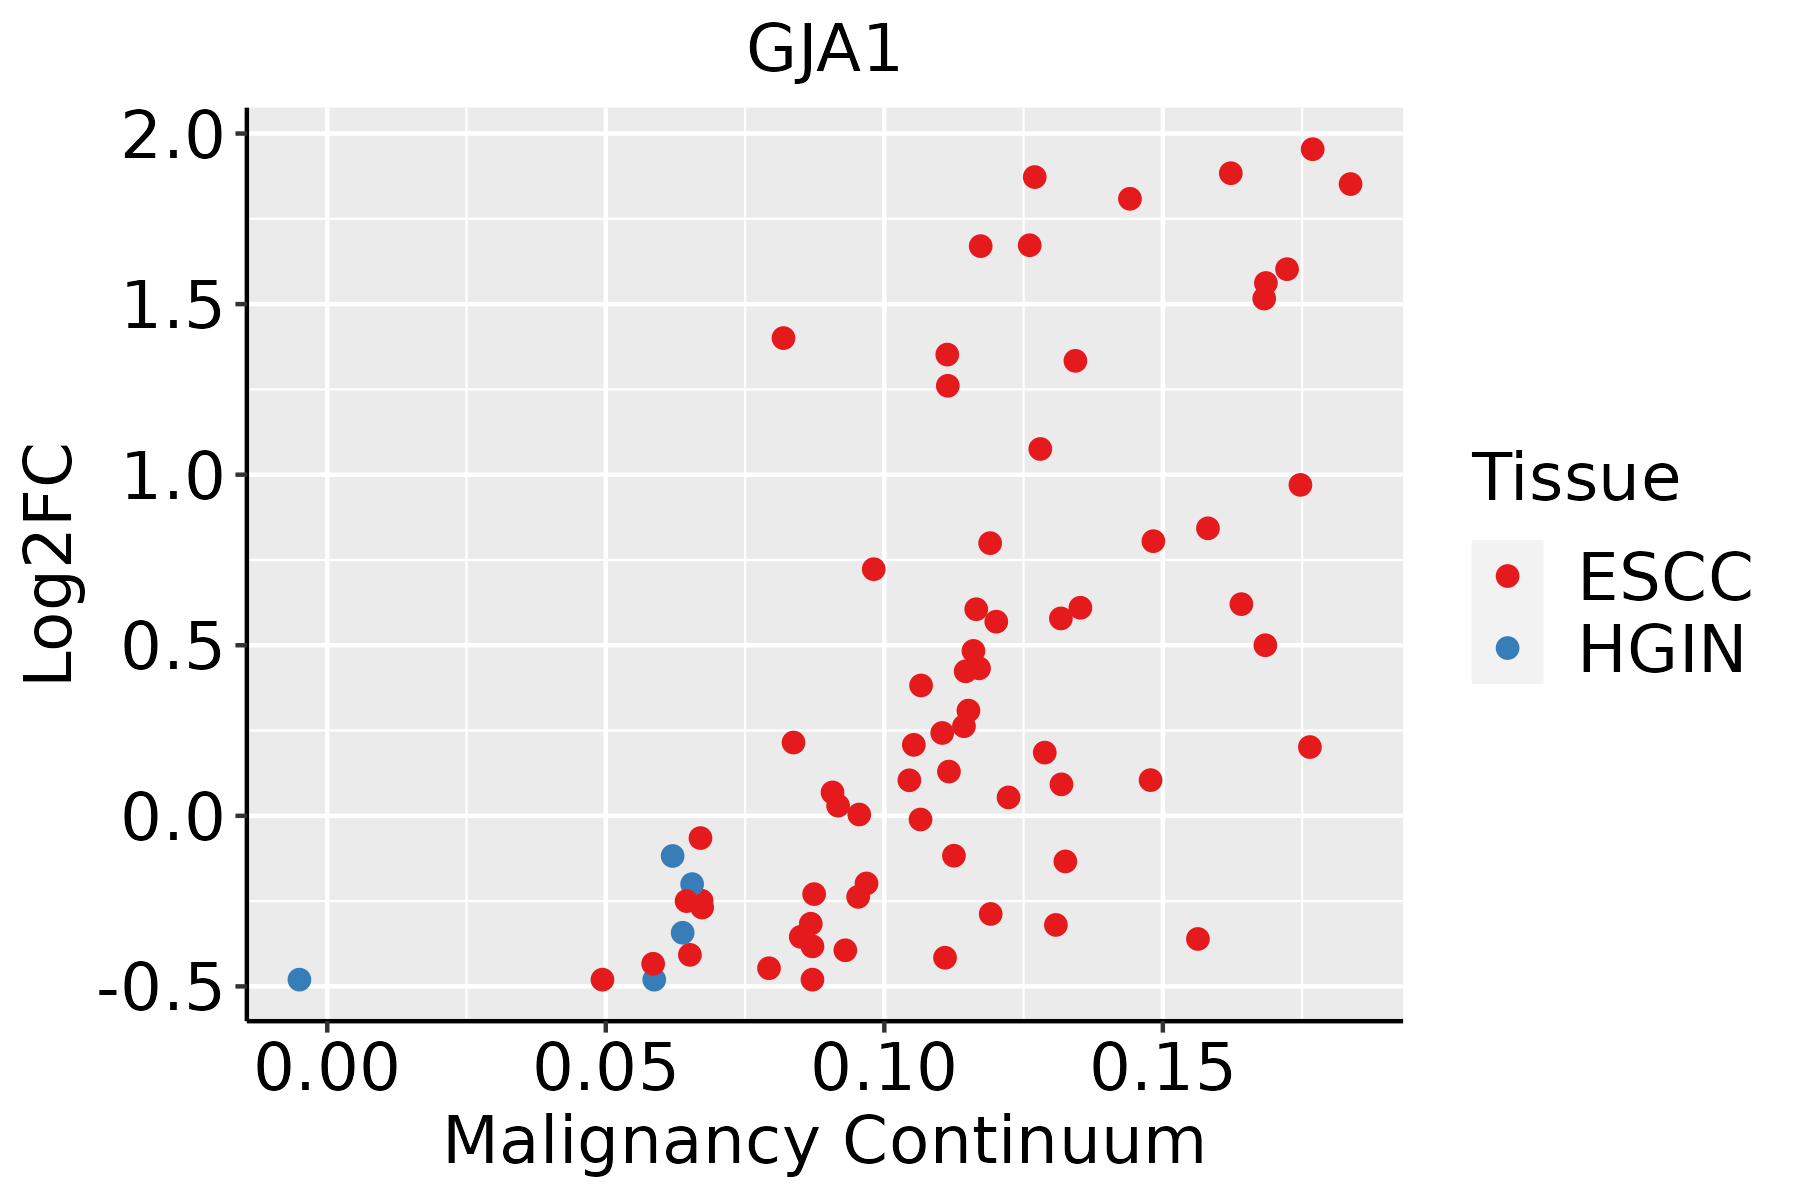 | ESCC: Esophageal squamous cell carcinoma |
| HGIN: High-grade intraepithelial neoplasias | ||
| LGIN: Low-grade intraepithelial neoplasias | ||
| Oral Cavity | 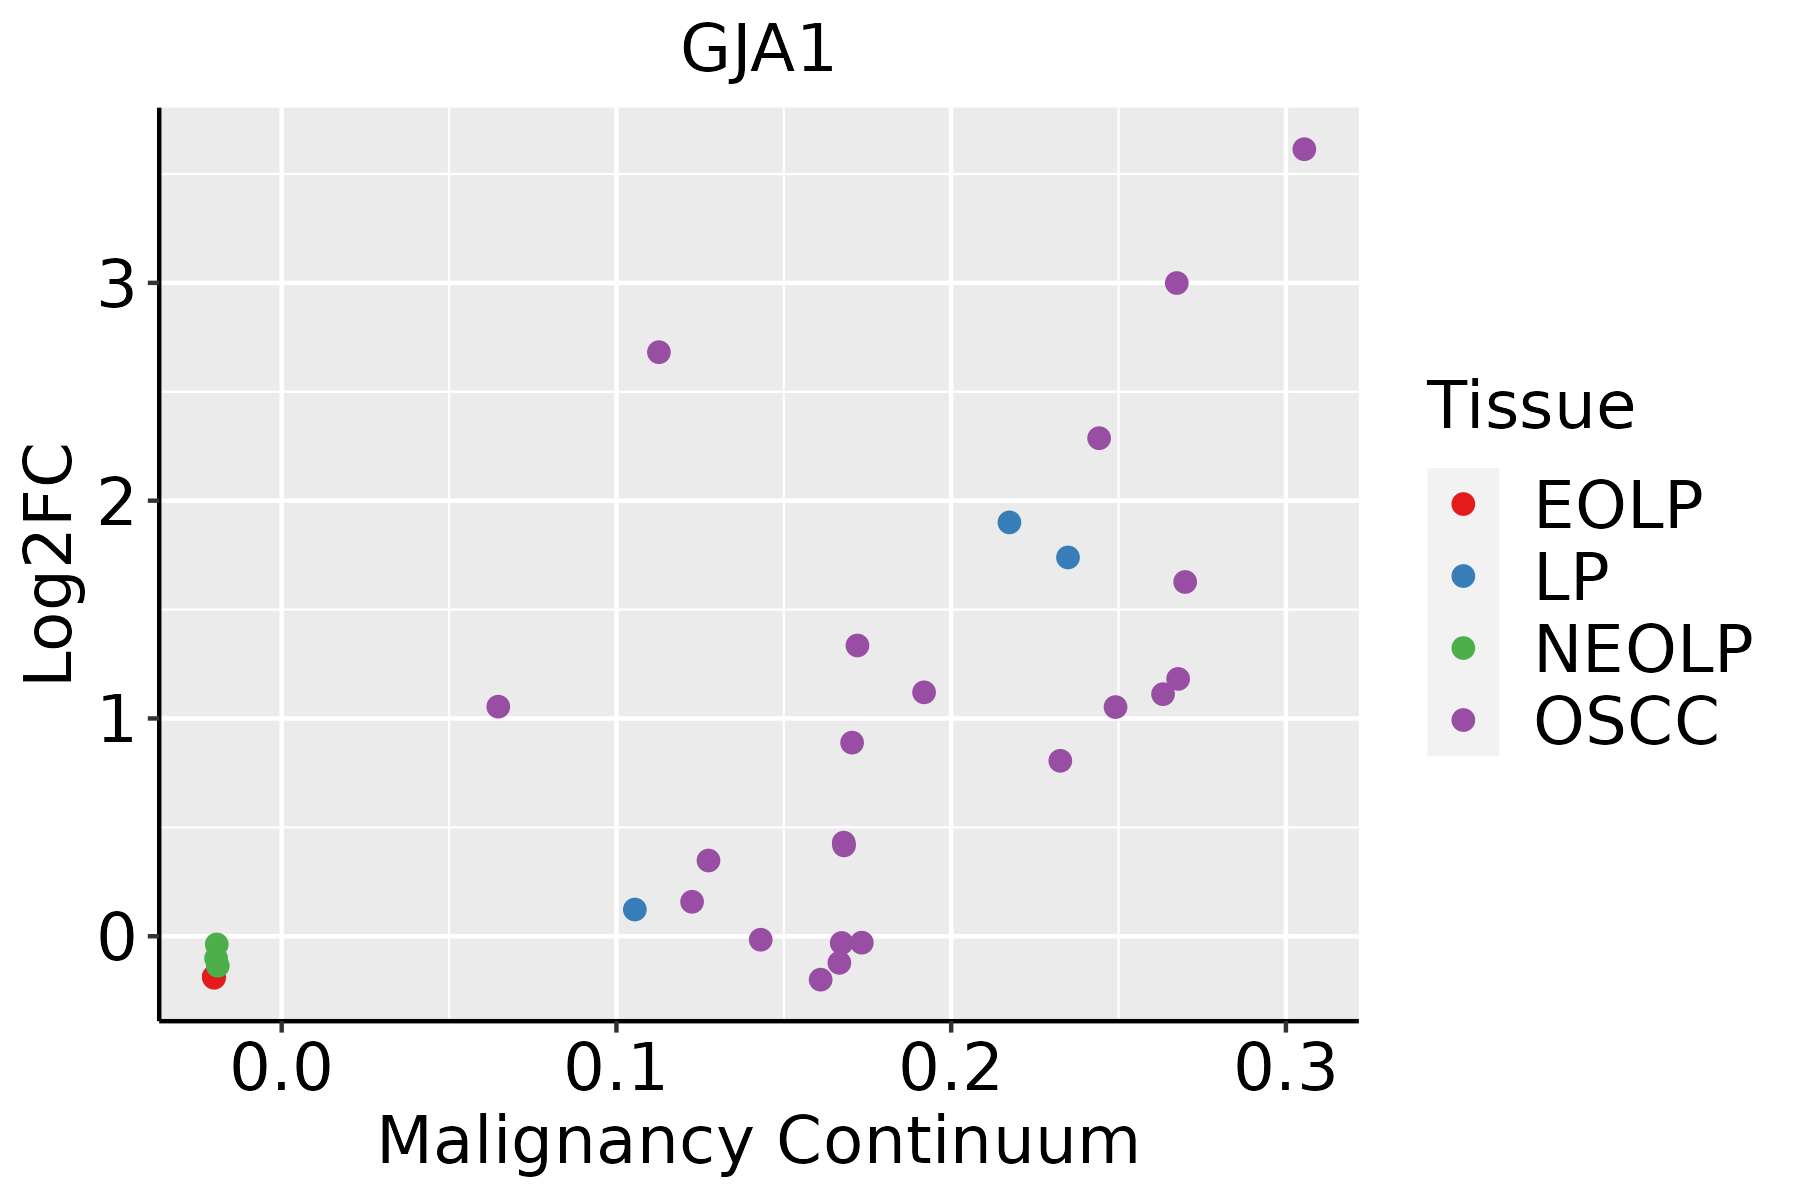 | EOLP: Erosive Oral lichen planus |
| LP: leukoplakia | ||
| NEOLP: Non-erosive oral lichen planus | ||
| OSCC: Oral squamous cell carcinoma | ||
| Skin | 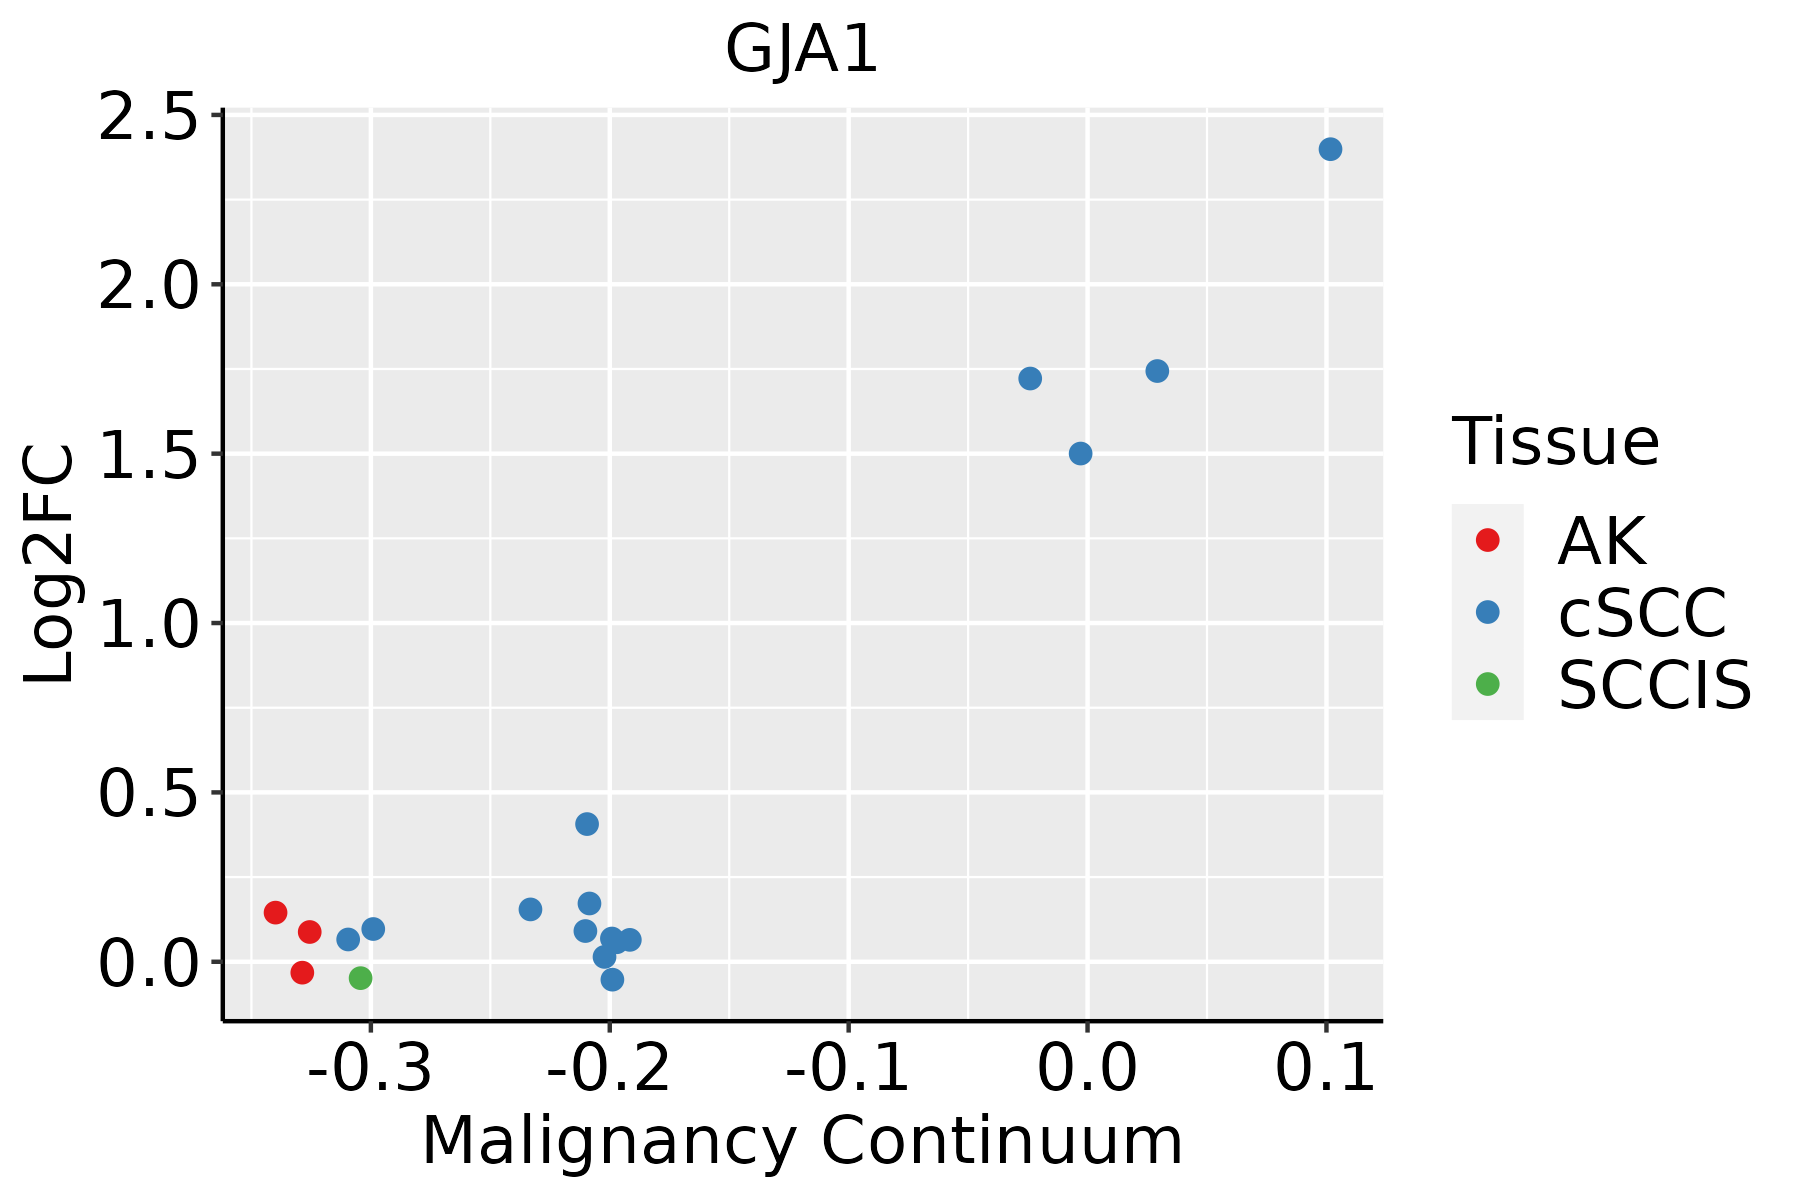 | AK: Actinic keratosis |
| cSCC: Cutaneous squamous cell carcinoma | ||
| SCCIS:squamous cell carcinoma in situ | ||
| Thyroid | 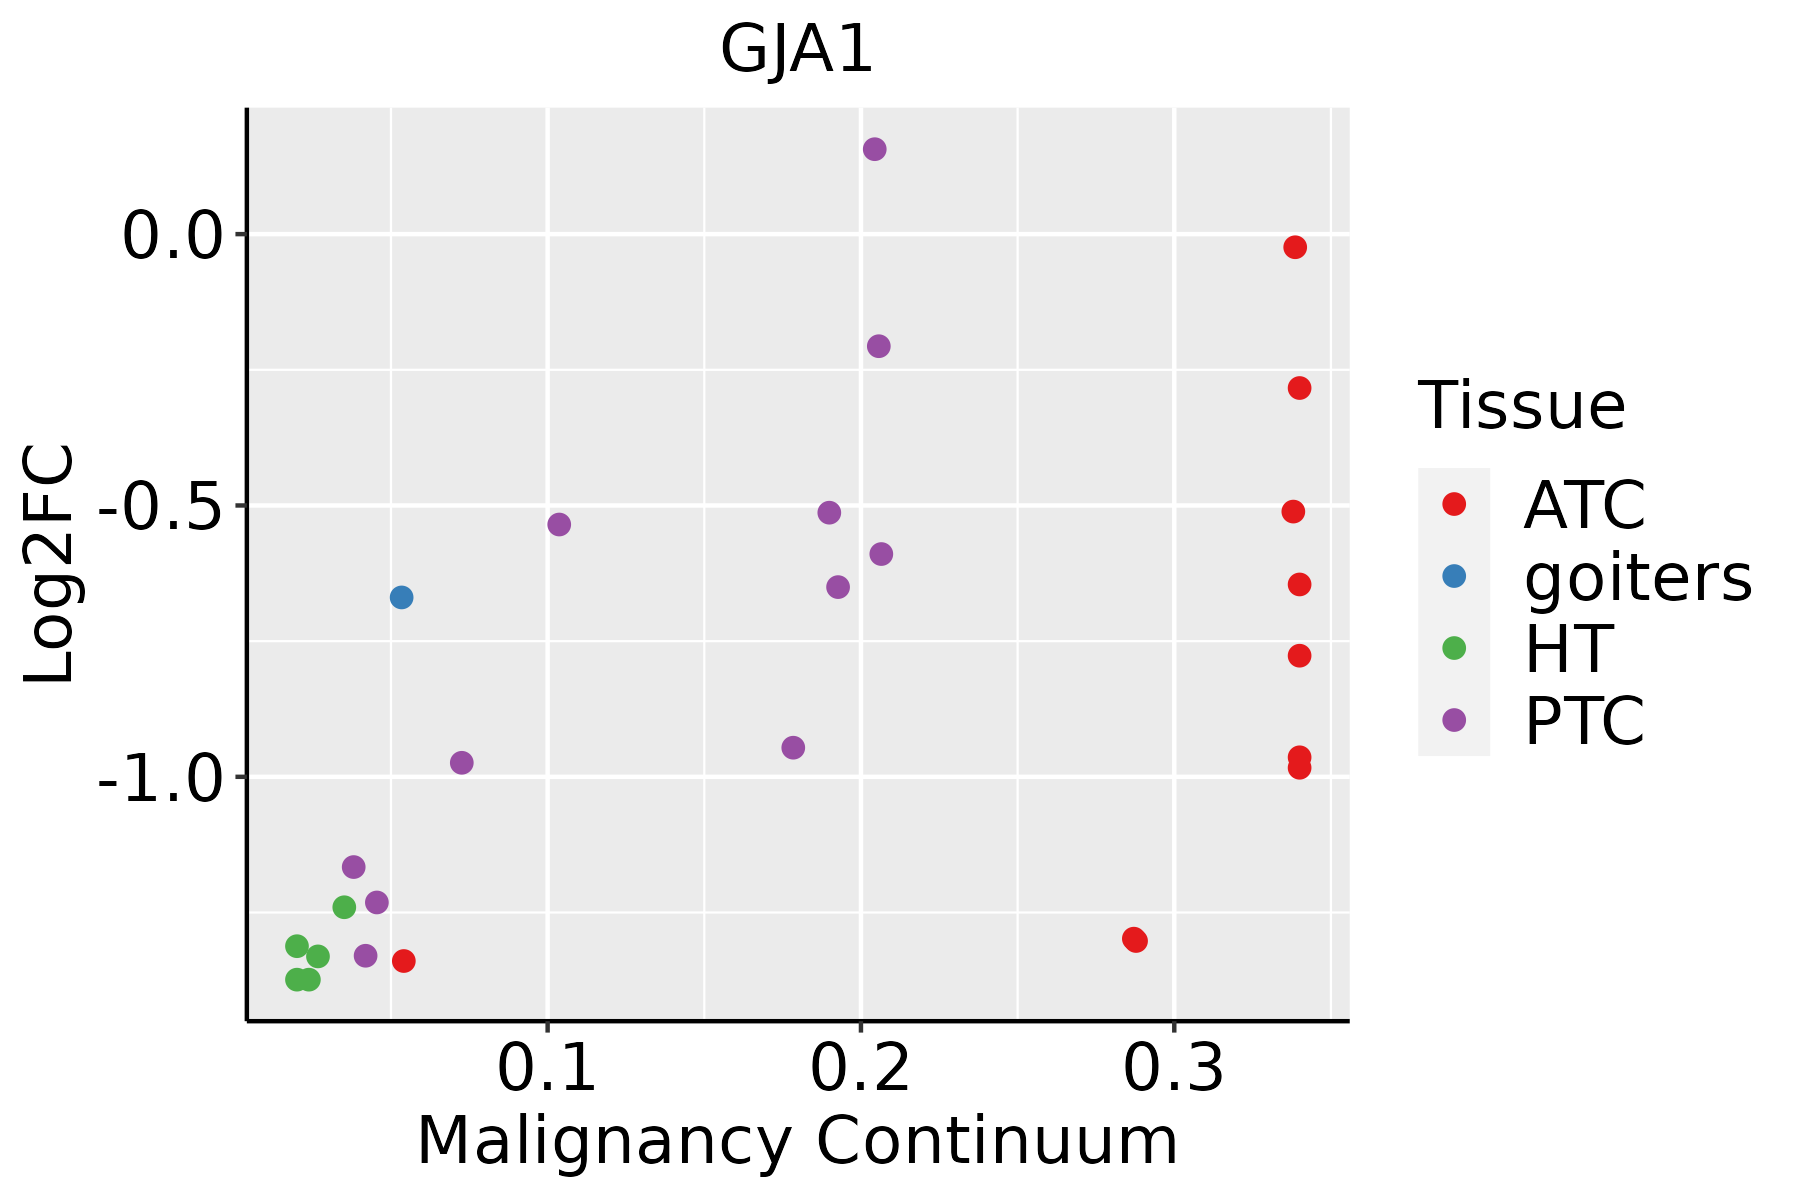 | ATC: Anaplastic thyroid cancer |
| HT: Hashimoto's thyroiditis | ||
| PTC: Papillary thyroid cancer |
| ∗log2FC in expression of this searched gene in stem-like cells from each diseased tissue sample relative to stem-like cells in normal samples in each tissue plotted against the malignancy continuum. Samples are colored based on if they are from different disease stage. |
Top |
Malignant transformation related pathway analysis |
| Find out the enriched GO biological processes and KEGG pathways involved in transition from healthy to precancer to cancer |
| Tissue | Disease Stage | Enriched GO biological Processes |
| Colorectum | AD |  |
| Colorectum | SER |  |
| Colorectum | MSS |  |
| Colorectum | MSI-H |  |
| Colorectum | FAP |  |
| ∗Top 15 enriched GO BP terms are showed in the bar plot of each disease state in each tissue. Each row represents a significant GO biological process which is colored according to the -log10(p.adjust). |
| Page: 1 2 3 4 5 6 7 8 9 |
| GO ID | Tissue | Disease Stage | Description | Gene Ratio | Bg Ratio | pvalue | p.adjust | Count |
| GO:004217614 | Breast | IDC | regulation of protein catabolic process | 63/1434 | 391/18723 | 1.32e-08 | 9.61e-07 | 63 |
| GO:000756511 | Breast | IDC | female pregnancy | 39/1434 | 193/18723 | 1.81e-08 | 1.27e-06 | 39 |
| GO:00447061 | Breast | IDC | multi-multicellular organism process | 41/1434 | 220/18723 | 8.58e-08 | 5.19e-06 | 41 |
| GO:005165114 | Breast | IDC | maintenance of location in cell | 37/1434 | 214/18723 | 2.39e-06 | 9.35e-05 | 37 |
| GO:004860812 | Breast | IDC | reproductive structure development | 60/1434 | 424/18723 | 2.71e-06 | 1.03e-04 | 60 |
| GO:006145813 | Breast | IDC | reproductive system development | 60/1434 | 427/18723 | 3.41e-06 | 1.24e-04 | 60 |
| GO:000166714 | Breast | IDC | ameboidal-type cell migration | 64/1434 | 475/18723 | 6.65e-06 | 2.05e-04 | 64 |
| GO:004518514 | Breast | IDC | maintenance of protein location | 21/1434 | 94/18723 | 6.69e-06 | 2.05e-04 | 21 |
| GO:005067313 | Breast | IDC | epithelial cell proliferation | 60/1434 | 437/18723 | 7.13e-06 | 2.15e-04 | 60 |
| GO:003235512 | Breast | IDC | response to estradiol | 27/1434 | 141/18723 | 7.87e-06 | 2.35e-04 | 27 |
| GO:005067812 | Breast | IDC | regulation of epithelial cell proliferation | 54/1434 | 381/18723 | 8.07e-06 | 2.39e-04 | 54 |
| GO:007097213 | Breast | IDC | protein localization to endoplasmic reticulum | 18/1434 | 74/18723 | 8.58e-06 | 2.47e-04 | 18 |
| GO:005123513 | Breast | IDC | maintenance of location | 48/1434 | 327/18723 | 9.90e-06 | 2.77e-04 | 48 |
| GO:00601352 | Breast | IDC | maternal process involved in female pregnancy | 16/1434 | 62/18723 | 1.20e-05 | 3.17e-04 | 16 |
| GO:007121413 | Breast | IDC | cellular response to abiotic stimulus | 48/1434 | 331/18723 | 1.37e-05 | 3.53e-04 | 48 |
| GO:010400413 | Breast | IDC | cellular response to environmental stimulus | 48/1434 | 331/18723 | 1.37e-05 | 3.53e-04 | 48 |
| GO:004573214 | Breast | IDC | positive regulation of protein catabolic process | 37/1434 | 231/18723 | 1.46e-05 | 3.71e-04 | 37 |
| GO:003428414 | Breast | IDC | response to monosaccharide | 36/1434 | 225/18723 | 1.94e-05 | 4.83e-04 | 36 |
| GO:003250714 | Breast | IDC | maintenance of protein location in cell | 16/1434 | 65/18723 | 2.29e-05 | 5.51e-04 | 16 |
| GO:000756611 | Breast | IDC | embryo implantation | 14/1434 | 53/18723 | 3.14e-05 | 7.32e-04 | 14 |
| Page: 1 2 3 4 5 6 7 8 9 10 11 12 13 14 15 16 17 18 19 20 21 22 23 24 25 26 27 28 29 30 31 32 33 34 35 36 37 38 39 40 41 42 43 44 45 46 47 48 49 50 51 52 53 |
| Pathway ID | Tissue | Disease Stage | Description | Gene Ratio | Bg Ratio | pvalue | p.adjust | qvalue | Count |
| hsa04540 | Cervix | CC | Gap junction | 22/1267 | 88/8465 | 9.07e-03 | 2.85e-02 | 1.69e-02 | 22 |
| hsa045401 | Cervix | CC | Gap junction | 22/1267 | 88/8465 | 9.07e-03 | 2.85e-02 | 1.69e-02 | 22 |
| hsa054127 | Cervix | HSIL_HPV | Arrhythmogenic right ventricular cardiomyopathy | 10/459 | 77/8465 | 8.34e-03 | 4.70e-02 | 3.80e-02 | 10 |
| hsa0541212 | Cervix | HSIL_HPV | Arrhythmogenic right ventricular cardiomyopathy | 10/459 | 77/8465 | 8.34e-03 | 4.70e-02 | 3.80e-02 | 10 |
| Page: 1 |
Top |
Cell-cell communication analysis |
| Identification of potential cell-cell interactions between two cell types and their ligand-receptor pairs for different disease states |
| Ligand | Receptor | LRpair | Pathway | Tissue | Disease Stage |
| Page: 1 |
Top |
Single-cell gene regulatory network inference analysis |
| Find out the significant the regulons (TFs) and the target genes of each regulon across cell types for different disease states |
| TF | Cell Type | Tissue | Disease Stage | Target Gene | RSS | Regulon Activity |
| ∗The dot plots of a searched regulon are shown for all cell subpopulations in each disease state of each tissue based on the regulon specific score inferred using pySCENIC and by calculating the average expression. |
| Page: 1 |
Top |
Somatic mutation of malignant transformation related genes |
| Annotation of somatic variants for genes involved in malignant transformation |
| Hugo Symbol | Variant Class | Variant Classification | dbSNP RS | HGVSc | HGVSp | HGVSp Short | SWISSPROT | BIOTYPE | SIFT | PolyPhen | Tumor Sample Barcode | Tissue | Histology | Sex | Age | Stage | Therapy Types | Drugs | Outcome |
| GJA1 | SNV | Missense_Mutation | c.380N>G | p.Leu127Trp | p.L127W | P17302 | protein_coding | deleterious(0.02) | possibly_damaging(0.849) | TCGA-A2-A0EO-01 | Breast | breast invasive carcinoma | Female | <65 | I/II | Hormone Therapy | tamoxiphen | SD | |
| GJA1 | SNV | Missense_Mutation | novel | c.359N>C | p.Gly120Ala | p.G120A | P17302 | protein_coding | tolerated(0.11) | benign(0.063) | TCGA-A8-A09X-01 | Breast | breast invasive carcinoma | Female | <65 | III/IV | Unknown | Unknown | SD |
| GJA1 | SNV | Missense_Mutation | rs774210184 | c.826N>A | p.Ala276Thr | p.A276T | P17302 | protein_coding | tolerated(0.17) | benign(0.432) | TCGA-AC-A7VB-01 | Breast | breast invasive carcinoma | Female | <65 | I/II | Unknown | Unknown | SD |
| GJA1 | SNV | Missense_Mutation | novel | c.548C>A | p.Ala183Asp | p.A183D | P17302 | protein_coding | deleterious(0) | possibly_damaging(0.765) | TCGA-AN-A046-01 | Breast | breast invasive carcinoma | Female | >=65 | I/II | Unknown | Unknown | SD |
| GJA1 | SNV | Missense_Mutation | rs759494167 | c.956G>A | p.Arg319Gln | p.R319Q | P17302 | protein_coding | tolerated(0.61) | benign(0.007) | TCGA-AN-A046-01 | Breast | breast invasive carcinoma | Female | >=65 | I/II | Unknown | Unknown | SD |
| GJA1 | SNV | Missense_Mutation | c.950N>G | p.Gln317Arg | p.Q317R | P17302 | protein_coding | tolerated(0.25) | possibly_damaging(0.895) | TCGA-AN-A0XU-01 | Breast | breast invasive carcinoma | Female | <65 | I/II | Unknown | Unknown | SD | |
| GJA1 | insertion | Frame_Shift_Ins | novel | c.568_569insT | p.Asp190ValfsTer38 | p.D190Vfs*38 | P17302 | protein_coding | TCGA-A8-A08H-01 | Breast | breast invasive carcinoma | Female | >=65 | I/II | Unknown | Unknown | SD | ||
| GJA1 | insertion | In_Frame_Ins | novel | c.570_571insATTTCCATACAG | p.Asp190_Pro191insIleSerIleGln | p.D190_P191insISIQ | P17302 | protein_coding | TCGA-A8-A08H-01 | Breast | breast invasive carcinoma | Female | >=65 | I/II | Unknown | Unknown | SD | ||
| GJA1 | SNV | Missense_Mutation | c.119C>T | p.Ala40Val | p.A40V | P17302 | protein_coding | deleterious(0) | probably_damaging(0.99) | TCGA-2W-A8YY-01 | Cervix | cervical & endocervical cancer | Female | <65 | I/II | Chemotherapy | cisplatin | CR | |
| GJA1 | SNV | Missense_Mutation | c.989N>T | p.Ser330Phe | p.S330F | P17302 | protein_coding | deleterious(0) | benign(0.336) | TCGA-DG-A2KK-01 | Cervix | cervical & endocervical cancer | Female | <65 | III/IV | Chemotherapy | cisplatin | SD |
| Page: 1 2 3 4 5 6 7 |
Top |
Related drugs of malignant transformation related genes |
| Identification of chemicals and drugs interact with genes involved in malignant transfromation |
| (DGIdb 4.0) |
| Entrez ID | Symbol | Category | Interaction Types | Drug Claim Name | Drug Name | PMIDs |
| 2697 | GJA1 | ION CHANNEL | BLEOMYCIN | BLEOMYCIN | 16600115 | |
| 2697 | GJA1 | ION CHANNEL | CARVEDILOL | CARVEDILOL | 16448880 | |
| 2697 | GJA1 | ION CHANNEL | inhibitor | 178100972 | CARBENOXOLONE | |
| 2697 | GJA1 | ION CHANNEL | PROTEASE INHIBITOR | 15870950 | ||
| 2697 | GJA1 | ION CHANNEL | PROTEASOME INHIBITOR | 16829709 | ||
| 2697 | GJA1 | ION CHANNEL | Act1 | |||
| 2697 | GJA1 | ION CHANNEL | EGCG | EPIGALOCATECHIN GALLATE | 15736408 | |
| 2697 | GJA1 | ION CHANNEL | PROPYLTHIOURACIL | PROPYLTHIOURACIL | 12606457 | |
| 2697 | GJA1 | ION CHANNEL | VITAMIN C | 16448880 | ||
| 2697 | GJA1 | ION CHANNEL | inhibitor | 135650269 |
| Page: 1 2 |

Copyright 2023-Present -The University of Texas Health Science Center at Houston |