
|
|||||
|
 | |
| |
| |
| |
| |
| |
|
Gene: GIT2 |
Gene summary for GIT2 |
| Gene information | Species | Human | Gene symbol | GIT2 | Gene ID | 9815 |
| Gene name | GIT ArfGAP 2 | |
| Gene Alias | CAT-2 | |
| Cytomap | 12q24.11 | |
| Gene Type | protein-coding | GO ID | GO:0007154 | UniProtAcc | Q14161 |
Top |
Malignant transformation analysis |
| Identification of the aberrant gene expression in precancerous and cancerous lesions by comparing the gene expression of stem-like cells in diseased tissues with normal stem cells |
| Entrez ID | Symbol | Replicates | Species | Organ | Tissue | Adj P-value | Log2FC | Malignancy |
| 9815 | GIT2 | LZE4T | Human | Esophagus | ESCC | 6.03e-07 | 2.20e-01 | 0.0811 |
| 9815 | GIT2 | LZE7T | Human | Esophagus | ESCC | 3.83e-06 | 2.51e-01 | 0.0667 |
| 9815 | GIT2 | LZE8T | Human | Esophagus | ESCC | 1.99e-04 | 1.28e-01 | 0.067 |
| 9815 | GIT2 | LZE24T | Human | Esophagus | ESCC | 6.42e-15 | 2.28e-01 | 0.0596 |
| 9815 | GIT2 | LZE21T | Human | Esophagus | ESCC | 3.93e-02 | 1.32e-01 | 0.0655 |
| 9815 | GIT2 | P1T-E | Human | Esophagus | ESCC | 9.02e-10 | 2.45e-01 | 0.0875 |
| 9815 | GIT2 | P2T-E | Human | Esophagus | ESCC | 4.21e-30 | 4.71e-01 | 0.1177 |
| 9815 | GIT2 | P4T-E | Human | Esophagus | ESCC | 4.23e-08 | 2.10e-01 | 0.1323 |
| 9815 | GIT2 | P5T-E | Human | Esophagus | ESCC | 3.05e-15 | 1.12e-01 | 0.1327 |
| 9815 | GIT2 | P8T-E | Human | Esophagus | ESCC | 5.92e-27 | 2.90e-01 | 0.0889 |
| 9815 | GIT2 | P9T-E | Human | Esophagus | ESCC | 1.85e-05 | 1.58e-01 | 0.1131 |
| 9815 | GIT2 | P10T-E | Human | Esophagus | ESCC | 3.56e-25 | 2.14e-01 | 0.116 |
| 9815 | GIT2 | P11T-E | Human | Esophagus | ESCC | 8.23e-10 | 3.90e-01 | 0.1426 |
| 9815 | GIT2 | P12T-E | Human | Esophagus | ESCC | 4.99e-16 | 1.69e-01 | 0.1122 |
| 9815 | GIT2 | P15T-E | Human | Esophagus | ESCC | 9.03e-10 | 2.60e-01 | 0.1149 |
| 9815 | GIT2 | P16T-E | Human | Esophagus | ESCC | 7.61e-22 | 2.60e-01 | 0.1153 |
| 9815 | GIT2 | P17T-E | Human | Esophagus | ESCC | 3.34e-11 | 3.37e-01 | 0.1278 |
| 9815 | GIT2 | P19T-E | Human | Esophagus | ESCC | 1.72e-03 | 2.64e-01 | 0.1662 |
| 9815 | GIT2 | P20T-E | Human | Esophagus | ESCC | 2.60e-16 | 3.02e-01 | 0.1124 |
| 9815 | GIT2 | P21T-E | Human | Esophagus | ESCC | 2.72e-16 | 2.22e-01 | 0.1617 |
| Page: 1 2 3 4 |
| Tissue | Expression Dynamics | Abbreviation |
| Esophagus | 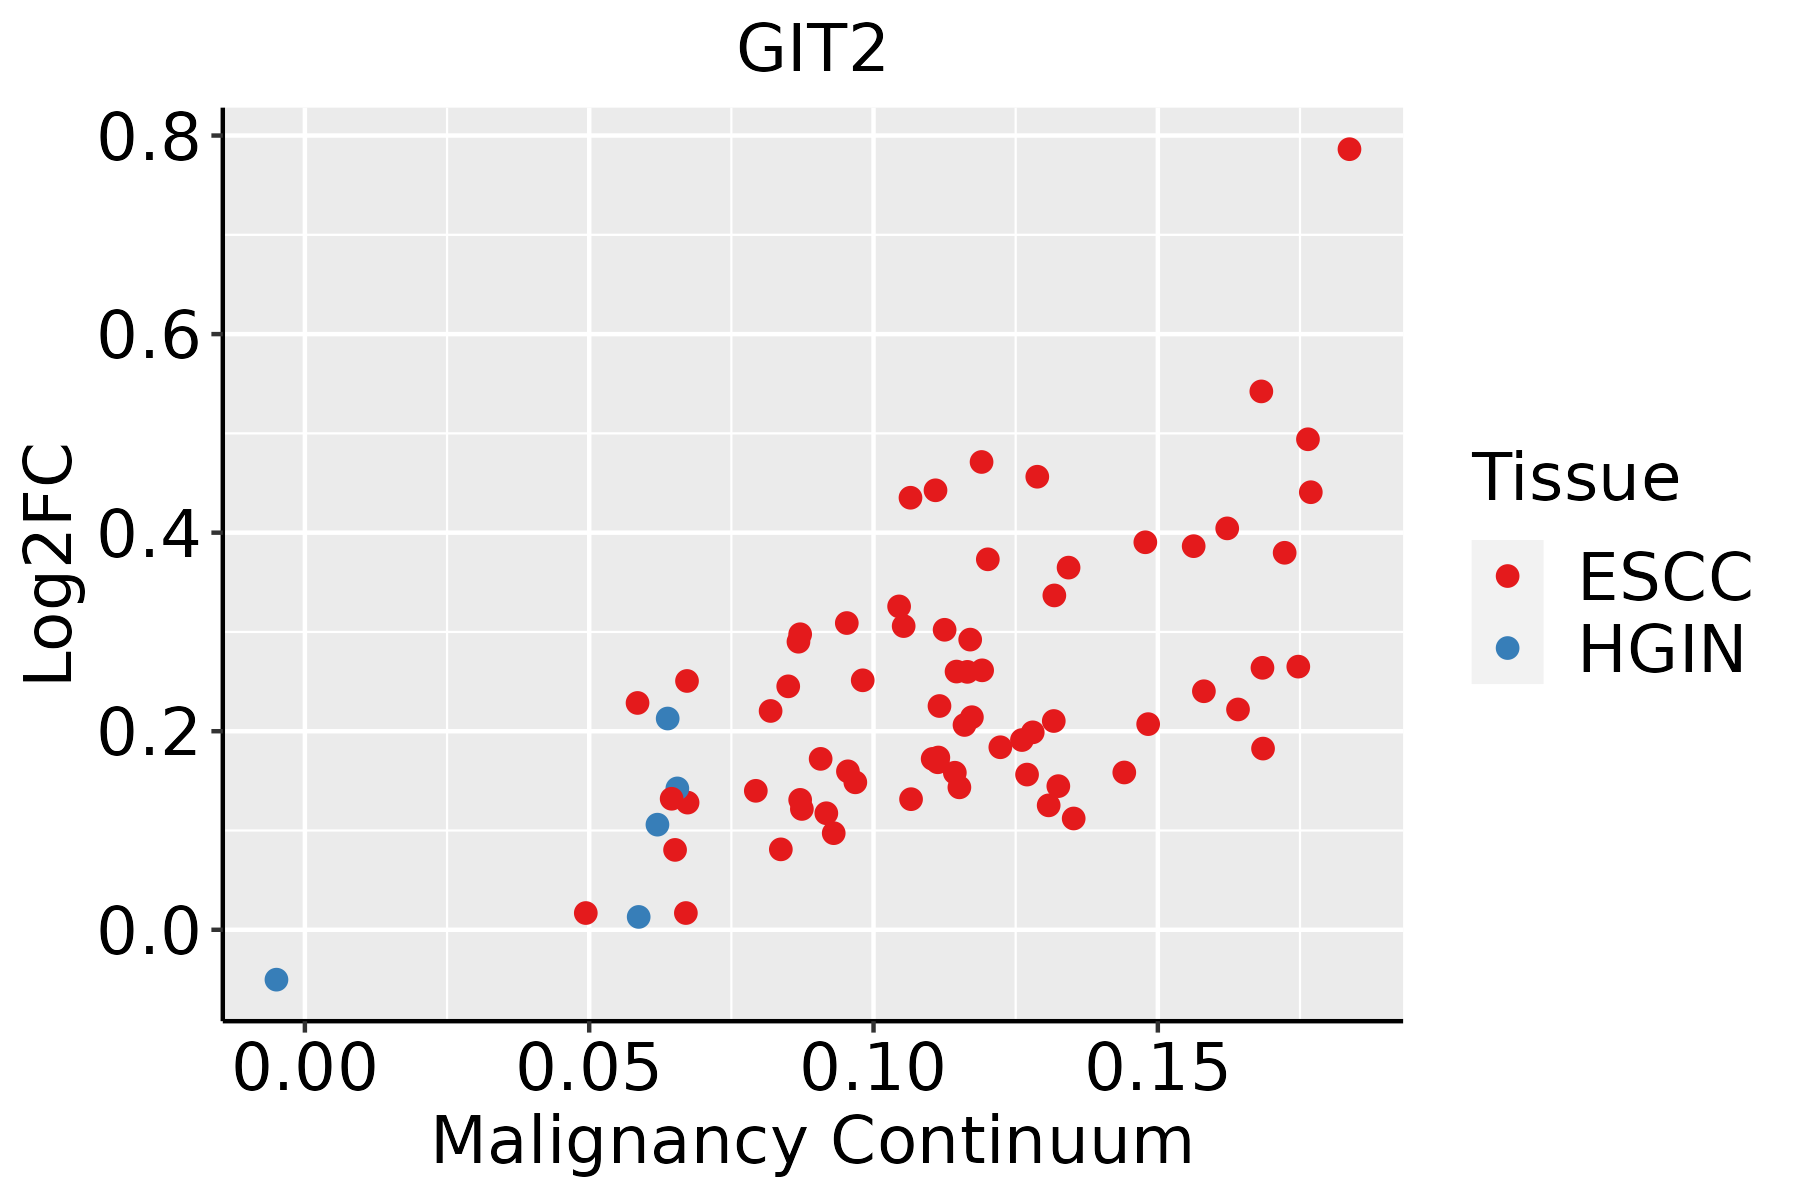 | ESCC: Esophageal squamous cell carcinoma |
| HGIN: High-grade intraepithelial neoplasias | ||
| LGIN: Low-grade intraepithelial neoplasias | ||
| Liver | 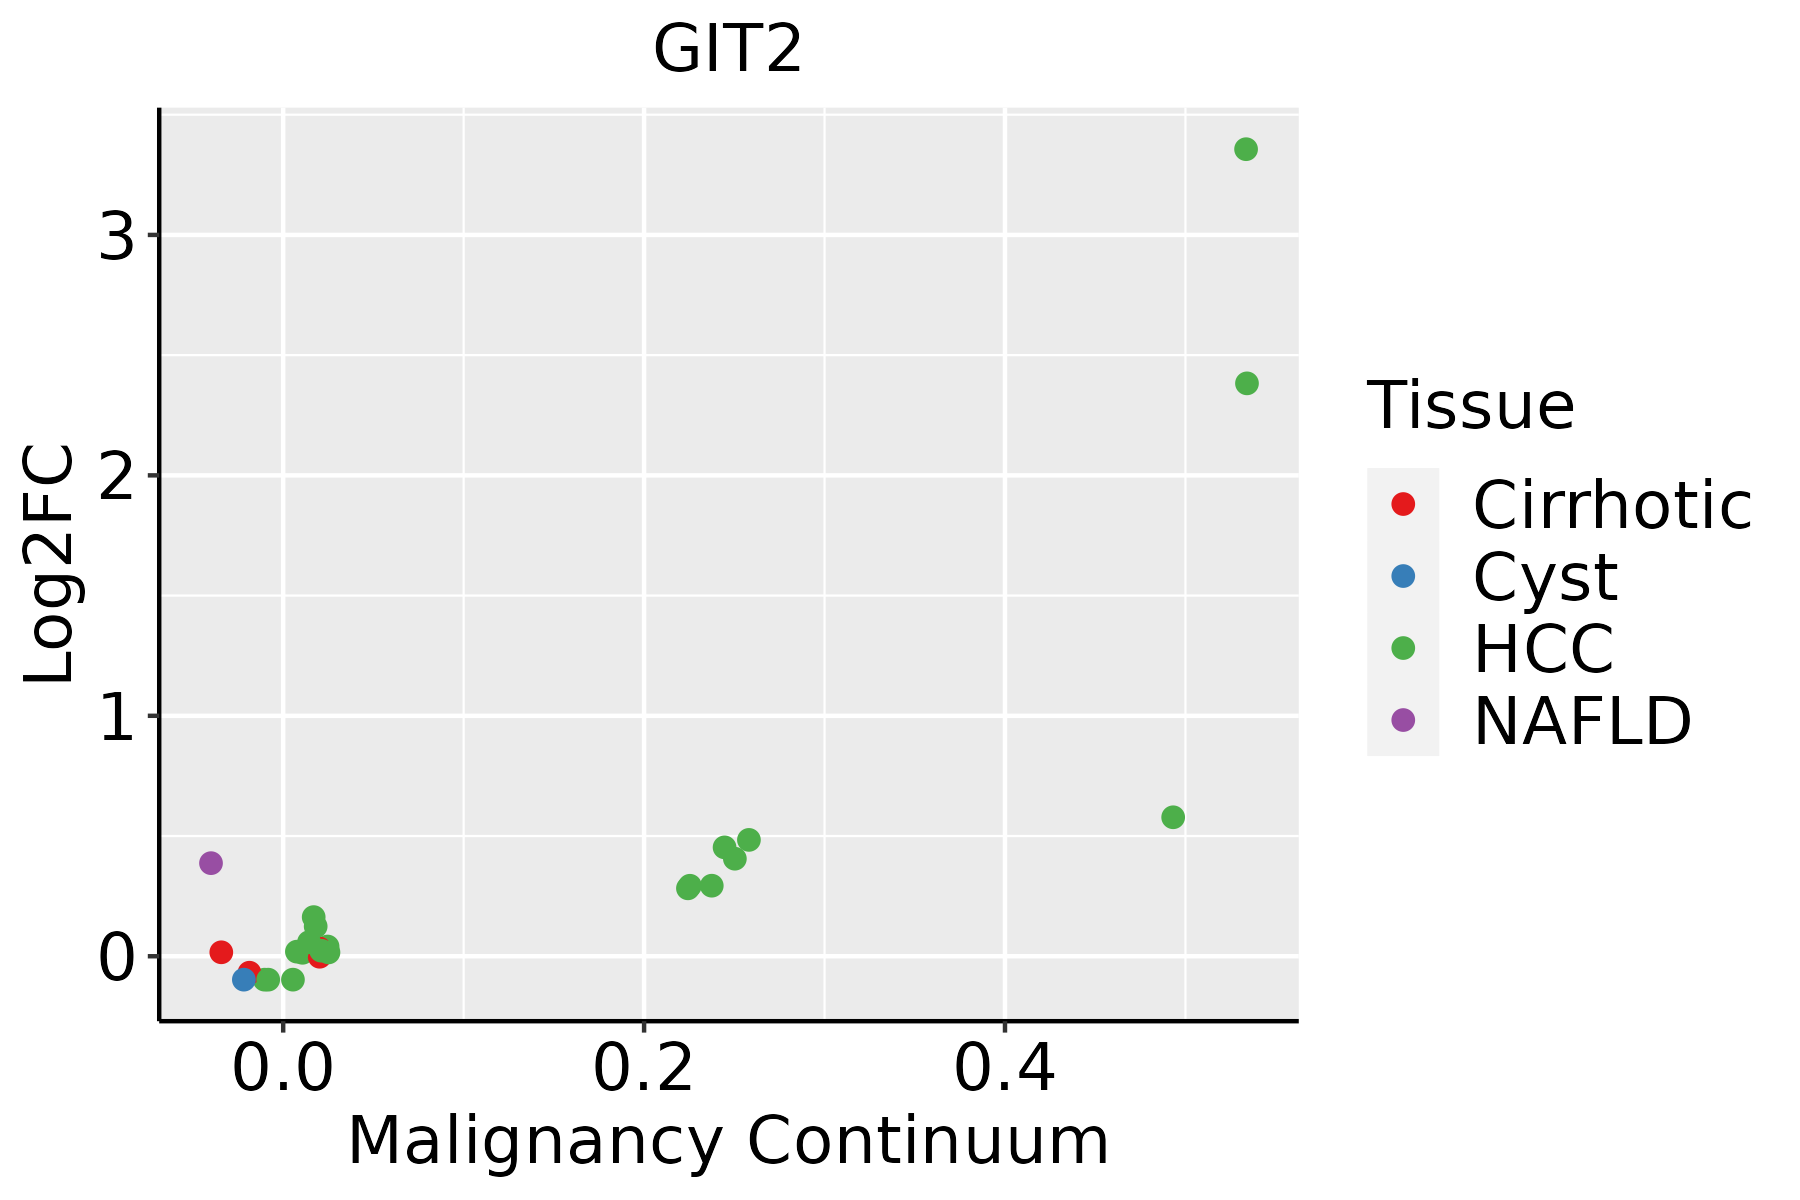 | HCC: Hepatocellular carcinoma |
| NAFLD: Non-alcoholic fatty liver disease |
| ∗log2FC in expression of this searched gene in stem-like cells from each diseased tissue sample relative to stem-like cells in normal samples in each tissue plotted against the malignancy continuum. Samples are colored based on if they are from different disease stage. |
Top |
Malignant transformation related pathway analysis |
| Find out the enriched GO biological processes and KEGG pathways involved in transition from healthy to precancer to cancer |
| Tissue | Disease Stage | Enriched GO biological Processes |
| Colorectum | AD |  |
| Colorectum | SER |  |
| Colorectum | MSS |  |
| Colorectum | MSI-H |  |
| Colorectum | FAP |  |
| ∗Top 15 enriched GO BP terms are showed in the bar plot of each disease state in each tissue. Each row represents a significant GO biological process which is colored according to the -log10(p.adjust). |
| Page: 1 2 3 4 5 6 7 8 9 |
| GO ID | Tissue | Disease Stage | Description | Gene Ratio | Bg Ratio | pvalue | p.adjust | Count |
| Page: 1 |
| Pathway ID | Tissue | Disease Stage | Description | Gene Ratio | Bg Ratio | pvalue | p.adjust | qvalue | Count |
| hsa04144210 | Esophagus | ESCC | Endocytosis | 186/4205 | 251/8465 | 9.74e-16 | 4.66e-14 | 2.39e-14 | 186 |
| hsa0513526 | Esophagus | ESCC | Yersinia infection | 100/4205 | 137/8465 | 1.80e-08 | 1.59e-07 | 8.12e-08 | 100 |
| hsa0414437 | Esophagus | ESCC | Endocytosis | 186/4205 | 251/8465 | 9.74e-16 | 4.66e-14 | 2.39e-14 | 186 |
| hsa05135111 | Esophagus | ESCC | Yersinia infection | 100/4205 | 137/8465 | 1.80e-08 | 1.59e-07 | 8.12e-08 | 100 |
| hsa0513512 | Liver | NAFLD | Yersinia infection | 33/1043 | 137/8465 | 9.44e-05 | 1.94e-03 | 1.56e-03 | 33 |
| hsa0513513 | Liver | NAFLD | Yersinia infection | 33/1043 | 137/8465 | 9.44e-05 | 1.94e-03 | 1.56e-03 | 33 |
| hsa0414422 | Liver | HCC | Endocytosis | 178/4020 | 251/8465 | 2.03e-14 | 5.22e-13 | 2.91e-13 | 178 |
| hsa0513542 | Liver | HCC | Yersinia infection | 92/4020 | 137/8465 | 2.25e-06 | 2.19e-05 | 1.22e-05 | 92 |
| hsa0414432 | Liver | HCC | Endocytosis | 178/4020 | 251/8465 | 2.03e-14 | 5.22e-13 | 2.91e-13 | 178 |
| hsa0513552 | Liver | HCC | Yersinia infection | 92/4020 | 137/8465 | 2.25e-06 | 2.19e-05 | 1.22e-05 | 92 |
| Page: 1 |
Top |
Cell-cell communication analysis |
| Identification of potential cell-cell interactions between two cell types and their ligand-receptor pairs for different disease states |
| Ligand | Receptor | LRpair | Pathway | Tissue | Disease Stage |
| Page: 1 |
Top |
Single-cell gene regulatory network inference analysis |
| Find out the significant the regulons (TFs) and the target genes of each regulon across cell types for different disease states |
| TF | Cell Type | Tissue | Disease Stage | Target Gene | RSS | Regulon Activity |
| ∗The dot plots of a searched regulon are shown for all cell subpopulations in each disease state of each tissue based on the regulon specific score inferred using pySCENIC and by calculating the average expression. |
| Page: 1 |
Top |
Somatic mutation of malignant transformation related genes |
| Annotation of somatic variants for genes involved in malignant transformation |
| Hugo Symbol | Variant Class | Variant Classification | dbSNP RS | HGVSc | HGVSp | HGVSp Short | SWISSPROT | BIOTYPE | SIFT | PolyPhen | Tumor Sample Barcode | Tissue | Histology | Sex | Age | Stage | Therapy Types | Drugs | Outcome |
| GIT2 | SNV | Missense_Mutation | rs371458058 | c.349N>A | p.Val117Ile | p.V117I | Q14161 | protein_coding | tolerated(0.15) | possibly_damaging(0.464) | TCGA-AC-A23H-01 | Breast | breast invasive carcinoma | Female | >=65 | I/II | Unknown | Unknown | PD |
| GIT2 | SNV | Missense_Mutation | c.1880N>T | p.Ala627Val | p.A627V | Q14161 | protein_coding | tolerated(0.24) | benign(0) | TCGA-D8-A27G-01 | Breast | breast invasive carcinoma | Female | >=65 | I/II | Unknown | Unknown | SD | |
| GIT2 | insertion | In_Frame_Ins | novel | c.1848_1849insGCTATACCCTGGCCT | p.Val616_Trp617insAlaIleProTrpPro | p.V616_W617insAIPWP | Q14161 | protein_coding | TCGA-B6-A0IA-01 | Breast | breast invasive carcinoma | Female | <65 | I/II | Unknown | Unknown | SD | ||
| GIT2 | deletion | Frame_Shift_Del | novel | c.2231delN | p.Lys744ArgfsTer54 | p.K744Rfs*54 | Q14161 | protein_coding | TCGA-D8-A27V-01 | Breast | breast invasive carcinoma | Female | <65 | I/II | Hormone Therapy | tamoxiphen | SD | ||
| GIT2 | SNV | Missense_Mutation | c.283N>A | p.Pro95Thr | p.P95T | Q14161 | protein_coding | deleterious(0) | possibly_damaging(0.827) | TCGA-EA-A556-01 | Cervix | cervical & endocervical cancer | Female | <65 | I/II | Unknown | Unknown | SD | |
| GIT2 | SNV | Missense_Mutation | c.2137N>A | p.Glu713Lys | p.E713K | Q14161 | protein_coding | deleterious(0) | probably_damaging(0.968) | TCGA-Q1-A73O-01 | Cervix | cervical & endocervical cancer | Female | <65 | I/II | Chemotherapy | cisplatin | CR | |
| GIT2 | SNV | Missense_Mutation | novel | c.1262N>T | p.Ser421Leu | p.S421L | Q14161 | protein_coding | deleterious(0) | possibly_damaging(0.889) | TCGA-VS-A959-01 | Cervix | cervical & endocervical cancer | Female | >=65 | I/II | Unknown | Unknown | SD |
| GIT2 | SNV | Missense_Mutation | rs746398874 | c.980N>A | p.Arg327Gln | p.R327Q | Q14161 | protein_coding | deleterious(0) | probably_damaging(0.996) | TCGA-AA-3977-01 | Colorectum | colon adenocarcinoma | Male | >=65 | I/II | Unknown | Unknown | SD |
| GIT2 | SNV | Missense_Mutation | rs767544250 | c.1418N>T | p.Ser473Leu | p.S473L | Q14161 | protein_coding | tolerated(0.22) | benign(0.001) | TCGA-AA-A00N-01 | Colorectum | colon adenocarcinoma | Male | >=65 | I/II | Unknown | Unknown | PD |
| GIT2 | SNV | Missense_Mutation | c.1576N>A | p.Leu526Ile | p.L526I | Q14161 | protein_coding | tolerated(0.42) | benign(0.41) | TCGA-AA-A010-01 | Colorectum | colon adenocarcinoma | Female | <65 | I/II | Chemotherapy | folinic | CR |
| Page: 1 2 3 4 5 6 7 8 |
Top |
Related drugs of malignant transformation related genes |
| Identification of chemicals and drugs interact with genes involved in malignant transfromation |
| (DGIdb 4.0) |
| Entrez ID | Symbol | Category | Interaction Types | Drug Claim Name | Drug Name | PMIDs |
| Page: 1 |

Copyright 2023-Present -The University of Texas Health Science Center at Houston |