
|
|||||
|
 | |
| |
| |
| |
| |
| |
|
Gene: GINS4 |
Gene summary for GINS4 |
| Gene information | Species | Human | Gene symbol | GINS4 | Gene ID | 84296 |
| Gene name | GINS complex subunit 4 | |
| Gene Alias | SLD5 | |
| Cytomap | 8p11.21 | |
| Gene Type | protein-coding | GO ID | GO:0000724 | UniProtAcc | Q9BRT9 |
Top |
Malignant transformation analysis |
| Identification of the aberrant gene expression in precancerous and cancerous lesions by comparing the gene expression of stem-like cells in diseased tissues with normal stem cells |
| Entrez ID | Symbol | Replicates | Species | Organ | Tissue | Adj P-value | Log2FC | Malignancy |
| 84296 | GINS4 | HCC1_Meng | Human | Liver | HCC | 2.16e-04 | 1.93e-02 | 0.0246 |
| 84296 | GINS4 | HCC1 | Human | Liver | HCC | 3.29e-07 | 1.30e+00 | 0.5336 |
| 84296 | GINS4 | HCC2 | Human | Liver | HCC | 3.91e-14 | 1.13e+00 | 0.5341 |
| 84296 | GINS4 | HCC5 | Human | Liver | HCC | 5.24e-18 | 1.10e+00 | 0.4932 |
| 84296 | GINS4 | S028 | Human | Liver | HCC | 6.32e-03 | 1.56e-01 | 0.2503 |
| Page: 1 |
| Tissue | Expression Dynamics | Abbreviation |
| Liver | 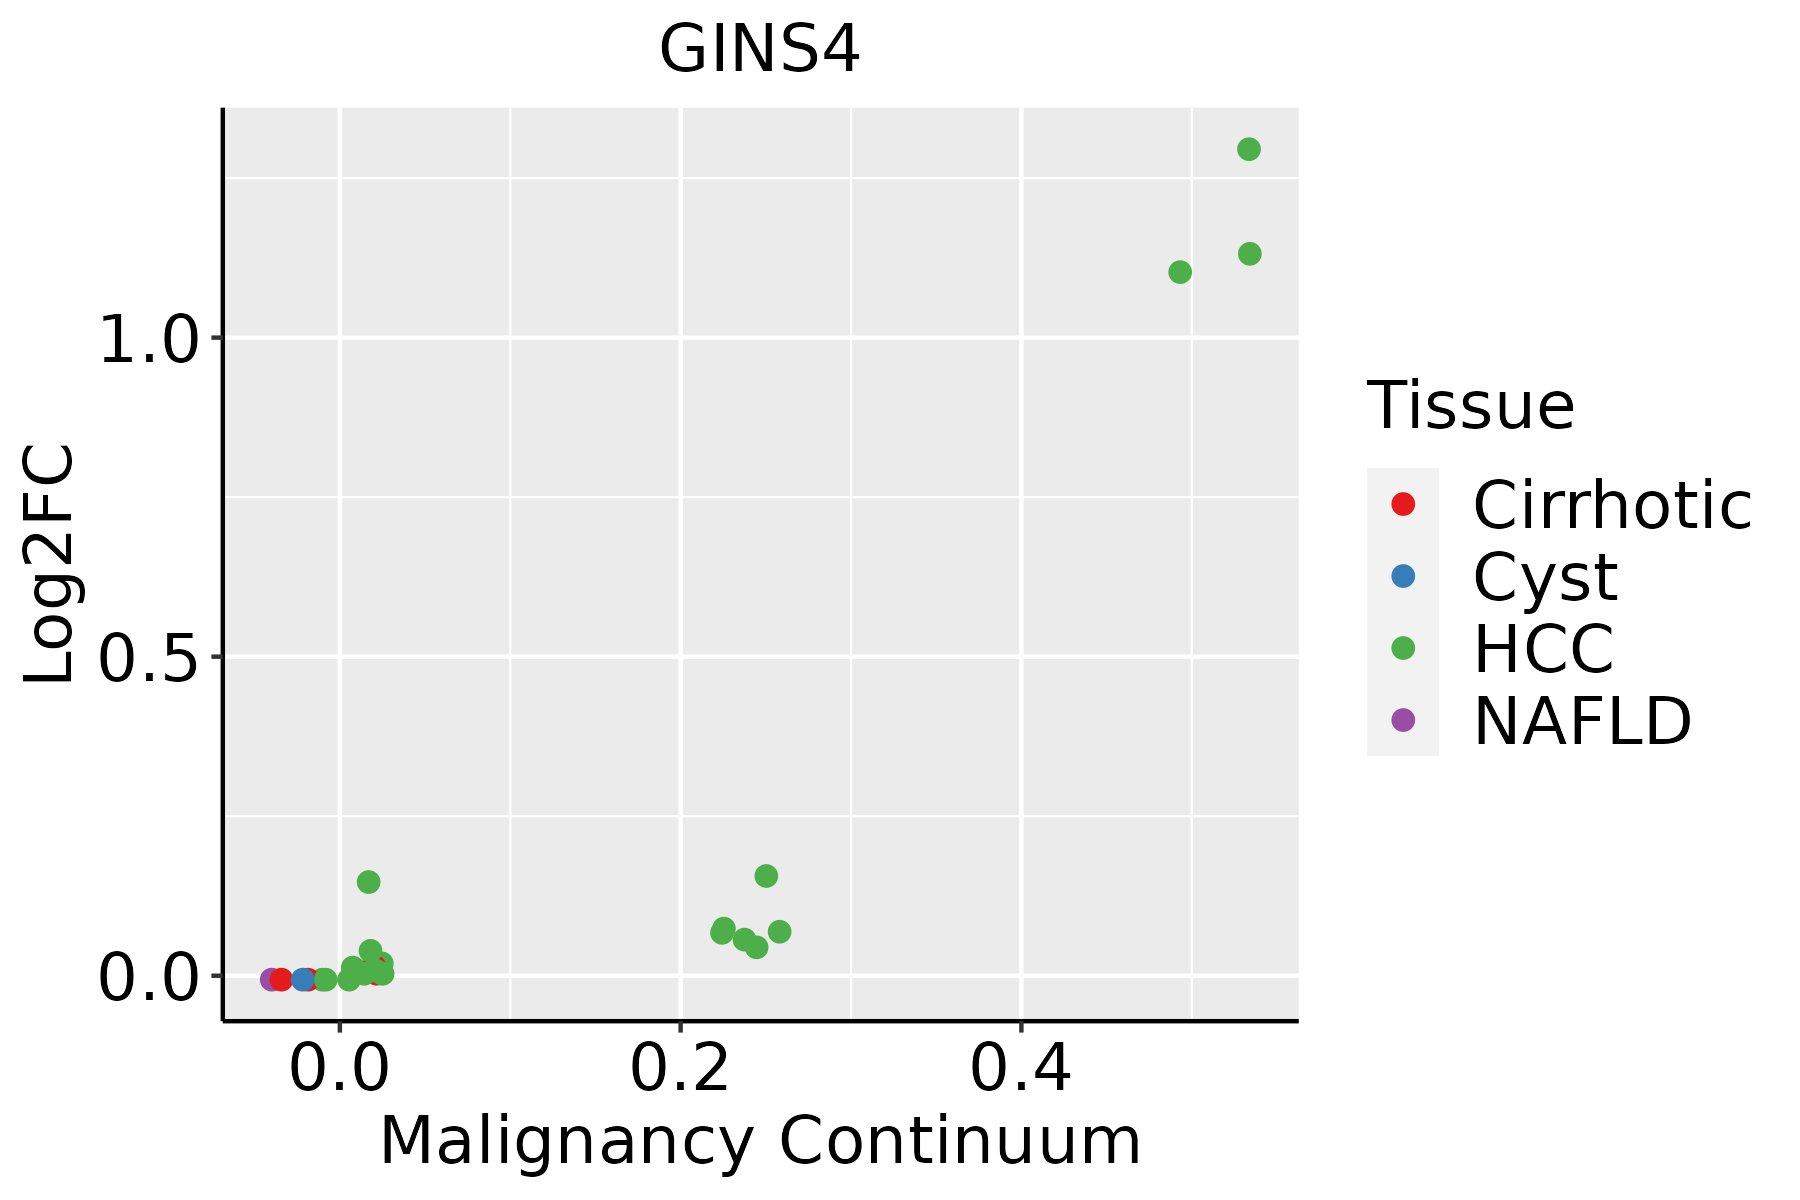 | HCC: Hepatocellular carcinoma |
| NAFLD: Non-alcoholic fatty liver disease |
| ∗log2FC in expression of this searched gene in stem-like cells from each diseased tissue sample relative to stem-like cells in normal samples in each tissue plotted against the malignancy continuum. Samples are colored based on if they are from different disease stage. |
Top |
Malignant transformation related pathway analysis |
| Find out the enriched GO biological processes and KEGG pathways involved in transition from healthy to precancer to cancer |
| Tissue | Disease Stage | Enriched GO biological Processes |
| Colorectum | AD |  |
| Colorectum | SER |  |
| Colorectum | MSS |  |
| Colorectum | MSI-H |  |
| Colorectum | FAP |  |
| ∗Top 15 enriched GO BP terms are showed in the bar plot of each disease state in each tissue. Each row represents a significant GO biological process which is colored according to the -log10(p.adjust). |
| Page: 1 2 3 4 5 6 7 8 9 |
| GO ID | Tissue | Disease Stage | Description | Gene Ratio | Bg Ratio | pvalue | p.adjust | Count |
| GO:000170111 | Liver | HCC | in utero embryonic development | 204/7958 | 367/18723 | 2.44e-07 | 4.30e-06 | 204 |
| GO:00062601 | Liver | HCC | DNA replication | 146/7958 | 260/18723 | 5.68e-06 | 7.02e-05 | 146 |
| GO:00063021 | Liver | HCC | double-strand break repair | 131/7958 | 251/18723 | 1.17e-03 | 6.54e-03 | 131 |
| GO:0006261 | Liver | HCC | DNA-dependent DNA replication | 80/7958 | 151/18723 | 5.91e-03 | 2.44e-02 | 80 |
| Page: 1 |
| Pathway ID | Tissue | Disease Stage | Description | Gene Ratio | Bg Ratio | pvalue | p.adjust | qvalue | Count |
| Page: 1 |
Top |
Cell-cell communication analysis |
| Identification of potential cell-cell interactions between two cell types and their ligand-receptor pairs for different disease states |
| Ligand | Receptor | LRpair | Pathway | Tissue | Disease Stage |
| Page: 1 |
Top |
Single-cell gene regulatory network inference analysis |
| Find out the significant the regulons (TFs) and the target genes of each regulon across cell types for different disease states |
| TF | Cell Type | Tissue | Disease Stage | Target Gene | RSS | Regulon Activity |
| ∗The dot plots of a searched regulon are shown for all cell subpopulations in each disease state of each tissue based on the regulon specific score inferred using pySCENIC and by calculating the average expression. |
| Page: 1 |
Top |
Somatic mutation of malignant transformation related genes |
| Annotation of somatic variants for genes involved in malignant transformation |
| Hugo Symbol | Variant Class | Variant Classification | dbSNP RS | HGVSc | HGVSp | HGVSp Short | SWISSPROT | BIOTYPE | SIFT | PolyPhen | Tumor Sample Barcode | Tissue | Histology | Sex | Age | Stage | Therapy Types | Drugs | Outcome |
| GINS4 | SNV | Missense_Mutation | novel | c.392G>A | p.Arg131Lys | p.R131K | Q9BRT9 | protein_coding | tolerated(1) | benign(0) | TCGA-3C-AALI-01 | Breast | breast invasive carcinoma | Female | <65 | I/II | Unspecific | Poly E | Complete Response |
| GINS4 | SNV | Missense_Mutation | c.325N>A | p.Glu109Lys | p.E109K | Q9BRT9 | protein_coding | tolerated(0.16) | benign(0.34) | TCGA-AR-A0TX-01 | Breast | breast invasive carcinoma | Female | <65 | I/II | Unknown | Unknown | SD | |
| GINS4 | SNV | Missense_Mutation | c.546N>G | p.Ile182Met | p.I182M | Q9BRT9 | protein_coding | deleterious(0) | probably_damaging(0.952) | TCGA-A6-6780-01 | Colorectum | colon adenocarcinoma | Male | >=65 | I/II | Unknown | Unknown | SD | |
| GINS4 | SNV | Missense_Mutation | c.317N>G | p.His106Arg | p.H106R | Q9BRT9 | protein_coding | tolerated(0.05) | probably_damaging(0.988) | TCGA-G4-6302-01 | Colorectum | colon adenocarcinoma | Female | >=65 | I/II | Unknown | Unknown | SD | |
| GINS4 | SNV | Missense_Mutation | rs775844956 | c.404N>T | p.Ala135Val | p.A135V | Q9BRT9 | protein_coding | tolerated(0.11) | benign(0) | TCGA-G4-6627-01 | Colorectum | colon adenocarcinoma | Male | >=65 | I/II | Unknown | Unknown | PD |
| GINS4 | SNV | Missense_Mutation | novel | c.399N>A | p.Phe133Leu | p.F133L | Q9BRT9 | protein_coding | tolerated(0.1) | benign(0.001) | TCGA-AG-3892-01 | Colorectum | rectum adenocarcinoma | Female | <65 | I/II | Unknown | Unknown | SD |
| GINS4 | SNV | Missense_Mutation | rs779030440 | c.286C>T | p.Arg96Cys | p.R96C | Q9BRT9 | protein_coding | deleterious(0) | probably_damaging(1) | TCGA-EI-6917-01 | Colorectum | rectum adenocarcinoma | Male | <65 | III/IV | Chemotherapy | 5fluorouracil+oxaciplatina+l-folinian | SD |
| GINS4 | SNV | Missense_Mutation | rs763825764 | c.479G>A | p.Arg160Gln | p.R160Q | Q9BRT9 | protein_coding | tolerated(0.12) | benign(0.023) | TCGA-A5-A2K3-01 | Endometrium | uterine corpus endometrioid carcinoma | Female | >=65 | I/II | Chemotherapy | carboplatin | SD |
| GINS4 | SNV | Missense_Mutation | c.330N>T | p.Lys110Asn | p.K110N | Q9BRT9 | protein_coding | deleterious(0.01) | possibly_damaging(0.755) | TCGA-AP-A0LM-01 | Endometrium | uterine corpus endometrioid carcinoma | Female | <65 | III/IV | Chemotherapy | cisplatin | SD | |
| GINS4 | SNV | Missense_Mutation | novel | c.491A>G | p.Lys164Arg | p.K164R | Q9BRT9 | protein_coding | tolerated(0.21) | benign(0.006) | TCGA-AP-A1DP-01 | Endometrium | uterine corpus endometrioid carcinoma | Female | >=65 | I/II | Chemotherapy | paclitaxel | PD |
| Page: 1 2 3 |
Top |
Related drugs of malignant transformation related genes |
| Identification of chemicals and drugs interact with genes involved in malignant transfromation |
| (DGIdb 4.0) |
| Entrez ID | Symbol | Category | Interaction Types | Drug Claim Name | Drug Name | PMIDs |
| Page: 1 |

Copyright 2023-Present -The University of Texas Health Science Center at Houston |