
|
|||||
|
 | |
| |
| |
| |
| |
| |
|
Gene: GINS3 |
Gene summary for GINS3 |
| Gene information | Species | Human | Gene symbol | GINS3 | Gene ID | 64785 |
| Gene name | GINS complex subunit 3 | |
| Gene Alias | PSF3 | |
| Cytomap | 16q21 | |
| Gene Type | protein-coding | GO ID | GO:0000278 | UniProtAcc | A0A0S2Z5P2 |
Top |
Malignant transformation analysis |
| Identification of the aberrant gene expression in precancerous and cancerous lesions by comparing the gene expression of stem-like cells in diseased tissues with normal stem cells |
| Entrez ID | Symbol | Replicates | Species | Organ | Tissue | Adj P-value | Log2FC | Malignancy |
| 64785 | GINS3 | LZE24T | Human | Esophagus | ESCC | 1.18e-03 | 1.07e-01 | 0.0596 |
| 64785 | GINS3 | P2T-E | Human | Esophagus | ESCC | 1.45e-05 | 1.85e-01 | 0.1177 |
| 64785 | GINS3 | P4T-E | Human | Esophagus | ESCC | 8.61e-08 | 2.56e-01 | 0.1323 |
| 64785 | GINS3 | P5T-E | Human | Esophagus | ESCC | 9.84e-09 | 2.59e-01 | 0.1327 |
| 64785 | GINS3 | P8T-E | Human | Esophagus | ESCC | 1.36e-04 | 1.46e-01 | 0.0889 |
| 64785 | GINS3 | P9T-E | Human | Esophagus | ESCC | 3.65e-02 | 6.59e-02 | 0.1131 |
| 64785 | GINS3 | P10T-E | Human | Esophagus | ESCC | 7.97e-05 | 1.21e-01 | 0.116 |
| 64785 | GINS3 | P11T-E | Human | Esophagus | ESCC | 6.44e-13 | 5.84e-01 | 0.1426 |
| 64785 | GINS3 | P12T-E | Human | Esophagus | ESCC | 1.04e-10 | 1.98e-01 | 0.1122 |
| 64785 | GINS3 | P15T-E | Human | Esophagus | ESCC | 2.38e-09 | 2.06e-01 | 0.1149 |
| 64785 | GINS3 | P16T-E | Human | Esophagus | ESCC | 2.02e-04 | 1.97e-01 | 0.1153 |
| 64785 | GINS3 | P19T-E | Human | Esophagus | ESCC | 2.46e-07 | 5.10e-01 | 0.1662 |
| 64785 | GINS3 | P20T-E | Human | Esophagus | ESCC | 1.30e-05 | 1.91e-01 | 0.1124 |
| 64785 | GINS3 | P21T-E | Human | Esophagus | ESCC | 4.56e-05 | 1.48e-01 | 0.1617 |
| 64785 | GINS3 | P22T-E | Human | Esophagus | ESCC | 1.72e-02 | 1.01e-01 | 0.1236 |
| 64785 | GINS3 | P24T-E | Human | Esophagus | ESCC | 8.32e-05 | 8.09e-02 | 0.1287 |
| 64785 | GINS3 | P26T-E | Human | Esophagus | ESCC | 4.37e-06 | 1.50e-01 | 0.1276 |
| 64785 | GINS3 | P27T-E | Human | Esophagus | ESCC | 3.60e-07 | 2.14e-01 | 0.1055 |
| 64785 | GINS3 | P28T-E | Human | Esophagus | ESCC | 5.75e-07 | 2.82e-01 | 0.1149 |
| 64785 | GINS3 | P30T-E | Human | Esophagus | ESCC | 3.08e-11 | 4.92e-01 | 0.137 |
| Page: 1 2 3 |
| Tissue | Expression Dynamics | Abbreviation |
| Esophagus | 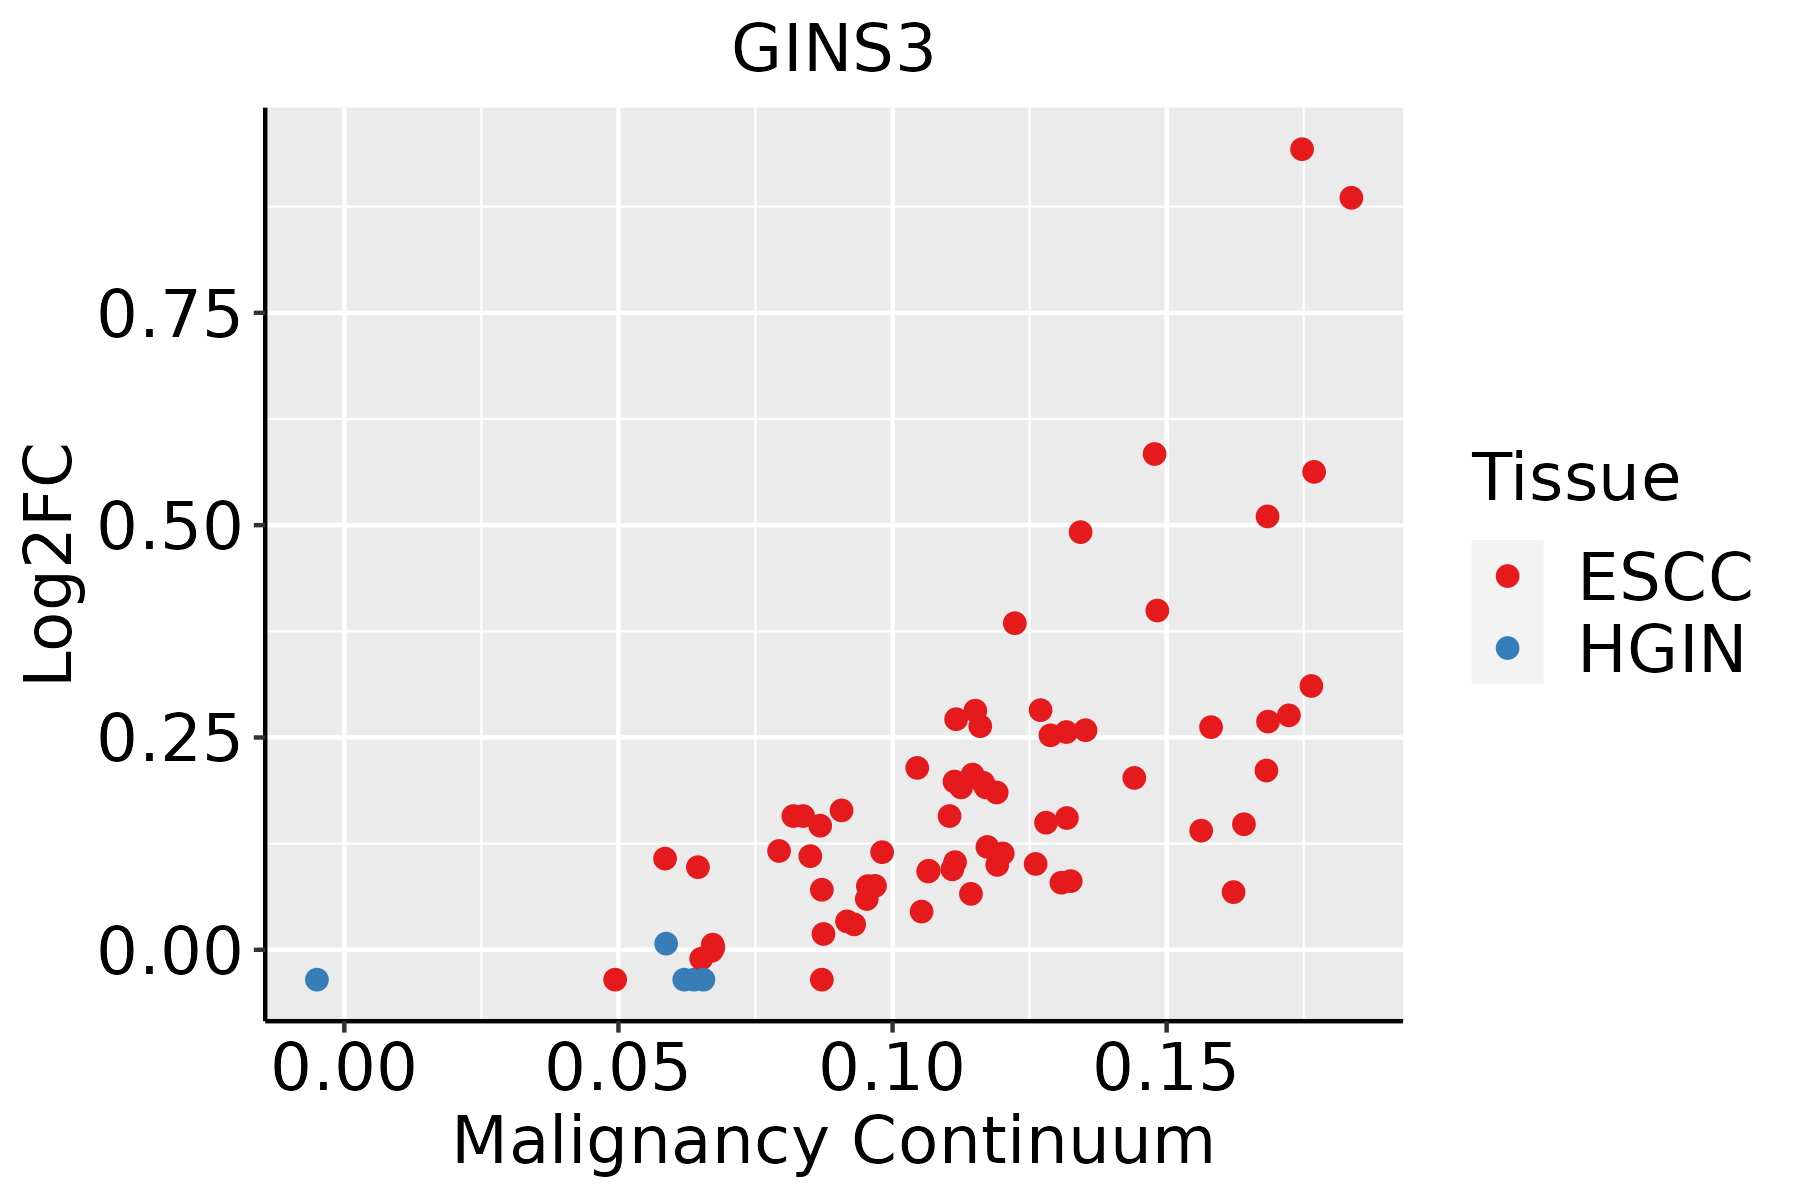 | ESCC: Esophageal squamous cell carcinoma |
| HGIN: High-grade intraepithelial neoplasias | ||
| LGIN: Low-grade intraepithelial neoplasias |
| ∗log2FC in expression of this searched gene in stem-like cells from each diseased tissue sample relative to stem-like cells in normal samples in each tissue plotted against the malignancy continuum. Samples are colored based on if they are from different disease stage. |
Top |
Malignant transformation related pathway analysis |
| Find out the enriched GO biological processes and KEGG pathways involved in transition from healthy to precancer to cancer |
| Tissue | Disease Stage | Enriched GO biological Processes |
| Colorectum | AD |  |
| Colorectum | SER |  |
| Colorectum | MSS |  |
| Colorectum | MSI-H |  |
| Colorectum | FAP |  |
| ∗Top 15 enriched GO BP terms are showed in the bar plot of each disease state in each tissue. Each row represents a significant GO biological process which is colored according to the -log10(p.adjust). |
| Page: 1 2 3 4 5 6 7 8 9 |
| GO ID | Tissue | Disease Stage | Description | Gene Ratio | Bg Ratio | pvalue | p.adjust | Count |
| GO:00062604 | Esophagus | ESCC | DNA replication | 181/8552 | 260/18723 | 3.55e-15 | 2.05e-13 | 181 |
| GO:00062612 | Esophagus | ESCC | DNA-dependent DNA replication | 100/8552 | 151/18723 | 2.61e-07 | 3.94e-06 | 100 |
| GO:00062701 | Esophagus | ESCC | DNA replication initiation | 27/8552 | 34/18723 | 6.01e-05 | 4.62e-04 | 27 |
| GO:1902969 | Esophagus | ESCC | mitotic DNA replication | 11/8552 | 14/18723 | 1.30e-02 | 4.27e-02 | 11 |
| Page: 1 |
| Pathway ID | Tissue | Disease Stage | Description | Gene Ratio | Bg Ratio | pvalue | p.adjust | qvalue | Count |
| Page: 1 |
Top |
Cell-cell communication analysis |
| Identification of potential cell-cell interactions between two cell types and their ligand-receptor pairs for different disease states |
| Ligand | Receptor | LRpair | Pathway | Tissue | Disease Stage |
| Page: 1 |
Top |
Single-cell gene regulatory network inference analysis |
| Find out the significant the regulons (TFs) and the target genes of each regulon across cell types for different disease states |
| TF | Cell Type | Tissue | Disease Stage | Target Gene | RSS | Regulon Activity |
| ∗The dot plots of a searched regulon are shown for all cell subpopulations in each disease state of each tissue based on the regulon specific score inferred using pySCENIC and by calculating the average expression. |
| Page: 1 |
Top |
Somatic mutation of malignant transformation related genes |
| Annotation of somatic variants for genes involved in malignant transformation |
| Hugo Symbol | Variant Class | Variant Classification | dbSNP RS | HGVSc | HGVSp | HGVSp Short | SWISSPROT | BIOTYPE | SIFT | PolyPhen | Tumor Sample Barcode | Tissue | Histology | Sex | Age | Stage | Therapy Types | Drugs | Outcome |
| GINS3 | SNV | Missense_Mutation | novel | c.51G>C | p.Glu17Asp | p.E17D | Q9BRX5 | protein_coding | tolerated(0.22) | probably_damaging(0.984) | TCGA-3C-AALI-01 | Breast | breast invasive carcinoma | Female | <65 | I/II | Unspecific | Poly E | Complete Response |
| GINS3 | SNV | Missense_Mutation | rs760402447 | c.556C>T | p.Arg186Cys | p.R186C | Q9BRX5 | protein_coding | deleterious(0.04) | probably_damaging(0.998) | TCGA-AN-A046-01 | Breast | breast invasive carcinoma | Female | >=65 | I/II | Unknown | Unknown | SD |
| GINS3 | SNV | Missense_Mutation | novel | c.707N>C | p.Ile236Thr | p.I236T | Q9BRX5 | protein_coding | deleterious(0) | benign(0.352) | TCGA-AO-A128-01 | Breast | breast invasive carcinoma | Female | <65 | I/II | Chemotherapy | doxorubicin | SD |
| GINS3 | SNV | Missense_Mutation | rs757683781 | c.692N>T | p.Gly231Val | p.G231V | Q9BRX5 | protein_coding | deleterious(0.03) | probably_damaging(1) | TCGA-AR-A24Z-01 | Breast | breast invasive carcinoma | Female | <65 | I/II | Chemotherapy | doxorubicin | SD |
| GINS3 | SNV | Missense_Mutation | novel | c.122N>G | p.Pro41Arg | p.P41R | Q9BRX5 | protein_coding | tolerated(0.13) | probably_damaging(0.999) | TCGA-E2-A155-01 | Breast | breast invasive carcinoma | Female | <65 | I/II | Chemotherapy | cytoxan | SD |
| GINS3 | SNV | Missense_Mutation | c.149G>A | p.Arg50Gln | p.R50Q | Q9BRX5 | protein_coding | tolerated(0.54) | benign(0.009) | TCGA-DR-A0ZM-01 | Cervix | cervical & endocervical cancer | Female | <65 | III/IV | Unspecific | Cisplatin | SD | |
| GINS3 | SNV | Missense_Mutation | novel | c.529N>G | p.Leu177Val | p.L177V | Q9BRX5 | protein_coding | deleterious(0.04) | benign(0.214) | TCGA-PN-A8MA-01 | Cervix | cervical & endocervical cancer | Female | <65 | I/II | Chemotherapy | cisplatin | SD |
| GINS3 | SNV | Missense_Mutation | novel | c.90N>T | p.Glu30Asp | p.E30D | Q9BRX5 | protein_coding | deleterious(0.02) | probably_damaging(0.984) | TCGA-AA-A010-01 | Colorectum | colon adenocarcinoma | Female | <65 | I/II | Chemotherapy | folinic | CR |
| GINS3 | SNV | Missense_Mutation | c.31N>A | p.Gly11Ser | p.G11S | Q9BRX5 | protein_coding | deleterious_low_confidence(0.01) | probably_damaging(0.999) | TCGA-AY-6197-01 | Colorectum | colon adenocarcinoma | Male | <65 | I/II | Unknown | Unknown | SD | |
| GINS3 | SNV | Missense_Mutation | novel | c.64T>G | p.Leu22Val | p.L22V | Q9BRX5 | protein_coding | deleterious(0.01) | benign(0.355) | TCGA-CA-6717-01 | Colorectum | colon adenocarcinoma | Male | <65 | I/II | Chemotherapy | oxaliplatin | CR |
| Page: 1 2 3 4 |
Top |
Related drugs of malignant transformation related genes |
| Identification of chemicals and drugs interact with genes involved in malignant transfromation |
| (DGIdb 4.0) |
| Entrez ID | Symbol | Category | Interaction Types | Drug Claim Name | Drug Name | PMIDs |
| Page: 1 |

Copyright 2023-Present -The University of Texas Health Science Center at Houston |