
|
|||||
|
 | |
| |
| |
| |
| |
| |
|
Gene: GIGYF1 |
Gene summary for GIGYF1 |
| Gene information | Species | Human | Gene symbol | GIGYF1 | Gene ID | 64599 |
| Gene name | GRB10 interacting GYF protein 1 | |
| Gene Alias | GYF1 | |
| Cytomap | 7q22.1 | |
| Gene Type | protein-coding | GO ID | GO:0007154 | UniProtAcc | NA |
Top |
Malignant transformation analysis |
| Identification of the aberrant gene expression in precancerous and cancerous lesions by comparing the gene expression of stem-like cells in diseased tissues with normal stem cells |
| Entrez ID | Symbol | Replicates | Species | Organ | Tissue | Adj P-value | Log2FC | Malignancy |
| 64599 | GIGYF1 | LZE4T | Human | Esophagus | ESCC | 4.31e-03 | 5.52e-02 | 0.0811 |
| 64599 | GIGYF1 | LZE7T | Human | Esophagus | ESCC | 9.10e-07 | 2.05e-01 | 0.0667 |
| 64599 | GIGYF1 | LZE20T | Human | Esophagus | ESCC | 1.54e-06 | 1.74e-01 | 0.0662 |
| 64599 | GIGYF1 | LZE22T | Human | Esophagus | ESCC | 1.07e-06 | 2.91e-01 | 0.068 |
| 64599 | GIGYF1 | LZE24T | Human | Esophagus | ESCC | 2.25e-12 | 2.08e-01 | 0.0596 |
| 64599 | GIGYF1 | LZE21T | Human | Esophagus | ESCC | 1.46e-02 | 1.62e-01 | 0.0655 |
| 64599 | GIGYF1 | P1T-E | Human | Esophagus | ESCC | 1.72e-11 | 3.71e-01 | 0.0875 |
| 64599 | GIGYF1 | P2T-E | Human | Esophagus | ESCC | 1.07e-27 | 4.00e-01 | 0.1177 |
| 64599 | GIGYF1 | P4T-E | Human | Esophagus | ESCC | 5.97e-03 | 5.72e-02 | 0.1323 |
| 64599 | GIGYF1 | P5T-E | Human | Esophagus | ESCC | 6.39e-03 | 4.25e-02 | 0.1327 |
| 64599 | GIGYF1 | P8T-E | Human | Esophagus | ESCC | 6.64e-18 | 2.41e-01 | 0.0889 |
| 64599 | GIGYF1 | P9T-E | Human | Esophagus | ESCC | 3.54e-08 | 6.36e-02 | 0.1131 |
| 64599 | GIGYF1 | P10T-E | Human | Esophagus | ESCC | 1.02e-07 | 1.52e-01 | 0.116 |
| 64599 | GIGYF1 | P12T-E | Human | Esophagus | ESCC | 1.85e-16 | 1.95e-01 | 0.1122 |
| 64599 | GIGYF1 | P15T-E | Human | Esophagus | ESCC | 9.43e-18 | 2.66e-01 | 0.1149 |
| 64599 | GIGYF1 | P16T-E | Human | Esophagus | ESCC | 2.16e-15 | 2.66e-01 | 0.1153 |
| 64599 | GIGYF1 | P17T-E | Human | Esophagus | ESCC | 1.89e-10 | 2.40e-01 | 0.1278 |
| 64599 | GIGYF1 | P20T-E | Human | Esophagus | ESCC | 5.68e-16 | 2.29e-01 | 0.1124 |
| 64599 | GIGYF1 | P21T-E | Human | Esophagus | ESCC | 1.46e-12 | 1.39e-01 | 0.1617 |
| 64599 | GIGYF1 | P23T-E | Human | Esophagus | ESCC | 8.84e-15 | 2.92e-01 | 0.108 |
| Page: 1 2 3 4 5 |
| Tissue | Expression Dynamics | Abbreviation |
| Esophagus |  | ESCC: Esophageal squamous cell carcinoma |
| HGIN: High-grade intraepithelial neoplasias | ||
| LGIN: Low-grade intraepithelial neoplasias | ||
| Liver | 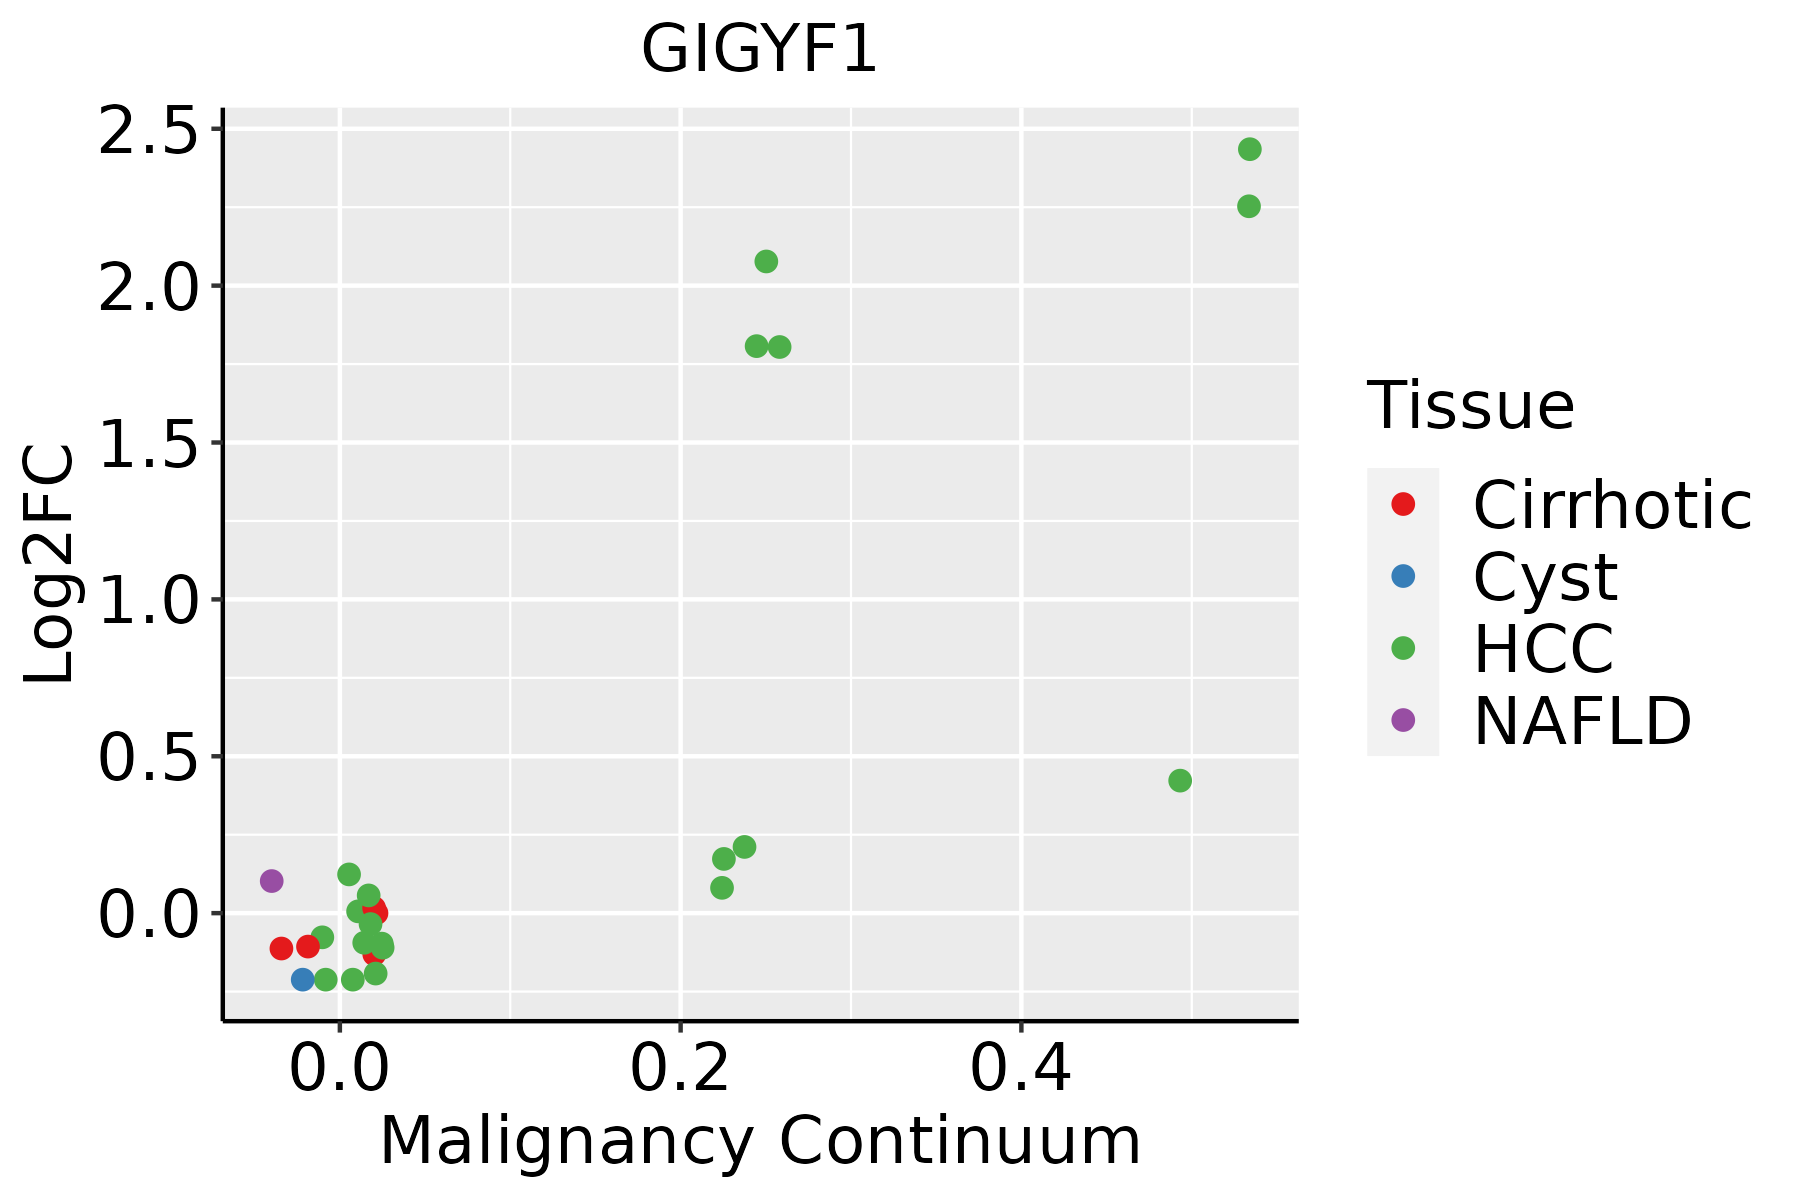 | HCC: Hepatocellular carcinoma |
| NAFLD: Non-alcoholic fatty liver disease | ||
| Thyroid |  | ATC: Anaplastic thyroid cancer |
| HT: Hashimoto's thyroiditis | ||
| PTC: Papillary thyroid cancer |
| ∗log2FC in expression of this searched gene in stem-like cells from each diseased tissue sample relative to stem-like cells in normal samples in each tissue plotted against the malignancy continuum. Samples are colored based on if they are from different disease stage. |
Top |
Malignant transformation related pathway analysis |
| Find out the enriched GO biological processes and KEGG pathways involved in transition from healthy to precancer to cancer |
| Tissue | Disease Stage | Enriched GO biological Processes |
| Colorectum | AD |  |
| Colorectum | SER |  |
| Colorectum | MSS |  |
| Colorectum | MSI-H |  |
| Colorectum | FAP |  |
| ∗Top 15 enriched GO BP terms are showed in the bar plot of each disease state in each tissue. Each row represents a significant GO biological process which is colored according to the -log10(p.adjust). |
| Page: 1 2 3 4 5 6 7 8 9 |
| GO ID | Tissue | Disease Stage | Description | Gene Ratio | Bg Ratio | pvalue | p.adjust | Count |
| GO:00480095 | Thyroid | PTC | insulin-like growth factor receptor signaling pathway | 19/5968 | 37/18723 | 1.07e-02 | 4.29e-02 | 19 |
| GO:004800914 | Thyroid | ATC | insulin-like growth factor receptor signaling pathway | 20/6293 | 37/18723 | 8.24e-03 | 3.16e-02 | 20 |
| Page: 1 |
| Pathway ID | Tissue | Disease Stage | Description | Gene Ratio | Bg Ratio | pvalue | p.adjust | qvalue | Count |
| Page: 1 |
Top |
Cell-cell communication analysis |
| Identification of potential cell-cell interactions between two cell types and their ligand-receptor pairs for different disease states |
| Ligand | Receptor | LRpair | Pathway | Tissue | Disease Stage |
| Page: 1 |
Top |
Single-cell gene regulatory network inference analysis |
| Find out the significant the regulons (TFs) and the target genes of each regulon across cell types for different disease states |
| TF | Cell Type | Tissue | Disease Stage | Target Gene | RSS | Regulon Activity |
| ∗The dot plots of a searched regulon are shown for all cell subpopulations in each disease state of each tissue based on the regulon specific score inferred using pySCENIC and by calculating the average expression. |
| Page: 1 |
Top |
Somatic mutation of malignant transformation related genes |
| Annotation of somatic variants for genes involved in malignant transformation |
| Hugo Symbol | Variant Class | Variant Classification | dbSNP RS | HGVSc | HGVSp | HGVSp Short | SWISSPROT | BIOTYPE | SIFT | PolyPhen | Tumor Sample Barcode | Tissue | Histology | Sex | Age | Stage | Therapy Types | Drugs | Outcome |
| GIGYF1 | SNV | Missense_Mutation | c.2653N>A | p.Glu885Lys | p.E885K | O75420 | protein_coding | deleterious(0) | probably_damaging(0.985) | TCGA-A8-A07B-01 | Breast | breast invasive carcinoma | Female | >=65 | I/II | Unknown | Unknown | SD | |
| GIGYF1 | SNV | Missense_Mutation | rs760618499 | c.667N>A | p.Gly223Ser | p.G223S | O75420 | protein_coding | tolerated(0.29) | benign(0.027) | TCGA-AC-A62X-01 | Breast | breast invasive carcinoma | Female | >=65 | I/II | Unknown | Unknown | SD |
| GIGYF1 | SNV | Missense_Mutation | c.839N>A | p.Ala280Glu | p.A280E | O75420 | protein_coding | deleterious(0.02) | benign(0.062) | TCGA-AN-A04A-01 | Breast | breast invasive carcinoma | Female | <65 | III/IV | Unknown | Unknown | SD | |
| GIGYF1 | SNV | Missense_Mutation | rs780767946 | c.1376G>A | p.Arg459His | p.R459H | O75420 | protein_coding | deleterious(0.02) | possibly_damaging(0.853) | TCGA-D8-A1J8-01 | Breast | breast invasive carcinoma | Female | >=65 | I/II | Hormone Therapy | nolvadex | SD |
| GIGYF1 | SNV | Missense_Mutation | c.814A>G | p.Ser272Gly | p.S272G | O75420 | protein_coding | tolerated(0.42) | benign(0) | TCGA-D8-A1XK-01 | Breast | breast invasive carcinoma | Female | <65 | I/II | Chemotherapy | doxorubicine+cyclophosphamide | SD | |
| GIGYF1 | SNV | Missense_Mutation | c.683N>T | p.Ser228Phe | p.S228F | O75420 | protein_coding | tolerated(0.73) | benign(0.071) | TCGA-EW-A1OY-01 | Breast | breast invasive carcinoma | Female | <65 | I/II | Chemotherapy | doxorubicin | SD | |
| GIGYF1 | deletion | In_Frame_Del | novel | c.663_680delAGACGGCGACCGCTGGCG | p.Asp222_Arg227del | p.D222_R227del | O75420 | protein_coding | TCGA-B6-A409-01 | Breast | breast invasive carcinoma | Female | <65 | III/IV | Chemotherapy | cyclophosphamide | PD | ||
| GIGYF1 | insertion | Frame_Shift_Ins | novel | c.2723_2744dupAGATGCTGCACACGCTGAGCGC | p.Thr916AspfsTer28 | p.T916Dfs*28 | O75420 | protein_coding | TCGA-EW-A1P8-01 | Breast | breast invasive carcinoma | Female | <65 | III/IV | Chemotherapy | fluorouracil | PD | ||
| GIGYF1 | SNV | Missense_Mutation | rs776762700 | c.596G>A | p.Arg199His | p.R199H | O75420 | protein_coding | deleterious(0) | probably_damaging(0.991) | TCGA-2W-A8YY-01 | Cervix | cervical & endocervical cancer | Female | <65 | I/II | Chemotherapy | cisplatin | CR |
| GIGYF1 | SNV | Missense_Mutation | c.415G>A | p.Glu139Lys | p.E139K | O75420 | protein_coding | deleterious(0.01) | possibly_damaging(0.622) | TCGA-C5-A1MK-01 | Cervix | cervical & endocervical cancer | Female | >=65 | III/IV | Chemotherapy | carboplatin | PD |
| Page: 1 2 3 4 5 6 7 8 9 10 11 12 |
Top |
Related drugs of malignant transformation related genes |
| Identification of chemicals and drugs interact with genes involved in malignant transfromation |
| (DGIdb 4.0) |
| Entrez ID | Symbol | Category | Interaction Types | Drug Claim Name | Drug Name | PMIDs |
| Page: 1 |

Copyright 2023-Present -The University of Texas Health Science Center at Houston |