
|
|||||
|
 | |
| |
| |
| |
| |
| |
|
Gene: GID8 |
Gene summary for GID8 |
| Gene information | Species | Human | Gene symbol | GID8 | Gene ID | 54994 |
| Gene name | GID complex subunit 8 homolog | |
| Gene Alias | C20orf11 | |
| Cytomap | 20q13.33 | |
| Gene Type | protein-coding | GO ID | GO:0006508 | UniProtAcc | Q9NWU2 |
Top |
Malignant transformation analysis |
| Identification of the aberrant gene expression in precancerous and cancerous lesions by comparing the gene expression of stem-like cells in diseased tissues with normal stem cells |
| Entrez ID | Symbol | Replicates | Species | Organ | Tissue | Adj P-value | Log2FC | Malignancy |
| 54994 | GID8 | GSM4909285 | Human | Breast | IDC | 6.43e-03 | 2.39e-01 | 0.21 |
| 54994 | GID8 | GSM4909296 | Human | Breast | IDC | 4.95e-02 | -2.20e-02 | 0.1524 |
| 54994 | GID8 | GSM4909297 | Human | Breast | IDC | 2.95e-04 | 1.03e-01 | 0.1517 |
| 54994 | GID8 | GSM4909298 | Human | Breast | IDC | 5.55e-07 | 2.97e-01 | 0.1551 |
| 54994 | GID8 | GSM4909304 | Human | Breast | IDC | 5.03e-11 | 4.11e-01 | 0.1636 |
| 54994 | GID8 | GSM4909308 | Human | Breast | IDC | 5.79e-03 | 2.41e-01 | 0.158 |
| 54994 | GID8 | GSM4909311 | Human | Breast | IDC | 1.50e-12 | 2.31e-02 | 0.1534 |
| 54994 | GID8 | GSM4909312 | Human | Breast | IDC | 7.24e-13 | 3.64e-01 | 0.1552 |
| 54994 | GID8 | GSM4909317 | Human | Breast | IDC | 7.32e-25 | 6.27e-01 | 0.1355 |
| 54994 | GID8 | GSM4909318 | Human | Breast | IDC | 6.34e-11 | 9.10e-01 | 0.2031 |
| 54994 | GID8 | GSM4909319 | Human | Breast | IDC | 5.17e-18 | -1.08e-02 | 0.1563 |
| 54994 | GID8 | GSM4909321 | Human | Breast | IDC | 1.48e-09 | 1.90e-01 | 0.1559 |
| 54994 | GID8 | M2 | Human | Breast | IDC | 1.66e-06 | 5.91e-01 | 0.21 |
| 54994 | GID8 | NCCBC5 | Human | Breast | DCIS | 8.63e-03 | 8.24e-02 | 0.2046 |
| 54994 | GID8 | P1 | Human | Breast | IDC | 1.58e-03 | -5.46e-02 | 0.1527 |
| 54994 | GID8 | DCIS2 | Human | Breast | DCIS | 1.66e-41 | 9.10e-02 | 0.0085 |
| 54994 | GID8 | HTA11_2487_2000001011 | Human | Colorectum | SER | 4.91e-03 | 2.92e-01 | -0.1808 |
| 54994 | GID8 | HTA11_1938_2000001011 | Human | Colorectum | AD | 2.78e-02 | 3.35e-01 | -0.0811 |
| 54994 | GID8 | HTA11_347_2000001011 | Human | Colorectum | AD | 9.36e-10 | 3.75e-01 | -0.1954 |
| 54994 | GID8 | HTA11_411_2000001011 | Human | Colorectum | SER | 1.81e-04 | 7.53e-01 | -0.2602 |
| Page: 1 2 3 4 5 6 7 8 |
| Tissue | Expression Dynamics | Abbreviation |
| Breast |  | IDC: Invasive ductal carcinoma |
| DCIS: Ductal carcinoma in situ | ||
| Precancer(BRCA1-mut): Precancerous lesion from BRCA1 mutation carriers | ||
| Colorectum (GSE201348) |  | FAP: Familial adenomatous polyposis |
| CRC: Colorectal cancer | ||
| Colorectum (HTA11) |  | AD: Adenomas |
| SER: Sessile serrated lesions | ||
| MSI-H: Microsatellite-high colorectal cancer | ||
| MSS: Microsatellite stable colorectal cancer | ||
| Esophagus | 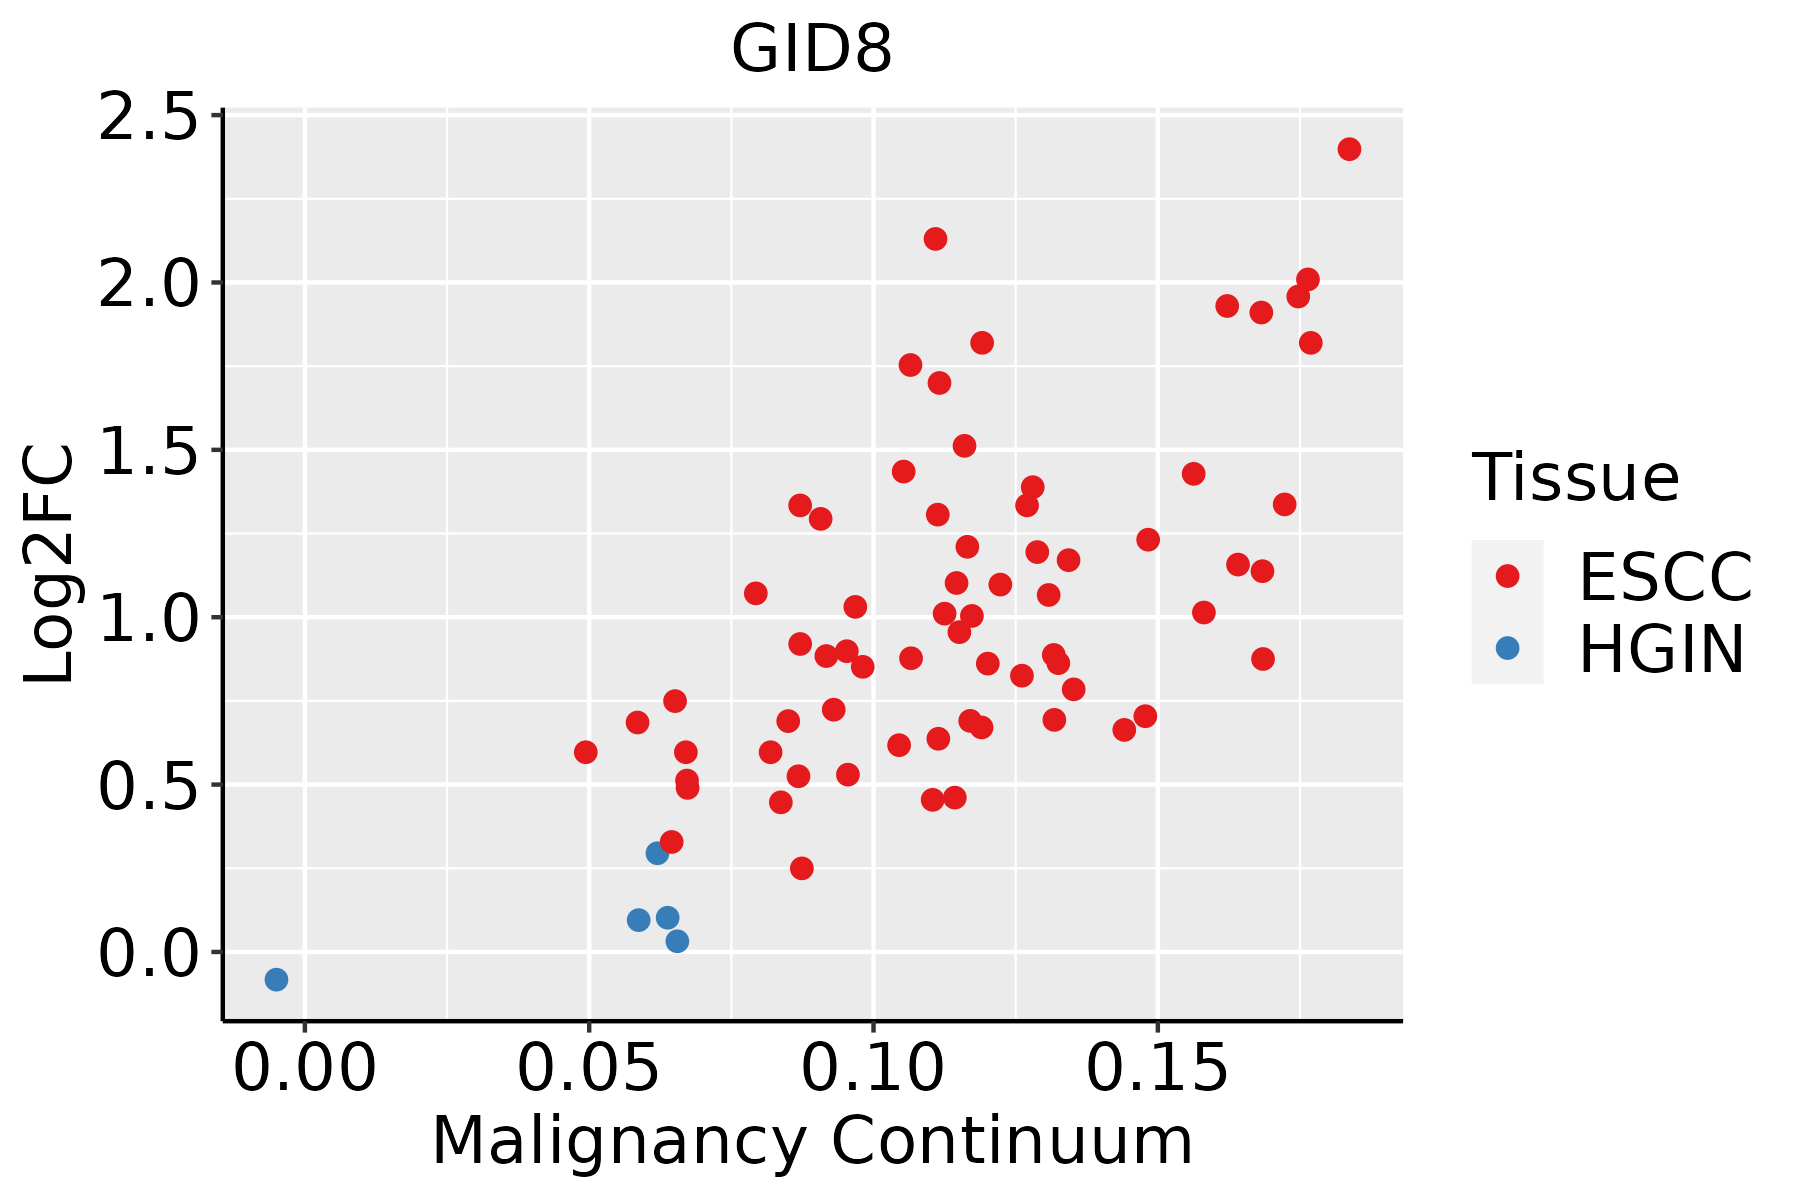 | ESCC: Esophageal squamous cell carcinoma |
| HGIN: High-grade intraepithelial neoplasias | ||
| LGIN: Low-grade intraepithelial neoplasias | ||
| Liver | 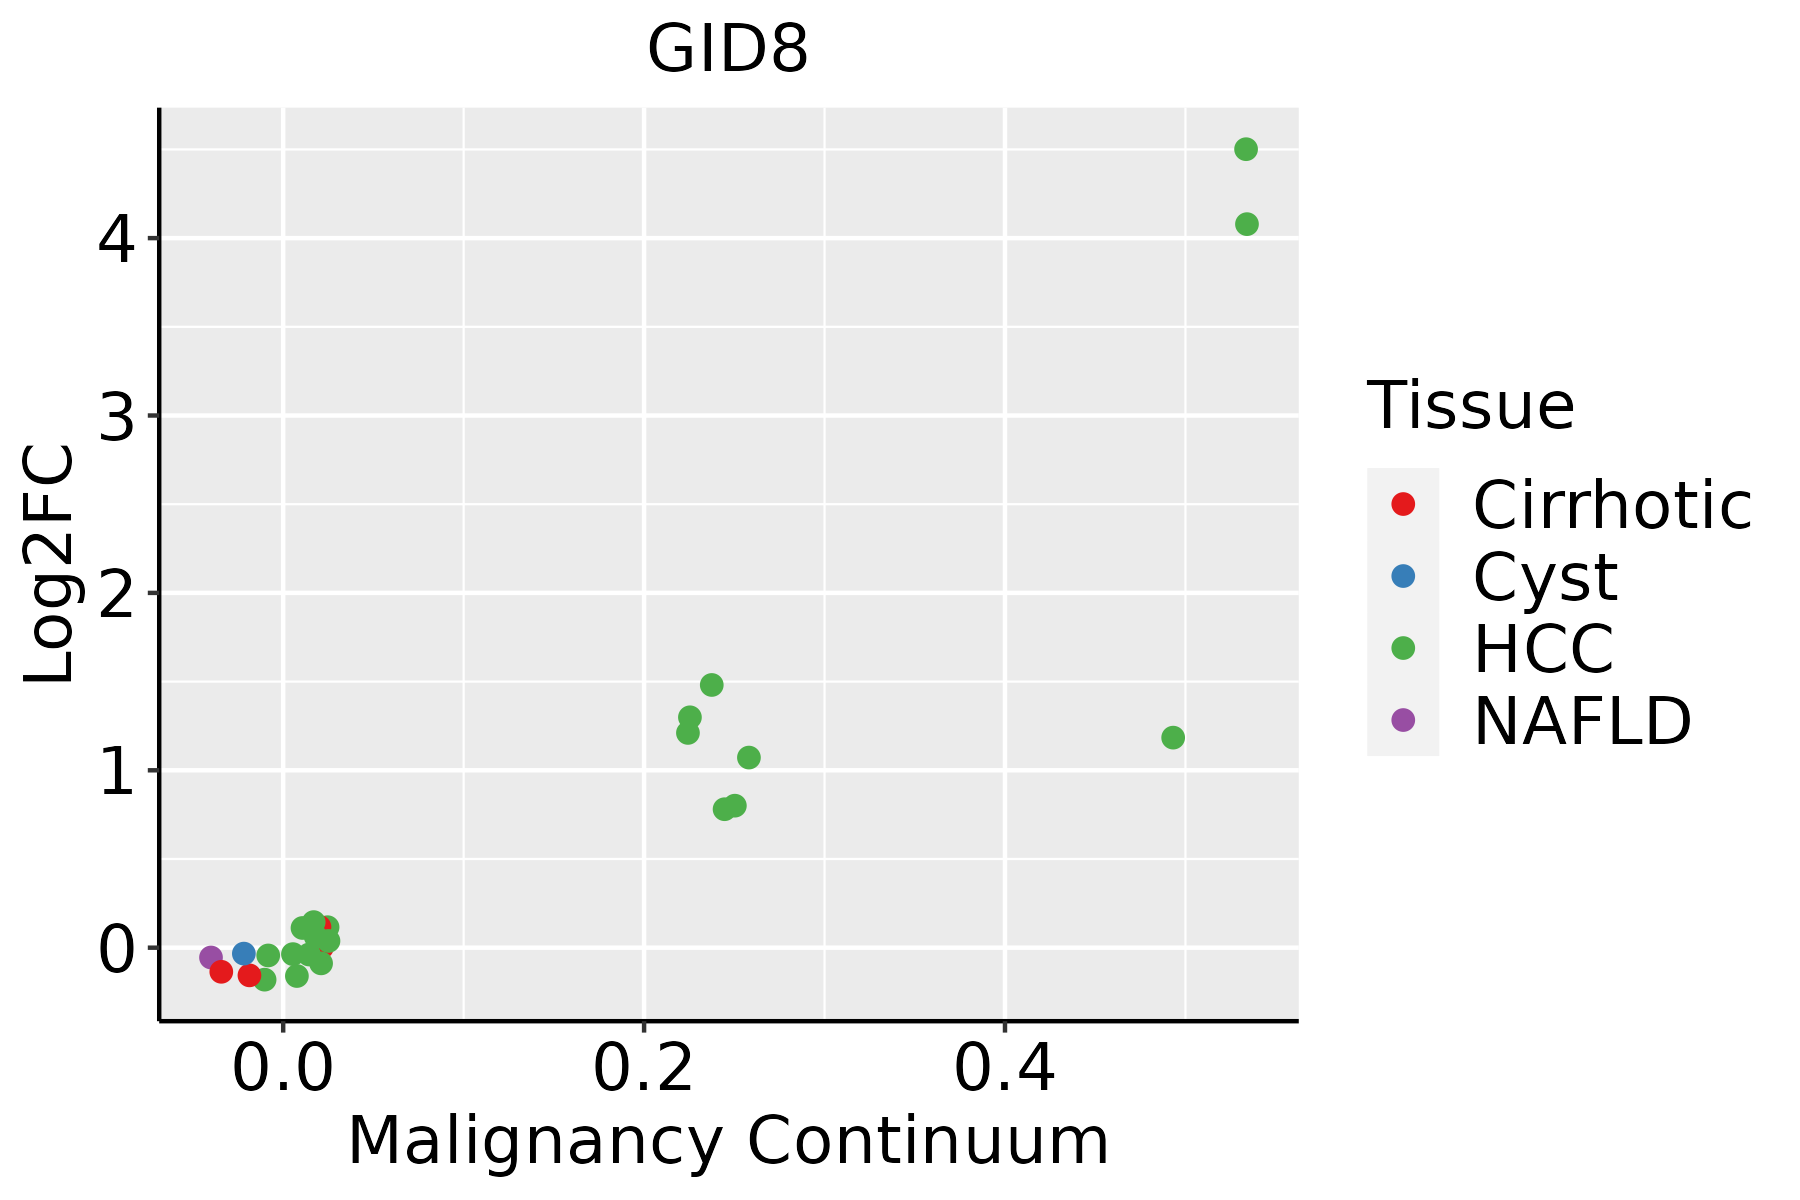 | HCC: Hepatocellular carcinoma |
| NAFLD: Non-alcoholic fatty liver disease | ||
| Oral Cavity |  | EOLP: Erosive Oral lichen planus |
| LP: leukoplakia | ||
| NEOLP: Non-erosive oral lichen planus | ||
| OSCC: Oral squamous cell carcinoma | ||
| Skin | 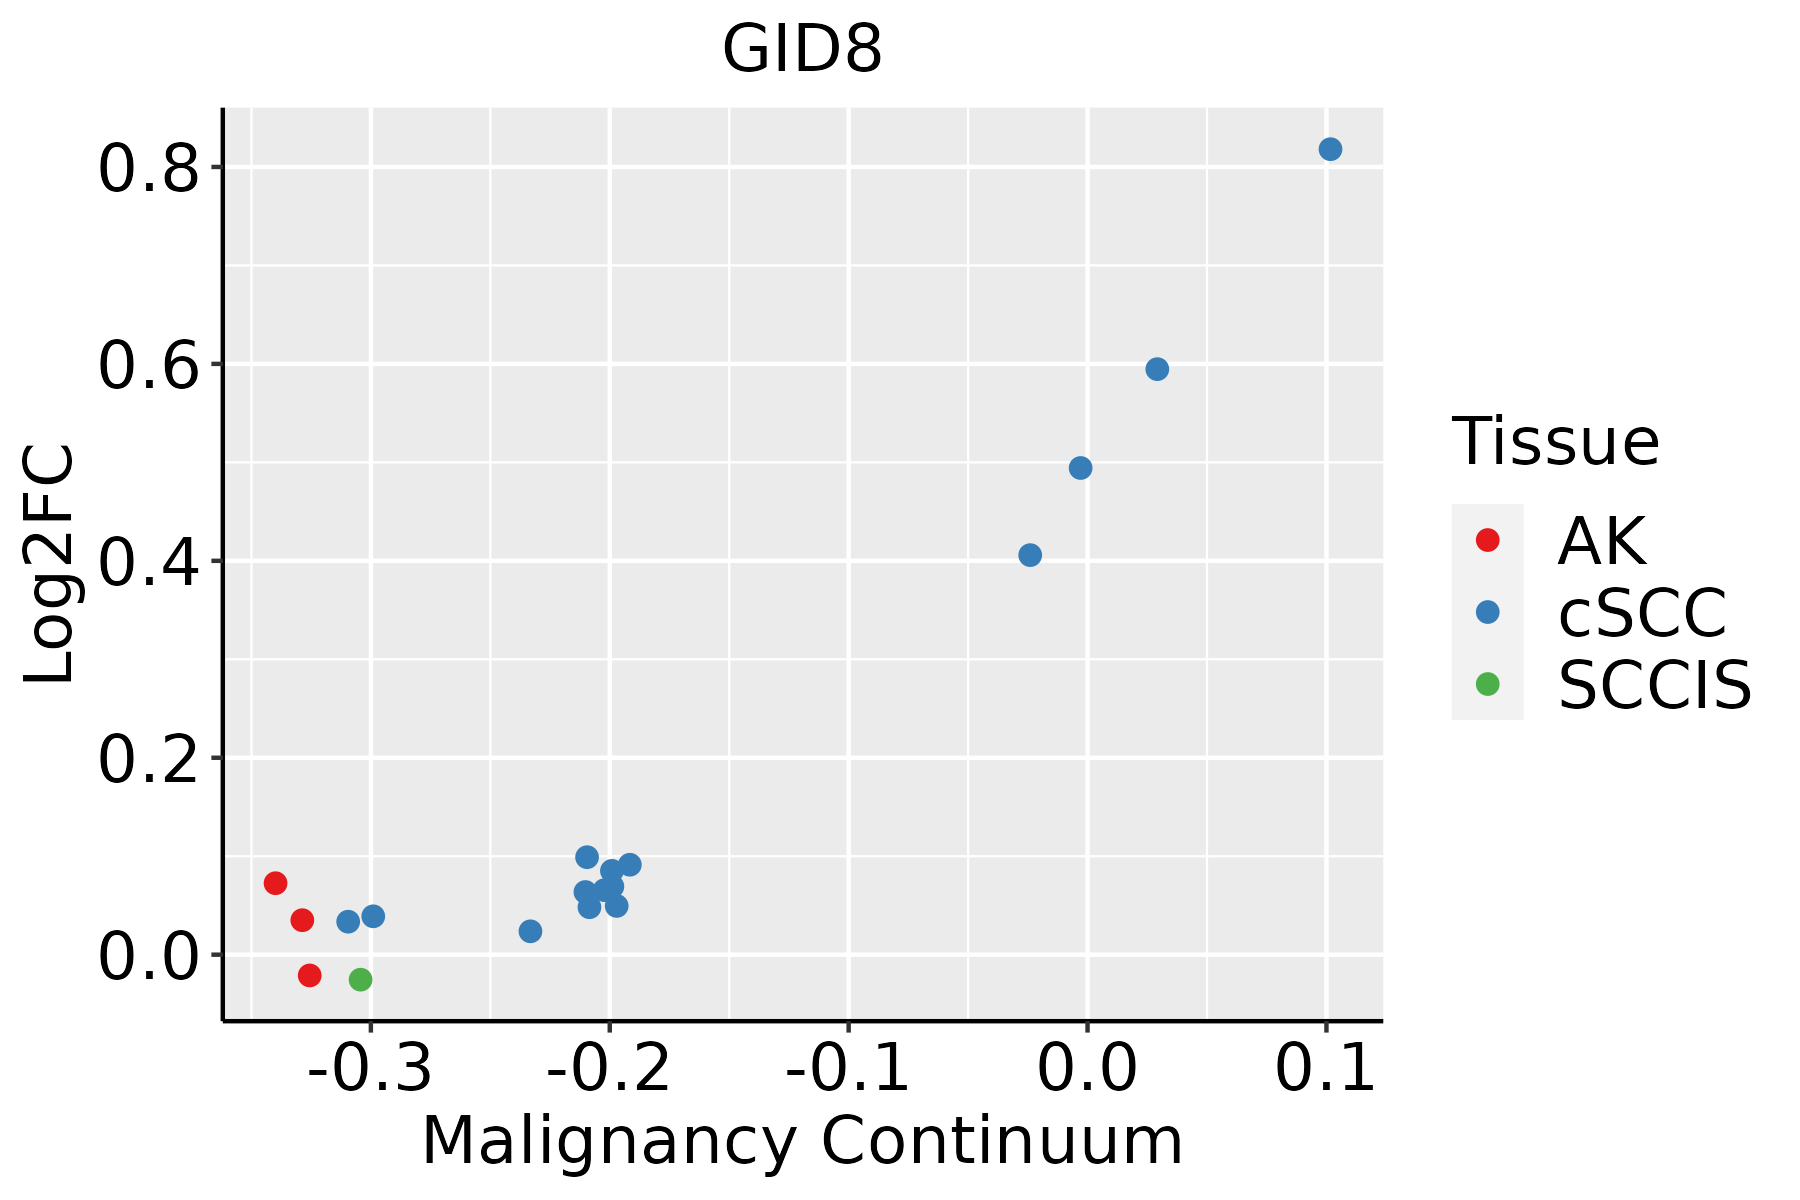 | AK: Actinic keratosis |
| cSCC: Cutaneous squamous cell carcinoma | ||
| SCCIS:squamous cell carcinoma in situ | ||
| Thyroid | 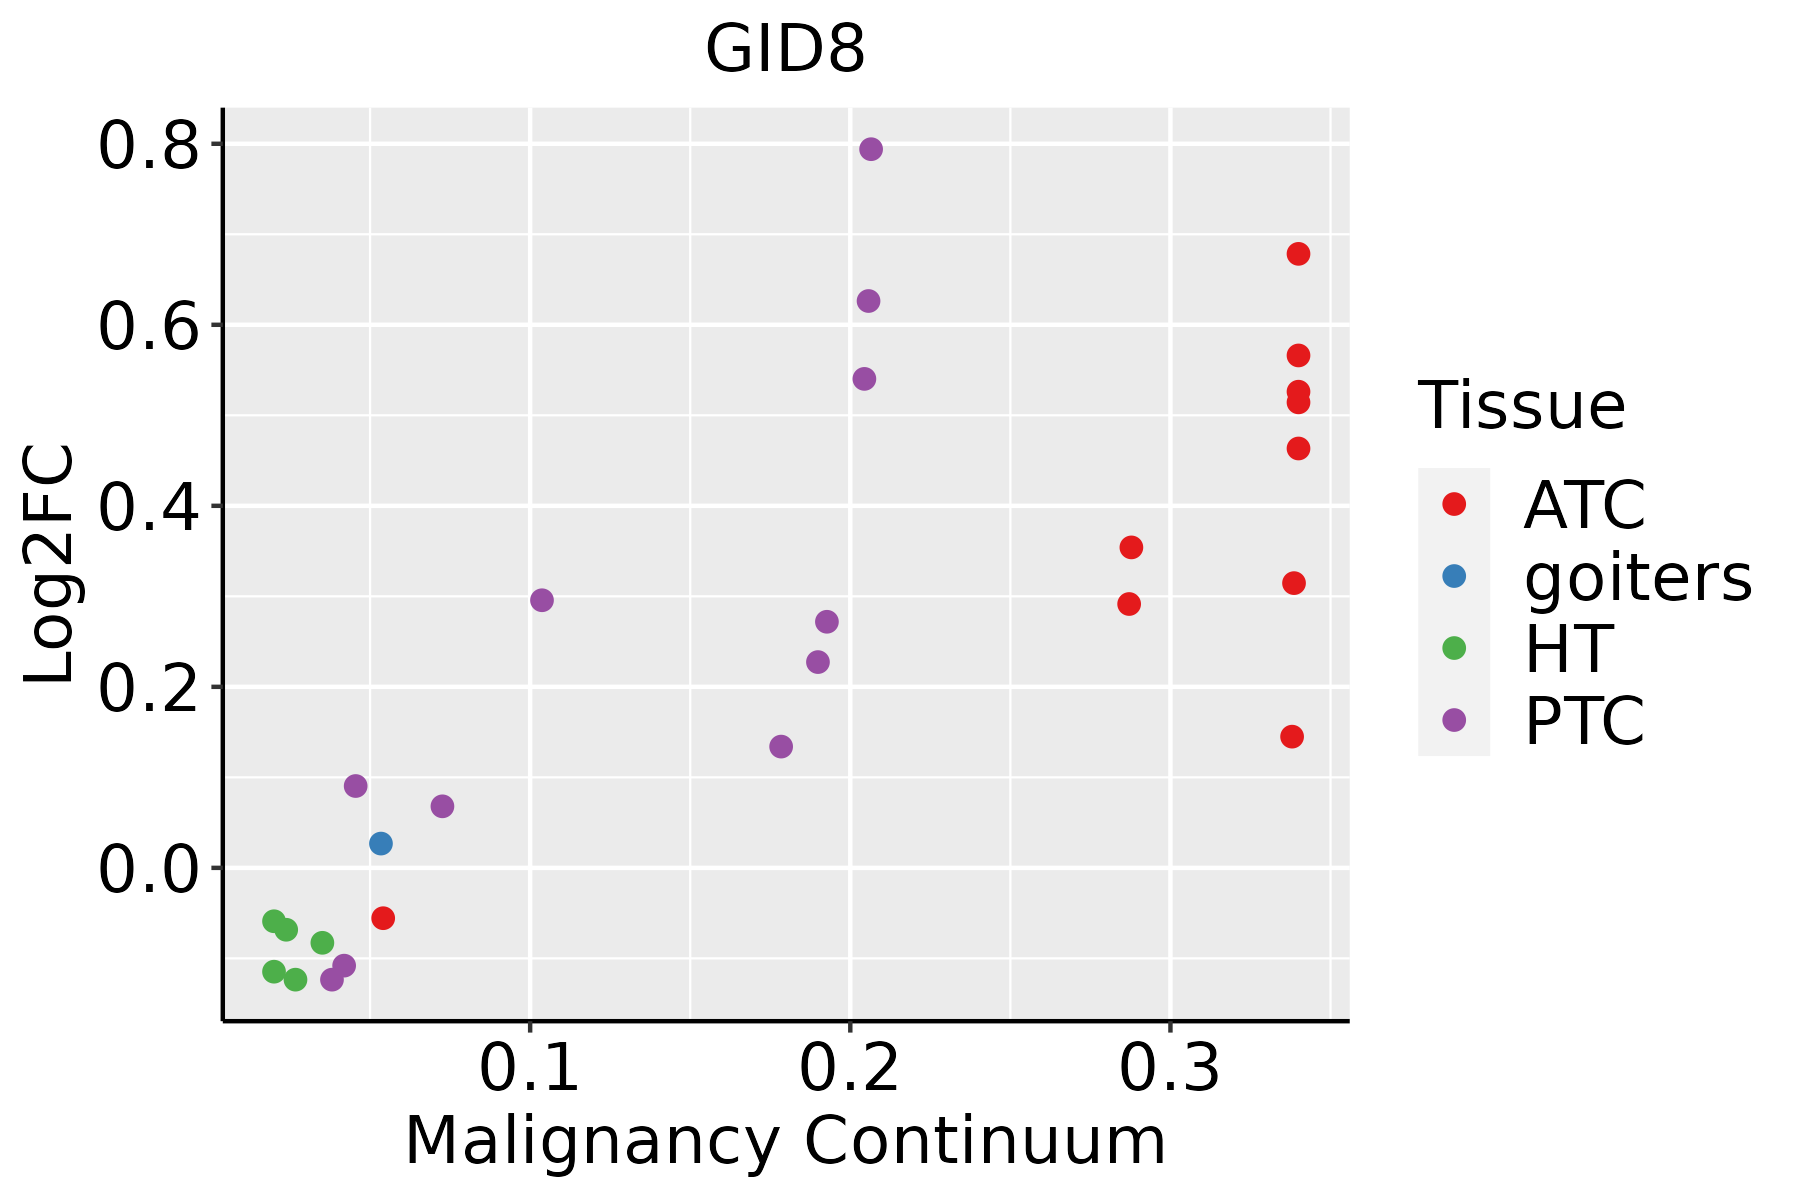 | ATC: Anaplastic thyroid cancer |
| HT: Hashimoto's thyroiditis | ||
| PTC: Papillary thyroid cancer |
| ∗log2FC in expression of this searched gene in stem-like cells from each diseased tissue sample relative to stem-like cells in normal samples in each tissue plotted against the malignancy continuum. Samples are colored based on if they are from different disease stage. |
Top |
Malignant transformation related pathway analysis |
| Find out the enriched GO biological processes and KEGG pathways involved in transition from healthy to precancer to cancer |
| Tissue | Disease Stage | Enriched GO biological Processes |
| Colorectum | AD |  |
| Colorectum | SER |  |
| Colorectum | MSS |  |
| Colorectum | MSI-H |  |
| Colorectum | FAP |  |
| ∗Top 15 enriched GO BP terms are showed in the bar plot of each disease state in each tissue. Each row represents a significant GO biological process which is colored according to the -log10(p.adjust). |
| Page: 1 2 3 4 5 6 7 8 9 |
| GO ID | Tissue | Disease Stage | Description | Gene Ratio | Bg Ratio | pvalue | p.adjust | Count |
| GO:001049814 | Breast | IDC | proteasomal protein catabolic process | 75/1434 | 490/18723 | 5.59e-09 | 4.41e-07 | 75 |
| GO:004316114 | Breast | IDC | proteasome-mediated ubiquitin-dependent protein catabolic process | 57/1434 | 412/18723 | 9.55e-06 | 2.68e-04 | 57 |
| GO:001049824 | Breast | DCIS | proteasomal protein catabolic process | 75/1390 | 490/18723 | 1.44e-09 | 1.40e-07 | 75 |
| GO:004316124 | Breast | DCIS | proteasome-mediated ubiquitin-dependent protein catabolic process | 57/1390 | 412/18723 | 3.76e-06 | 1.16e-04 | 57 |
| GO:0010498 | Colorectum | AD | proteasomal protein catabolic process | 174/3918 | 490/18723 | 3.18e-14 | 7.66e-12 | 174 |
| GO:0043161 | Colorectum | AD | proteasome-mediated ubiquitin-dependent protein catabolic process | 141/3918 | 412/18723 | 1.77e-10 | 1.68e-08 | 141 |
| GO:0030111 | Colorectum | AD | regulation of Wnt signaling pathway | 102/3918 | 328/18723 | 8.51e-06 | 2.03e-04 | 102 |
| GO:0016055 | Colorectum | AD | Wnt signaling pathway | 130/3918 | 444/18723 | 1.60e-05 | 3.37e-04 | 130 |
| GO:0198738 | Colorectum | AD | cell-cell signaling by wnt | 130/3918 | 446/18723 | 2.02e-05 | 4.10e-04 | 130 |
| GO:0060070 | Colorectum | AD | canonical Wnt signaling pathway | 90/3918 | 303/18723 | 1.76e-04 | 2.38e-03 | 90 |
| GO:0060828 | Colorectum | AD | regulation of canonical Wnt signaling pathway | 77/3918 | 253/18723 | 2.19e-04 | 2.87e-03 | 77 |
| GO:0030177 | Colorectum | AD | positive regulation of Wnt signaling pathway | 45/3918 | 140/18723 | 1.23e-03 | 1.09e-02 | 45 |
| GO:00104981 | Colorectum | SER | proteasomal protein catabolic process | 132/2897 | 490/18723 | 3.08e-11 | 5.55e-09 | 132 |
| GO:00431611 | Colorectum | SER | proteasome-mediated ubiquitin-dependent protein catabolic process | 105/2897 | 412/18723 | 7.48e-08 | 4.70e-06 | 105 |
| GO:00160551 | Colorectum | SER | Wnt signaling pathway | 97/2897 | 444/18723 | 2.02e-04 | 3.68e-03 | 97 |
| GO:01987381 | Colorectum | SER | cell-cell signaling by wnt | 97/2897 | 446/18723 | 2.39e-04 | 4.11e-03 | 97 |
| GO:00301111 | Colorectum | SER | regulation of Wnt signaling pathway | 75/2897 | 328/18723 | 2.47e-04 | 4.20e-03 | 75 |
| GO:00600701 | Colorectum | SER | canonical Wnt signaling pathway | 66/2897 | 303/18723 | 2.10e-03 | 2.06e-02 | 66 |
| GO:00608281 | Colorectum | SER | regulation of canonical Wnt signaling pathway | 56/2897 | 253/18723 | 3.03e-03 | 2.67e-02 | 56 |
| GO:0090263 | Colorectum | SER | positive regulation of canonical Wnt signaling pathway | 27/2897 | 106/18723 | 5.12e-03 | 3.92e-02 | 27 |
| Page: 1 2 3 4 5 6 |
| Pathway ID | Tissue | Disease Stage | Description | Gene Ratio | Bg Ratio | pvalue | p.adjust | qvalue | Count |
| Page: 1 |
Top |
Cell-cell communication analysis |
| Identification of potential cell-cell interactions between two cell types and their ligand-receptor pairs for different disease states |
| Ligand | Receptor | LRpair | Pathway | Tissue | Disease Stage |
| Page: 1 |
Top |
Single-cell gene regulatory network inference analysis |
| Find out the significant the regulons (TFs) and the target genes of each regulon across cell types for different disease states |
| TF | Cell Type | Tissue | Disease Stage | Target Gene | RSS | Regulon Activity |
| ∗The dot plots of a searched regulon are shown for all cell subpopulations in each disease state of each tissue based on the regulon specific score inferred using pySCENIC and by calculating the average expression. |
| Page: 1 |
Top |
Somatic mutation of malignant transformation related genes |
| Annotation of somatic variants for genes involved in malignant transformation |
| Hugo Symbol | Variant Class | Variant Classification | dbSNP RS | HGVSc | HGVSp | HGVSp Short | SWISSPROT | BIOTYPE | SIFT | PolyPhen | Tumor Sample Barcode | Tissue | Histology | Sex | Age | Stage | Therapy Types | Drugs | Outcome |
| GID8 | SNV | Missense_Mutation | novel | c.292N>T | p.Arg98Trp | p.R98W | Q9NWU2 | protein_coding | deleterious(0.01) | benign(0.15) | TCGA-2W-A8YY-01 | Cervix | cervical & endocervical cancer | Female | <65 | I/II | Chemotherapy | cisplatin | CR |
| GID8 | SNV | Missense_Mutation | c.255N>C | p.Leu85Phe | p.L85F | Q9NWU2 | protein_coding | deleterious(0.03) | probably_damaging(0.973) | TCGA-C5-A1BN-01 | Cervix | cervical & endocervical cancer | Female | <65 | I/II | Chemotherapy | cisplatin | PD | |
| GID8 | SNV | Missense_Mutation | novel | c.116N>G | p.Thr39Arg | p.T39R | Q9NWU2 | protein_coding | deleterious(0.04) | benign(0.247) | TCGA-VS-A94X-01 | Cervix | cervical & endocervical cancer | Female | <65 | I/II | Chemotherapy | cisplatin | PD |
| GID8 | SNV | Missense_Mutation | c.577N>A | p.Ala193Thr | p.A193T | Q9NWU2 | protein_coding | tolerated(0.46) | benign(0.105) | TCGA-D5-6928-01 | Colorectum | colon adenocarcinoma | Male | >=65 | I/II | Unknown | Unknown | SD | |
| GID8 | SNV | Missense_Mutation | novel | c.92G>A | p.Arg31His | p.R31H | Q9NWU2 | protein_coding | deleterious(0.01) | probably_damaging(0.975) | TCGA-AG-A00Y-01 | Colorectum | rectum adenocarcinoma | Male | >=65 | I/II | Unknown | Unknown | PD |
| GID8 | SNV | Missense_Mutation | novel | c.102G>T | p.Met34Ile | p.M34I | Q9NWU2 | protein_coding | deleterious(0) | possibly_damaging(0.863) | TCGA-F5-6814-01 | Colorectum | rectum adenocarcinoma | Male | <65 | I/II | Unknown | Unknown | SD |
| GID8 | SNV | Missense_Mutation | rs753441426 | c.466N>A | p.Glu156Lys | p.E156K | Q9NWU2 | protein_coding | tolerated(0.84) | benign(0.158) | TCGA-A5-A0G2-01 | Endometrium | uterine corpus endometrioid carcinoma | Female | <65 | III/IV | Unknown | Unknown | SD |
| GID8 | SNV | Missense_Mutation | rs762677628 | c.557G>A | p.Arg186His | p.R186H | Q9NWU2 | protein_coding | tolerated(0.5) | benign(0.01) | TCGA-AJ-A8CT-01 | Endometrium | uterine corpus endometrioid carcinoma | Female | <65 | I/II | Unknown | Unknown | SD |
| GID8 | SNV | Missense_Mutation | c.501N>A | p.Met167Ile | p.M167I | Q9NWU2 | protein_coding | deleterious(0.01) | benign(0.154) | TCGA-AP-A051-01 | Endometrium | uterine corpus endometrioid carcinoma | Female | >=65 | I/II | Unknown | Unknown | SD | |
| GID8 | SNV | Missense_Mutation | c.31N>G | p.Thr11Ala | p.T11A | Q9NWU2 | protein_coding | tolerated(0.17) | benign(0.05) | TCGA-AP-A0LM-01 | Endometrium | uterine corpus endometrioid carcinoma | Female | <65 | III/IV | Chemotherapy | cisplatin | SD |
| Page: 1 2 3 |
Top |
Related drugs of malignant transformation related genes |
| Identification of chemicals and drugs interact with genes involved in malignant transfromation |
| (DGIdb 4.0) |
| Entrez ID | Symbol | Category | Interaction Types | Drug Claim Name | Drug Name | PMIDs |
| Page: 1 |

Copyright 2023-Present -The University of Texas Health Science Center at Houston |