
|
|||||
|
 | |
| |
| |
| |
| |
| |
|
Gene: GHDC |
Gene summary for GHDC |
| Gene information | Species | Human | Gene symbol | GHDC | Gene ID | 84514 |
| Gene name | GH3 domain containing | |
| Gene Alias | D11LGP1 | |
| Cytomap | 17q21.2 | |
| Gene Type | protein-coding | GO ID | GO:0008150 | UniProtAcc | Q8N2G8 |
Top |
Malignant transformation analysis |
| Identification of the aberrant gene expression in precancerous and cancerous lesions by comparing the gene expression of stem-like cells in diseased tissues with normal stem cells |
| Entrez ID | Symbol | Replicates | Species | Organ | Tissue | Adj P-value | Log2FC | Malignancy |
| 84514 | GHDC | LZE24T | Human | Esophagus | ESCC | 3.48e-10 | 2.17e-01 | 0.0596 |
| 84514 | GHDC | P2T-E | Human | Esophagus | ESCC | 8.35e-05 | 5.24e-02 | 0.1177 |
| 84514 | GHDC | P4T-E | Human | Esophagus | ESCC | 3.20e-04 | 5.35e-02 | 0.1323 |
| 84514 | GHDC | P8T-E | Human | Esophagus | ESCC | 9.83e-08 | 1.20e-01 | 0.0889 |
| 84514 | GHDC | P11T-E | Human | Esophagus | ESCC | 8.30e-06 | 1.97e-01 | 0.1426 |
| 84514 | GHDC | P12T-E | Human | Esophagus | ESCC | 3.33e-05 | 1.47e-01 | 0.1122 |
| 84514 | GHDC | P16T-E | Human | Esophagus | ESCC | 7.03e-05 | 1.46e-01 | 0.1153 |
| 84514 | GHDC | P19T-E | Human | Esophagus | ESCC | 2.84e-03 | 2.27e-01 | 0.1662 |
| 84514 | GHDC | P20T-E | Human | Esophagus | ESCC | 1.15e-06 | 9.77e-02 | 0.1124 |
| 84514 | GHDC | P21T-E | Human | Esophagus | ESCC | 3.19e-15 | 2.42e-01 | 0.1617 |
| 84514 | GHDC | P22T-E | Human | Esophagus | ESCC | 2.93e-02 | 3.00e-02 | 0.1236 |
| 84514 | GHDC | P23T-E | Human | Esophagus | ESCC | 1.69e-03 | 9.37e-02 | 0.108 |
| 84514 | GHDC | P24T-E | Human | Esophagus | ESCC | 6.55e-04 | 7.11e-02 | 0.1287 |
| 84514 | GHDC | P26T-E | Human | Esophagus | ESCC | 2.38e-04 | 6.83e-02 | 0.1276 |
| 84514 | GHDC | P31T-E | Human | Esophagus | ESCC | 2.59e-04 | 3.87e-02 | 0.1251 |
| 84514 | GHDC | P32T-E | Human | Esophagus | ESCC | 3.02e-03 | 7.20e-02 | 0.1666 |
| 84514 | GHDC | P36T-E | Human | Esophagus | ESCC | 3.73e-06 | 1.43e-01 | 0.1187 |
| 84514 | GHDC | P37T-E | Human | Esophagus | ESCC | 7.30e-05 | 8.91e-02 | 0.1371 |
| 84514 | GHDC | P39T-E | Human | Esophagus | ESCC | 4.64e-04 | 8.36e-02 | 0.0894 |
| 84514 | GHDC | P42T-E | Human | Esophagus | ESCC | 8.99e-05 | 1.05e-01 | 0.1175 |
| Page: 1 2 3 4 |
| Tissue | Expression Dynamics | Abbreviation |
| Esophagus | 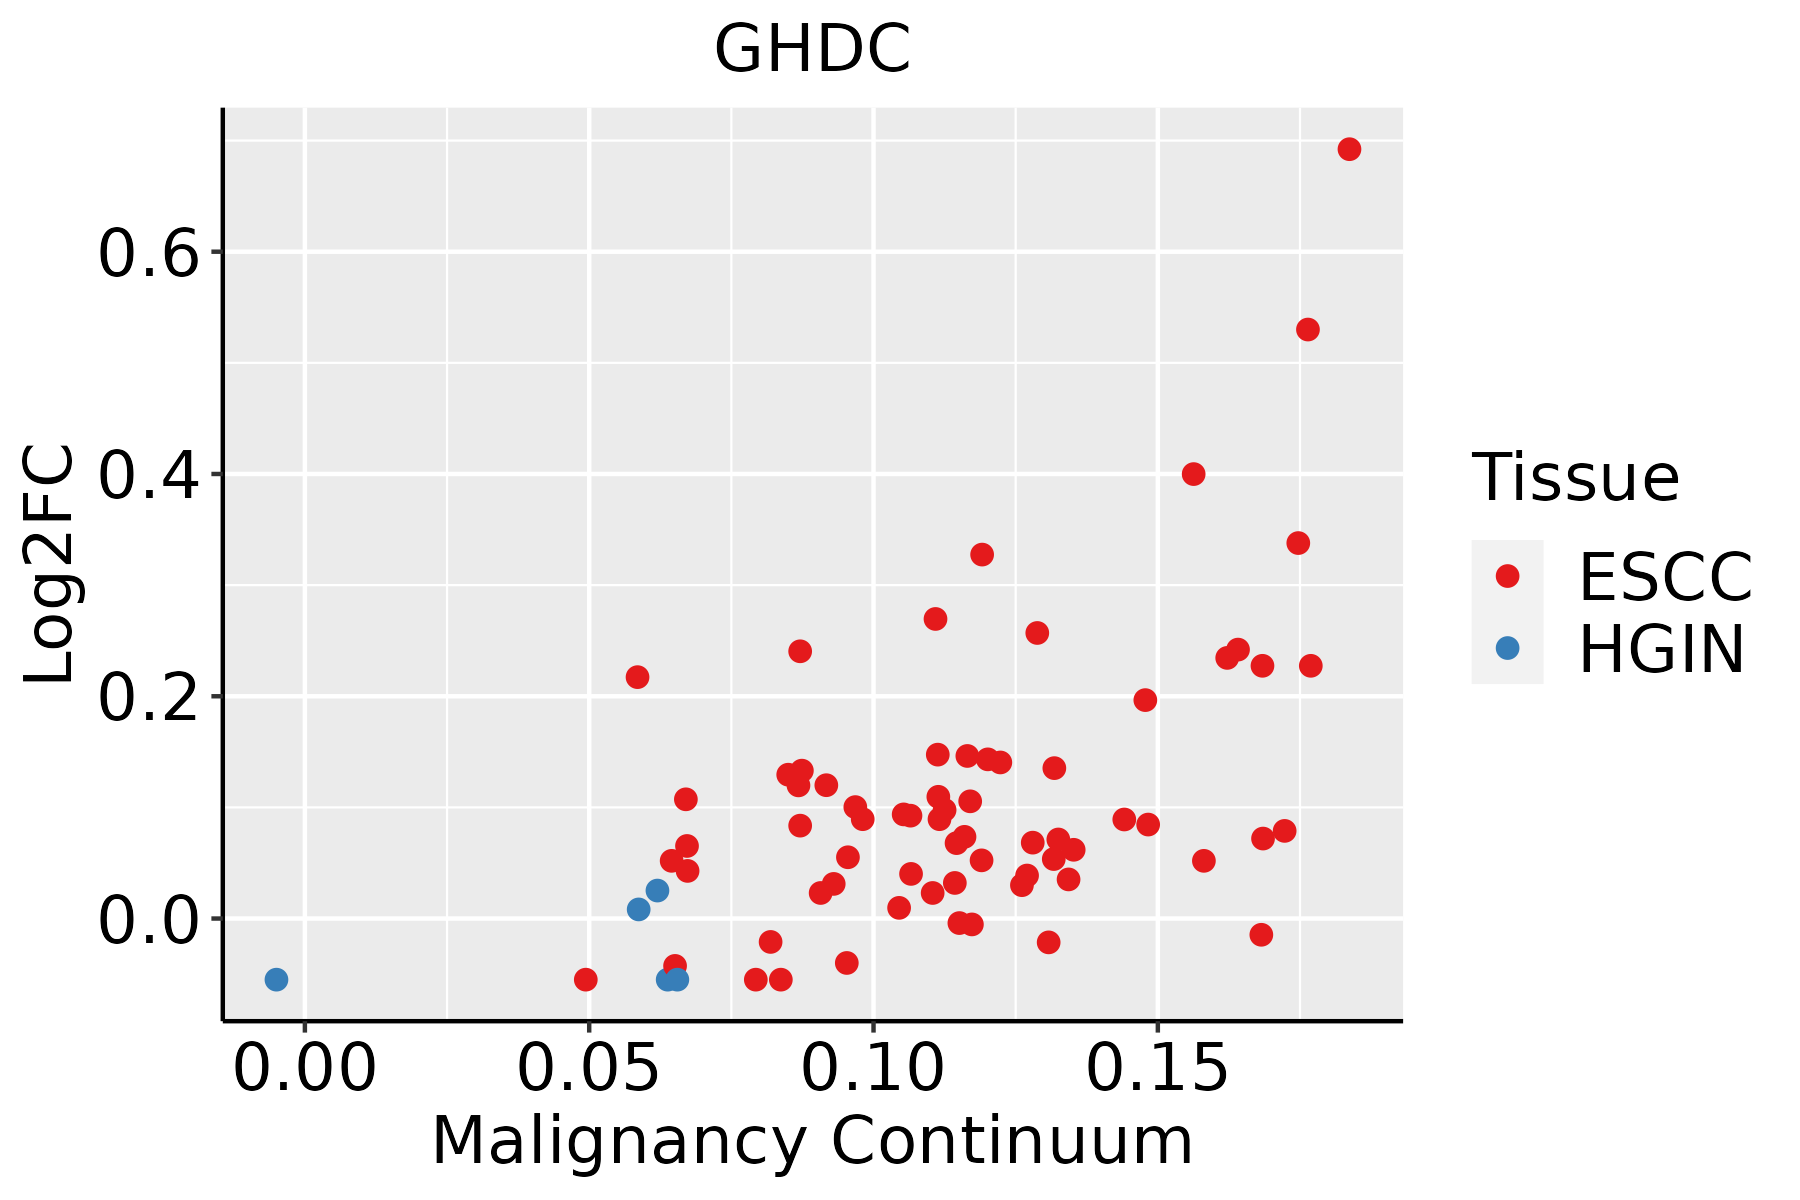 | ESCC: Esophageal squamous cell carcinoma |
| HGIN: High-grade intraepithelial neoplasias | ||
| LGIN: Low-grade intraepithelial neoplasias | ||
| Liver |  | HCC: Hepatocellular carcinoma |
| NAFLD: Non-alcoholic fatty liver disease | ||
| Oral Cavity | 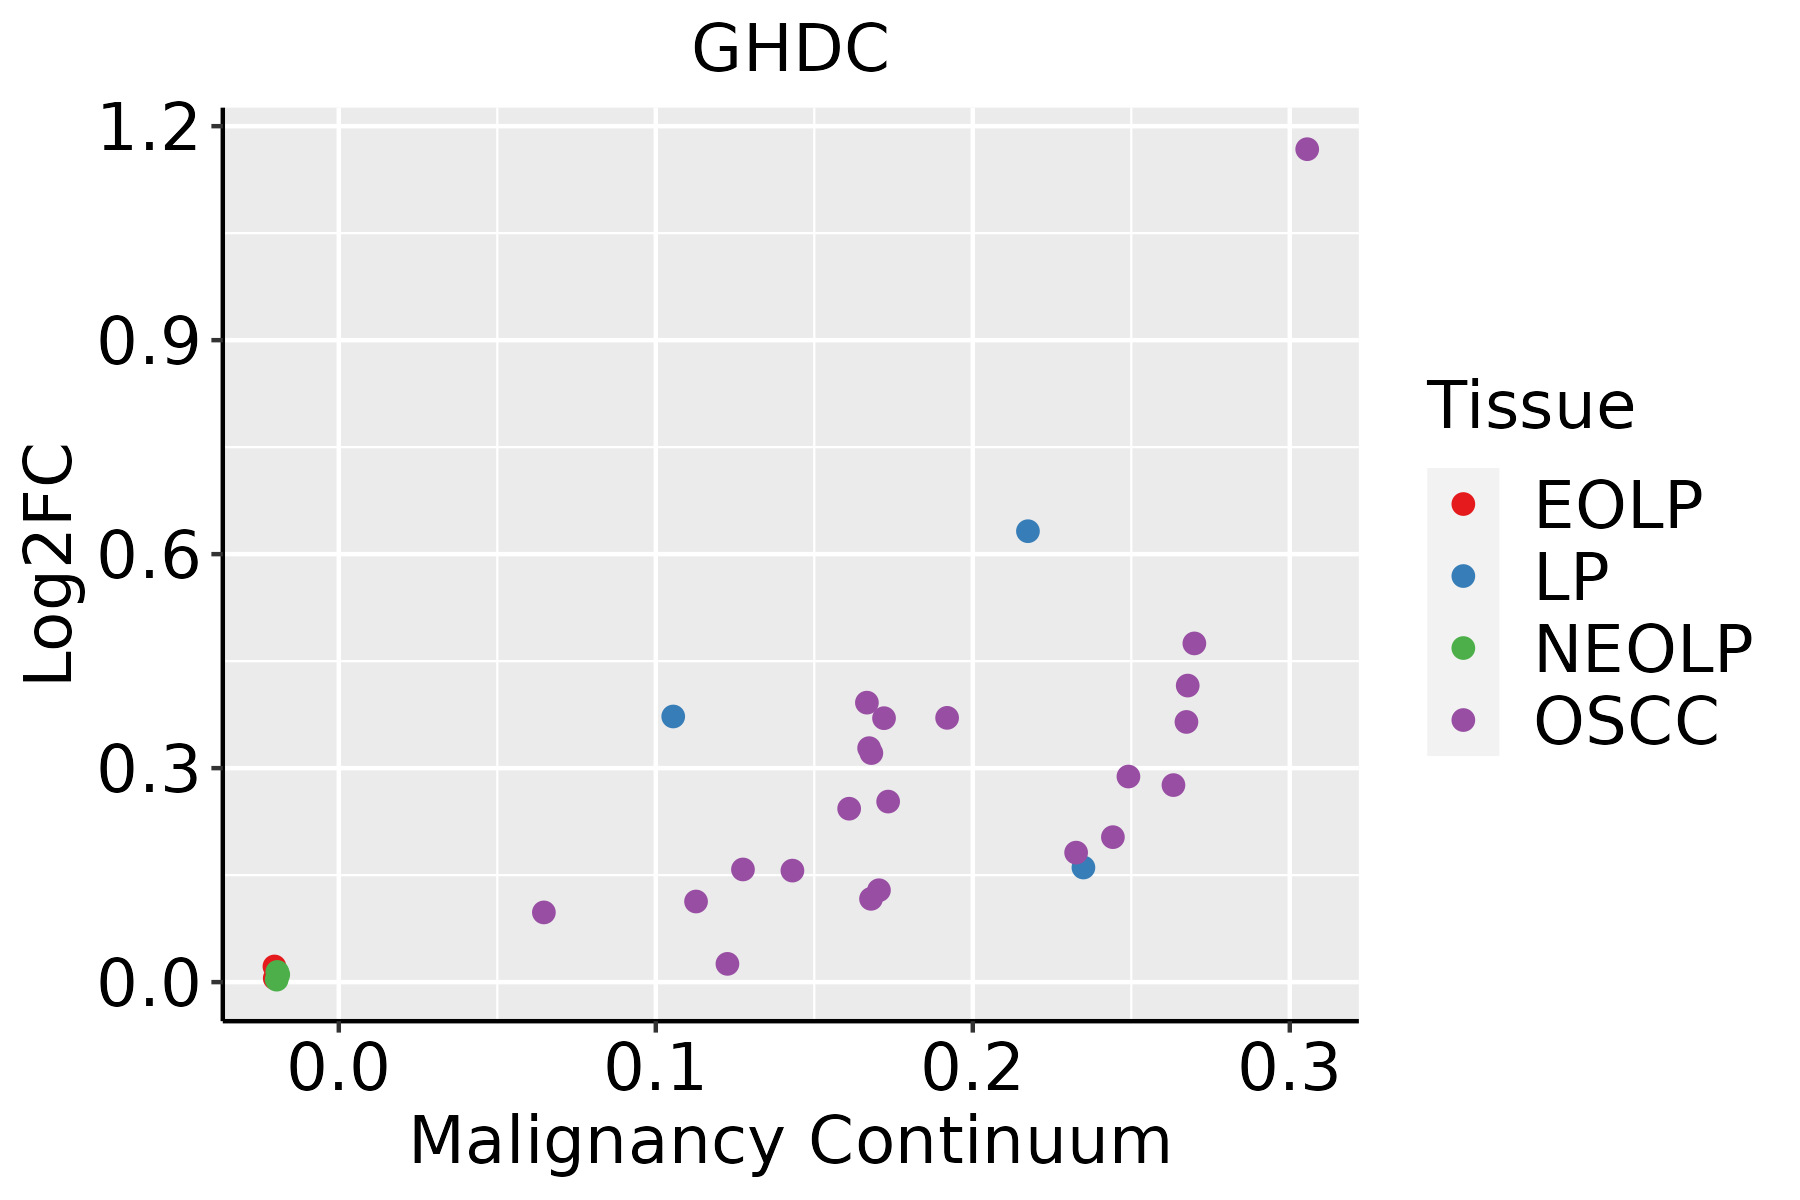 | EOLP: Erosive Oral lichen planus |
| LP: leukoplakia | ||
| NEOLP: Non-erosive oral lichen planus | ||
| OSCC: Oral squamous cell carcinoma | ||
| Thyroid | 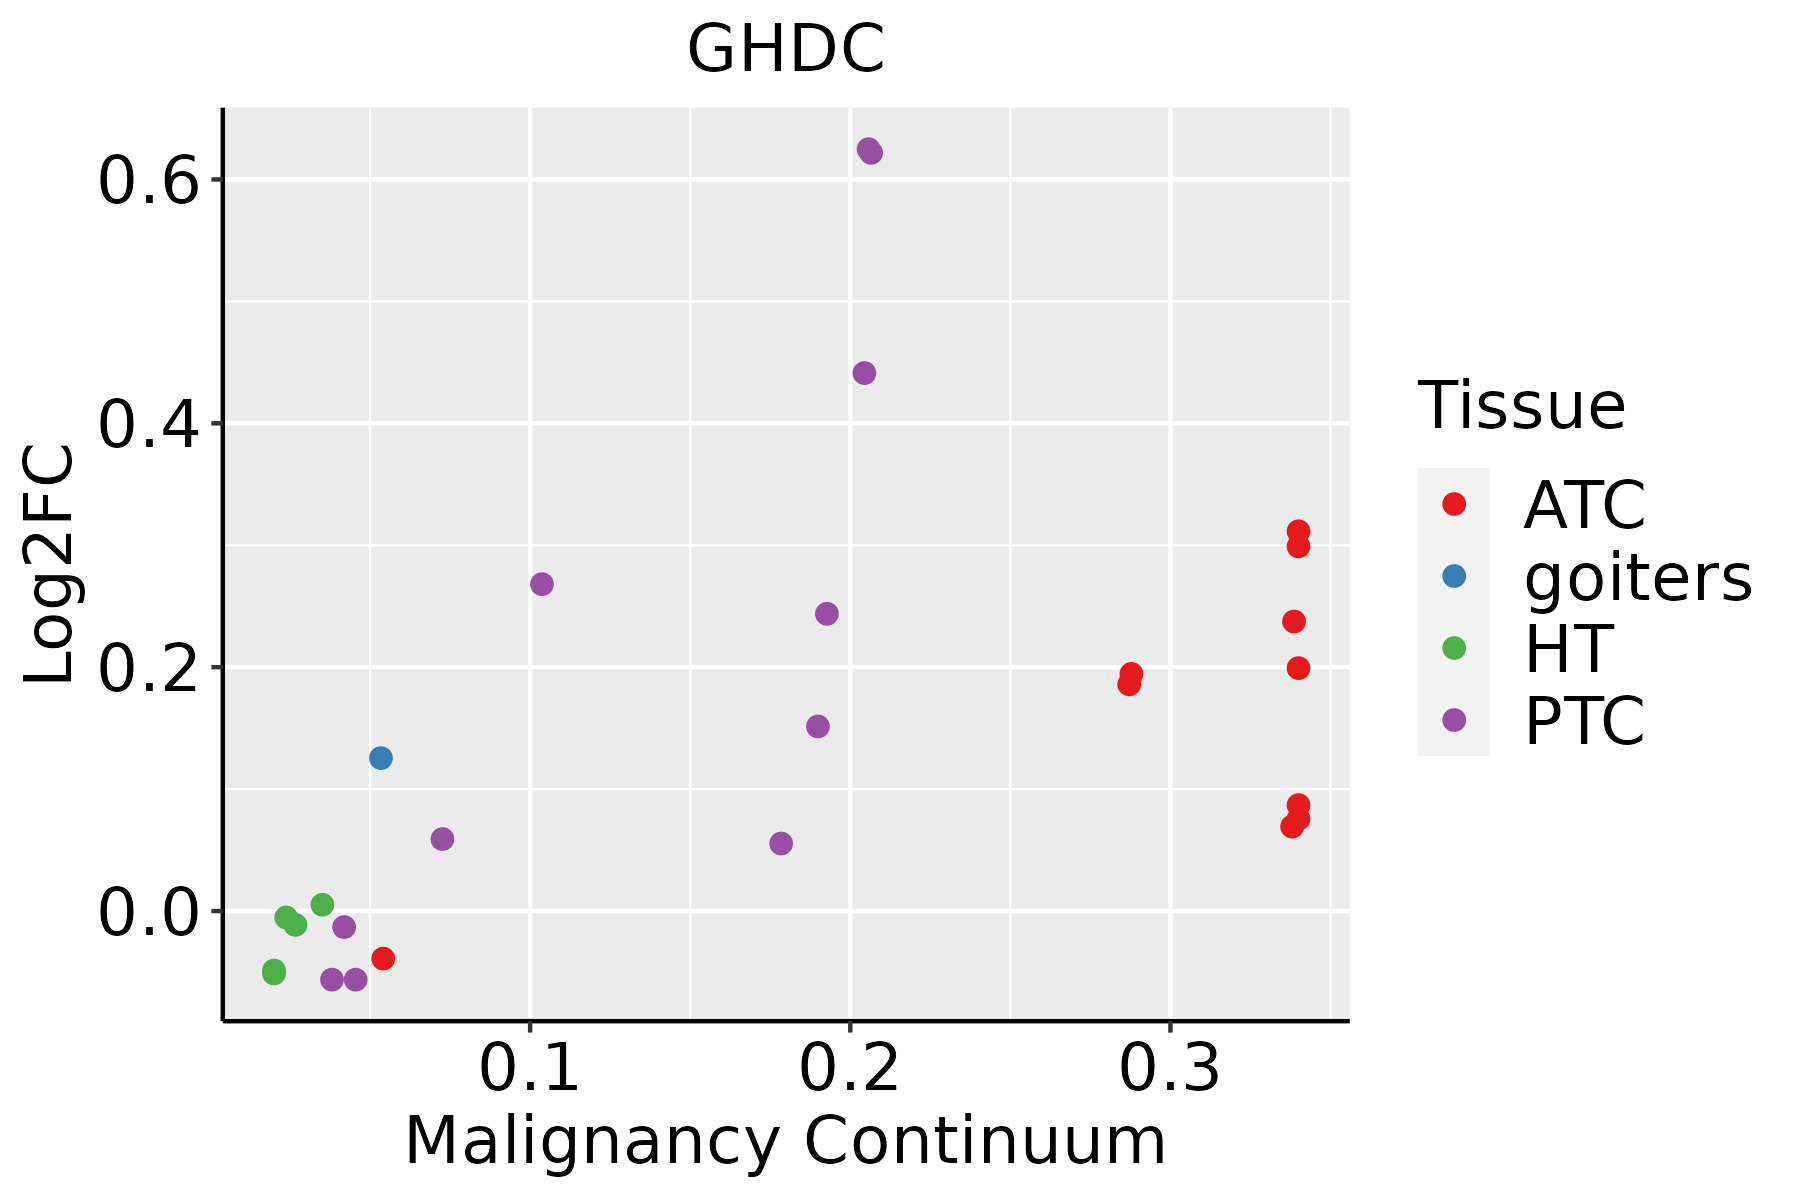 | ATC: Anaplastic thyroid cancer |
| HT: Hashimoto's thyroiditis | ||
| PTC: Papillary thyroid cancer |
| ∗log2FC in expression of this searched gene in stem-like cells from each diseased tissue sample relative to stem-like cells in normal samples in each tissue plotted against the malignancy continuum. Samples are colored based on if they are from different disease stage. |
Top |
Malignant transformation related pathway analysis |
| Find out the enriched GO biological processes and KEGG pathways involved in transition from healthy to precancer to cancer |
| Tissue | Disease Stage | Enriched GO biological Processes |
| Colorectum | AD |  |
| Colorectum | SER |  |
| Colorectum | MSS |  |
| Colorectum | MSI-H |  |
| Colorectum | FAP |  |
| ∗Top 15 enriched GO BP terms are showed in the bar plot of each disease state in each tissue. Each row represents a significant GO biological process which is colored according to the -log10(p.adjust). |
| Page: 1 2 3 4 5 6 7 8 9 |
| GO ID | Tissue | Disease Stage | Description | Gene Ratio | Bg Ratio | pvalue | p.adjust | Count |
| Page: 1 |
| Pathway ID | Tissue | Disease Stage | Description | Gene Ratio | Bg Ratio | pvalue | p.adjust | qvalue | Count |
| Page: 1 |
Top |
Cell-cell communication analysis |
| Identification of potential cell-cell interactions between two cell types and their ligand-receptor pairs for different disease states |
| Ligand | Receptor | LRpair | Pathway | Tissue | Disease Stage |
| Page: 1 |
Top |
Single-cell gene regulatory network inference analysis |
| Find out the significant the regulons (TFs) and the target genes of each regulon across cell types for different disease states |
| TF | Cell Type | Tissue | Disease Stage | Target Gene | RSS | Regulon Activity |
| ∗The dot plots of a searched regulon are shown for all cell subpopulations in each disease state of each tissue based on the regulon specific score inferred using pySCENIC and by calculating the average expression. |
| Page: 1 |
Top |
Somatic mutation of malignant transformation related genes |
| Annotation of somatic variants for genes involved in malignant transformation |
| Hugo Symbol | Variant Class | Variant Classification | dbSNP RS | HGVSc | HGVSp | HGVSp Short | SWISSPROT | BIOTYPE | SIFT | PolyPhen | Tumor Sample Barcode | Tissue | Histology | Sex | Age | Stage | Therapy Types | Drugs | Outcome |
| GHDC | insertion | Frame_Shift_Ins | novel | c.273_274insCCGTGTG | p.Thr92ProfsTer94 | p.T92Pfs*94 | Q8N2G8 | protein_coding | TCGA-B6-A0IA-01 | Breast | breast invasive carcinoma | Female | <65 | I/II | Unknown | Unknown | SD | ||
| GHDC | insertion | Frame_Shift_Ins | novel | c.271_272insACAAGGCCTACCCAGAAGTGCTGGCTCAGGGACGCACT | p.Ser91AsnfsTer22 | p.S91Nfs*22 | Q8N2G8 | protein_coding | TCGA-B6-A0IA-01 | Breast | breast invasive carcinoma | Female | <65 | I/II | Unknown | Unknown | SD | ||
| GHDC | SNV | Missense_Mutation | novel | c.377N>T | p.Ala126Val | p.A126V | Q8N2G8 | protein_coding | tolerated(0.79) | benign(0) | TCGA-2W-A8YY-01 | Cervix | cervical & endocervical cancer | Female | <65 | I/II | Chemotherapy | cisplatin | CR |
| GHDC | SNV | Missense_Mutation | novel | c.1589N>T | p.Ser530Phe | p.S530F | Q8N2G8 | protein_coding | deleterious(0) | probably_damaging(0.909) | TCGA-4J-AA1J-01 | Cervix | cervical & endocervical cancer | Female | <65 | I/II | Unknown | Unknown | SD |
| GHDC | SNV | Missense_Mutation | rs369509799 | c.1318N>A | p.Glu440Lys | p.E440K | Q8N2G8 | protein_coding | deleterious(0.01) | probably_damaging(0.996) | TCGA-DR-A0ZM-01 | Cervix | cervical & endocervical cancer | Female | <65 | III/IV | Unspecific | Cisplatin | SD |
| GHDC | SNV | Missense_Mutation | c.1258N>C | p.Asp420His | p.D420H | Q8N2G8 | protein_coding | deleterious(0) | probably_damaging(1) | TCGA-Q1-A73O-01 | Cervix | cervical & endocervical cancer | Female | <65 | I/II | Chemotherapy | cisplatin | CR | |
| GHDC | deletion | In_Frame_Del | novel | c.728_748delNNNNNNNNNNNNNNNNNNNNN | p.Ala243_Arg249del | p.A243_R249del | Q8N2G8 | protein_coding | TCGA-C5-A7X8-01 | Cervix | cervical & endocervical cancer | Female | <65 | I/II | Chemotherapy | cisplatin | SD | ||
| GHDC | SNV | Missense_Mutation | novel | c.13C>T | p.Pro5Ser | p.P5S | Q8N2G8 | protein_coding | tolerated_low_confidence(0.12) | benign(0) | TCGA-AA-A010-01 | Colorectum | colon adenocarcinoma | Female | <65 | I/II | Chemotherapy | folinic | CR |
| GHDC | SNV | Missense_Mutation | rs200346068 | c.386N>G | p.Gln129Arg | p.Q129R | Q8N2G8 | protein_coding | deleterious(0) | probably_damaging(0.954) | TCGA-D5-6927-01 | Colorectum | colon adenocarcinoma | Male | <65 | I/II | Unknown | Unknown | SD |
| GHDC | SNV | Missense_Mutation | rs200346068 | c.386N>G | p.Gln129Arg | p.Q129R | Q8N2G8 | protein_coding | deleterious(0) | probably_damaging(0.954) | TCGA-G4-6586-01 | Colorectum | colon adenocarcinoma | Female | >=65 | I/II | Unknown | Unknown | SD |
| Page: 1 2 3 4 |
Top |
Related drugs of malignant transformation related genes |
| Identification of chemicals and drugs interact with genes involved in malignant transfromation |
| (DGIdb 4.0) |
| Entrez ID | Symbol | Category | Interaction Types | Drug Claim Name | Drug Name | PMIDs |
| Page: 1 |

Copyright 2023-Present -The University of Texas Health Science Center at Houston |