
|
|||||
|
 | |
| |
| |
| |
| |
| |
|
Gene: GGT7 |
Gene summary for GGT7 |
| Gene information | Species | Human | Gene symbol | GGT7 | Gene ID | 2686 |
| Gene name | gamma-glutamyltransferase 7 | |
| Gene Alias | D20S101 | |
| Cytomap | 20q11.22 | |
| Gene Type | protein-coding | GO ID | GO:0000003 | UniProtAcc | A0PJJ9 |
Top |
Malignant transformation analysis |
| Identification of the aberrant gene expression in precancerous and cancerous lesions by comparing the gene expression of stem-like cells in diseased tissues with normal stem cells |
| Entrez ID | Symbol | Replicates | Species | Organ | Tissue | Adj P-value | Log2FC | Malignancy |
| 2686 | GGT7 | LZE4T | Human | Esophagus | ESCC | 1.53e-05 | 1.79e-01 | 0.0811 |
| 2686 | GGT7 | LZE7T | Human | Esophagus | ESCC | 6.45e-05 | 2.38e-01 | 0.0667 |
| 2686 | GGT7 | LZE24T | Human | Esophagus | ESCC | 1.37e-27 | 5.76e-01 | 0.0596 |
| 2686 | GGT7 | P1T-E | Human | Esophagus | ESCC | 1.48e-07 | 3.19e-01 | 0.0875 |
| 2686 | GGT7 | P2T-E | Human | Esophagus | ESCC | 9.97e-24 | 3.81e-01 | 0.1177 |
| 2686 | GGT7 | P4T-E | Human | Esophagus | ESCC | 4.09e-13 | 2.89e-01 | 0.1323 |
| 2686 | GGT7 | P5T-E | Human | Esophagus | ESCC | 6.32e-13 | 8.32e-02 | 0.1327 |
| 2686 | GGT7 | P8T-E | Human | Esophagus | ESCC | 1.58e-22 | 3.91e-01 | 0.0889 |
| 2686 | GGT7 | P9T-E | Human | Esophagus | ESCC | 2.40e-05 | 1.32e-01 | 0.1131 |
| 2686 | GGT7 | P10T-E | Human | Esophagus | ESCC | 1.54e-44 | 7.24e-01 | 0.116 |
| 2686 | GGT7 | P11T-E | Human | Esophagus | ESCC | 2.19e-13 | 4.39e-01 | 0.1426 |
| 2686 | GGT7 | P12T-E | Human | Esophagus | ESCC | 1.09e-28 | 5.75e-01 | 0.1122 |
| 2686 | GGT7 | P15T-E | Human | Esophagus | ESCC | 5.72e-27 | 5.24e-01 | 0.1149 |
| 2686 | GGT7 | P16T-E | Human | Esophagus | ESCC | 1.76e-71 | 1.23e+00 | 0.1153 |
| 2686 | GGT7 | P17T-E | Human | Esophagus | ESCC | 1.54e-07 | 2.51e-01 | 0.1278 |
| 2686 | GGT7 | P19T-E | Human | Esophagus | ESCC | 3.39e-03 | 2.82e-01 | 0.1662 |
| 2686 | GGT7 | P20T-E | Human | Esophagus | ESCC | 3.83e-05 | 1.33e-01 | 0.1124 |
| 2686 | GGT7 | P21T-E | Human | Esophagus | ESCC | 4.43e-26 | 3.48e-01 | 0.1617 |
| 2686 | GGT7 | P22T-E | Human | Esophagus | ESCC | 3.07e-23 | 3.65e-01 | 0.1236 |
| 2686 | GGT7 | P23T-E | Human | Esophagus | ESCC | 1.44e-24 | 4.34e-01 | 0.108 |
| Page: 1 2 3 4 |
| Tissue | Expression Dynamics | Abbreviation |
| Esophagus | 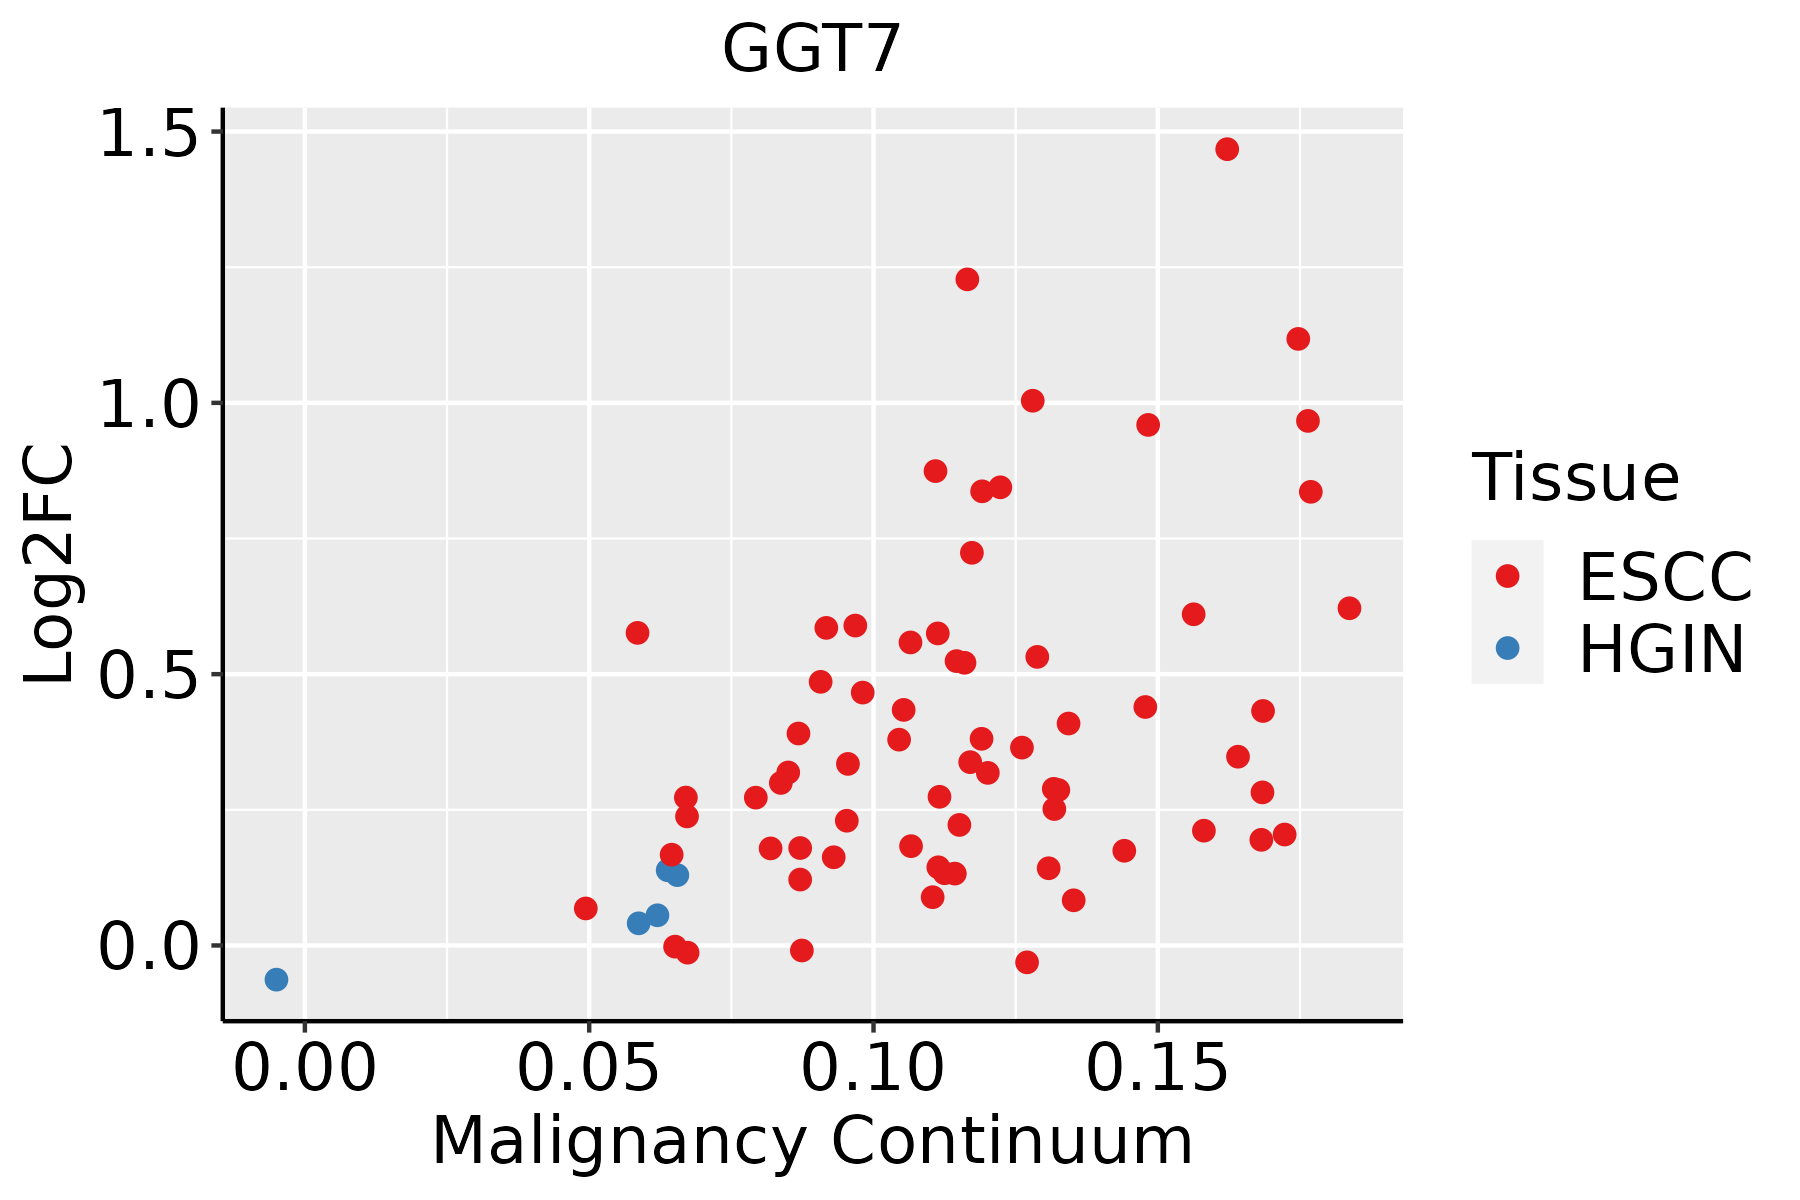 | ESCC: Esophageal squamous cell carcinoma |
| HGIN: High-grade intraepithelial neoplasias | ||
| LGIN: Low-grade intraepithelial neoplasias | ||
| Liver |  | HCC: Hepatocellular carcinoma |
| NAFLD: Non-alcoholic fatty liver disease | ||
| Oral Cavity | 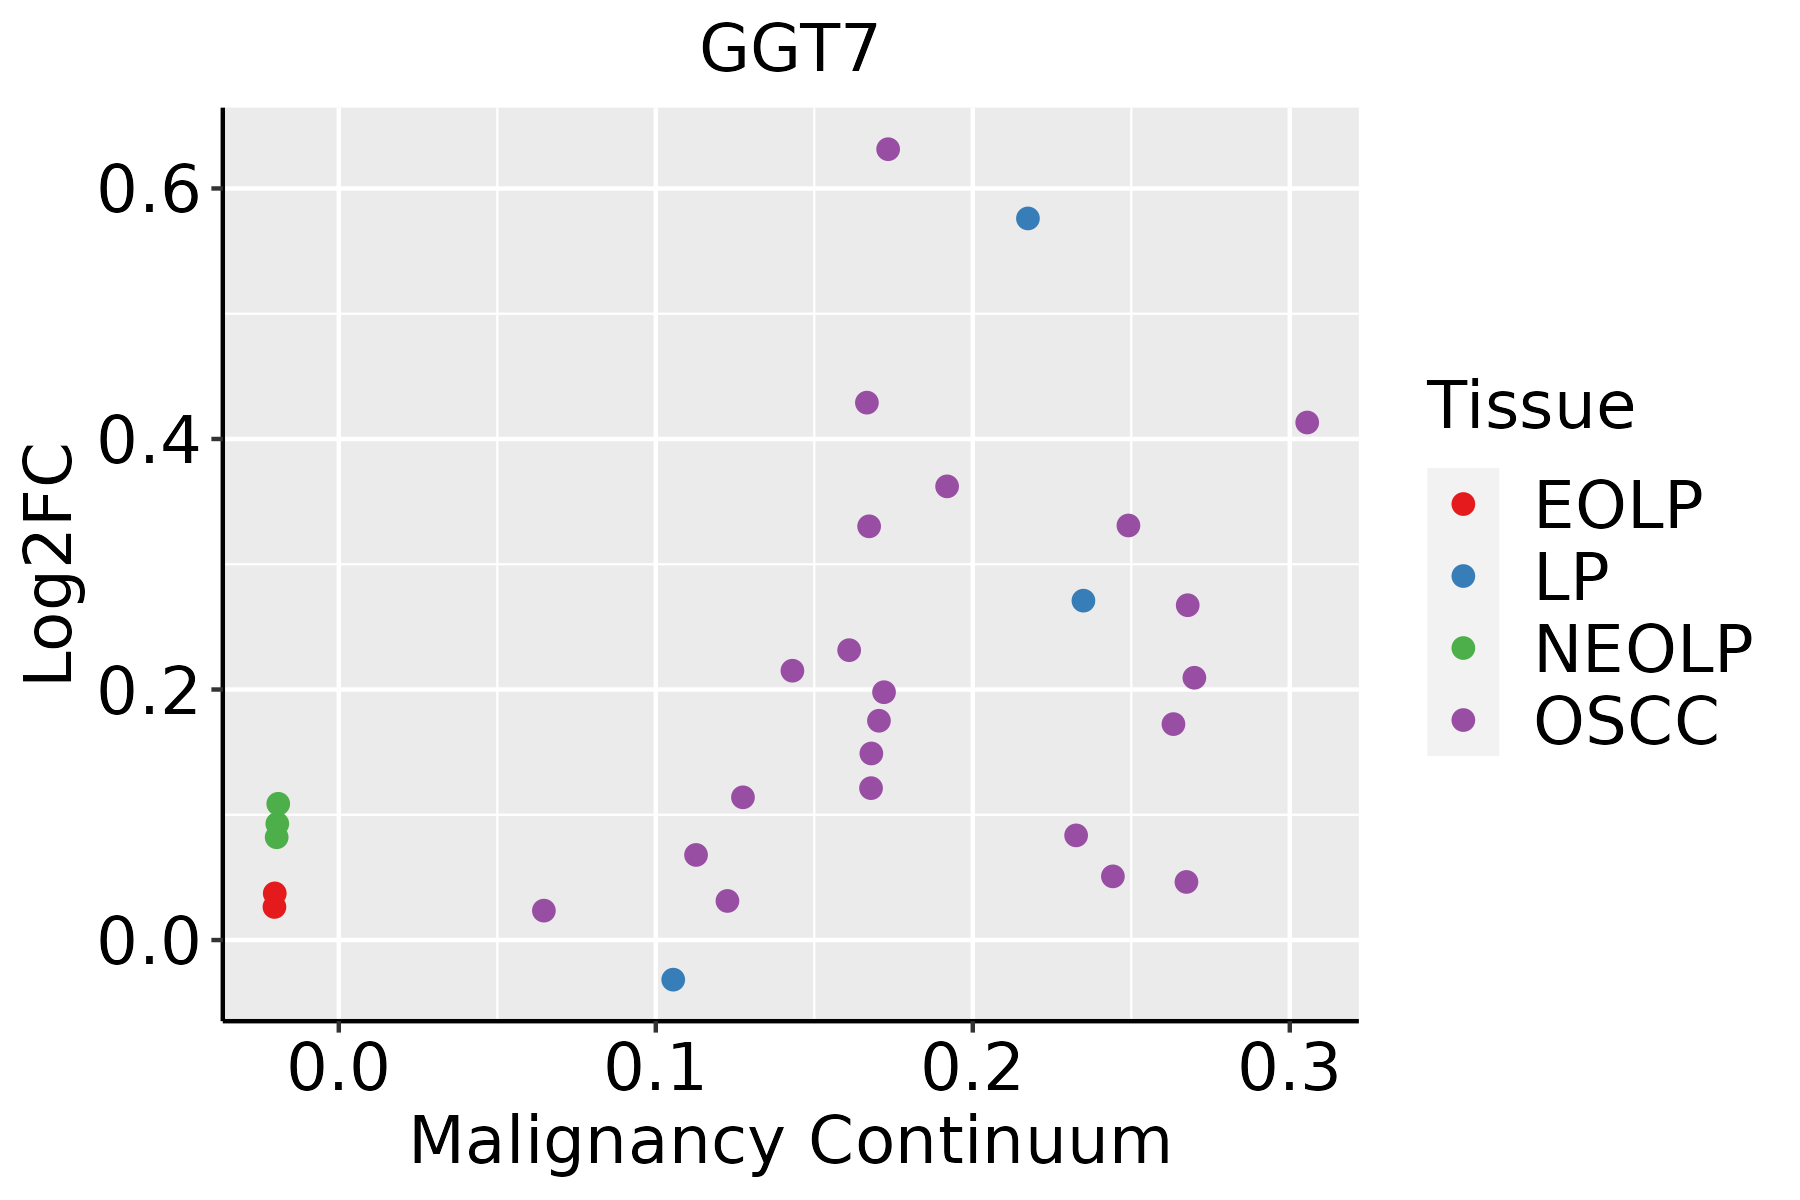 | EOLP: Erosive Oral lichen planus |
| LP: leukoplakia | ||
| NEOLP: Non-erosive oral lichen planus | ||
| OSCC: Oral squamous cell carcinoma |
| ∗log2FC in expression of this searched gene in stem-like cells from each diseased tissue sample relative to stem-like cells in normal samples in each tissue plotted against the malignancy continuum. Samples are colored based on if they are from different disease stage. |
Top |
Malignant transformation related pathway analysis |
| Find out the enriched GO biological processes and KEGG pathways involved in transition from healthy to precancer to cancer |
| Tissue | Disease Stage | Enriched GO biological Processes |
| Colorectum | AD |  |
| Colorectum | SER |  |
| Colorectum | MSS |  |
| Colorectum | MSI-H |  |
| Colorectum | FAP |  |
| ∗Top 15 enriched GO BP terms are showed in the bar plot of each disease state in each tissue. Each row represents a significant GO biological process which is colored according to the -log10(p.adjust). |
| Page: 1 2 3 4 5 6 7 8 9 |
| GO ID | Tissue | Disease Stage | Description | Gene Ratio | Bg Ratio | pvalue | p.adjust | Count |
| GO:0006979111 | Esophagus | ESCC | response to oxidative stress | 303/8552 | 446/18723 | 7.15e-22 | 1.30e-19 | 303 |
| GO:00067906 | Esophagus | ESCC | sulfur compound metabolic process | 201/8552 | 339/18723 | 2.64e-07 | 3.94e-06 | 201 |
| GO:00442725 | Esophagus | ESCC | sulfur compound biosynthetic process | 96/8552 | 148/18723 | 1.86e-06 | 2.16e-05 | 96 |
| GO:003461220 | Esophagus | ESCC | response to tumor necrosis factor | 149/8552 | 253/18723 | 1.47e-05 | 1.33e-04 | 149 |
| GO:00065757 | Esophagus | ESCC | cellular modified amino acid metabolic process | 112/8552 | 188/18723 | 8.31e-05 | 6.06e-04 | 112 |
| GO:00423986 | Esophagus | ESCC | cellular modified amino acid biosynthetic process | 34/8552 | 46/18723 | 9.39e-05 | 6.70e-04 | 34 |
| GO:003249619 | Esophagus | ESCC | response to lipopolysaccharide | 191/8552 | 343/18723 | 1.11e-04 | 7.73e-04 | 191 |
| GO:00463948 | Esophagus | ESCC | carboxylic acid biosynthetic process | 175/8552 | 314/18723 | 1.98e-04 | 1.26e-03 | 175 |
| GO:00160538 | Esophagus | ESCC | organic acid biosynthetic process | 175/8552 | 316/18723 | 3.04e-04 | 1.82e-03 | 175 |
| GO:000674912 | Esophagus | ESCC | glutathione metabolic process | 42/8552 | 64/18723 | 1.01e-03 | 5.12e-03 | 42 |
| GO:000223719 | Esophagus | ESCC | response to molecule of bacterial origin | 194/8552 | 363/18723 | 1.64e-03 | 7.61e-03 | 194 |
| GO:190288220 | Esophagus | ESCC | regulation of response to oxidative stress | 58/8552 | 98/18723 | 4.86e-03 | 1.88e-02 | 58 |
| GO:000697922 | Liver | HCC | response to oxidative stress | 281/7958 | 446/18723 | 9.75e-19 | 1.24e-16 | 281 |
| GO:001605321 | Liver | HCC | organic acid biosynthetic process | 200/7958 | 316/18723 | 5.24e-14 | 3.22e-12 | 200 |
| GO:000679021 | Liver | HCC | sulfur compound metabolic process | 212/7958 | 339/18723 | 5.60e-14 | 3.39e-12 | 212 |
| GO:004639421 | Liver | HCC | carboxylic acid biosynthetic process | 198/7958 | 314/18723 | 1.19e-13 | 6.78e-12 | 198 |
| GO:000657521 | Liver | HCC | cellular modified amino acid metabolic process | 119/7958 | 188/18723 | 6.47e-09 | 1.67e-07 | 119 |
| GO:00442722 | Liver | HCC | sulfur compound biosynthetic process | 95/7958 | 148/18723 | 7.89e-08 | 1.58e-06 | 95 |
| GO:004239821 | Liver | HCC | cellular modified amino acid biosynthetic process | 34/7958 | 46/18723 | 1.53e-05 | 1.67e-04 | 34 |
| GO:000674911 | Liver | HCC | glutathione metabolic process | 44/7958 | 64/18723 | 1.95e-05 | 2.09e-04 | 44 |
| Page: 1 2 3 |
| Pathway ID | Tissue | Disease Stage | Description | Gene Ratio | Bg Ratio | pvalue | p.adjust | qvalue | Count |
| hsa0048018 | Esophagus | ESCC | Glutathione metabolism | 44/4205 | 57/8465 | 1.81e-05 | 9.03e-05 | 4.63e-05 | 44 |
| hsa0048019 | Esophagus | ESCC | Glutathione metabolism | 44/4205 | 57/8465 | 1.81e-05 | 9.03e-05 | 4.63e-05 | 44 |
| hsa0048022 | Liver | HCC | Glutathione metabolism | 42/4020 | 57/8465 | 5.00e-05 | 2.62e-04 | 1.46e-04 | 42 |
| hsa0048032 | Liver | HCC | Glutathione metabolism | 42/4020 | 57/8465 | 5.00e-05 | 2.62e-04 | 1.46e-04 | 42 |
| hsa0048016 | Oral cavity | OSCC | Glutathione metabolism | 36/3704 | 57/8465 | 2.41e-03 | 6.41e-03 | 3.26e-03 | 36 |
| hsa0048017 | Oral cavity | OSCC | Glutathione metabolism | 36/3704 | 57/8465 | 2.41e-03 | 6.41e-03 | 3.26e-03 | 36 |
| hsa0048024 | Oral cavity | LP | Glutathione metabolism | 25/2418 | 57/8465 | 9.58e-03 | 3.47e-02 | 2.24e-02 | 25 |
| hsa0048034 | Oral cavity | LP | Glutathione metabolism | 25/2418 | 57/8465 | 9.58e-03 | 3.47e-02 | 2.24e-02 | 25 |
| Page: 1 |
Top |
Cell-cell communication analysis |
| Identification of potential cell-cell interactions between two cell types and their ligand-receptor pairs for different disease states |
| Ligand | Receptor | LRpair | Pathway | Tissue | Disease Stage |
| Page: 1 |
Top |
Single-cell gene regulatory network inference analysis |
| Find out the significant the regulons (TFs) and the target genes of each regulon across cell types for different disease states |
| TF | Cell Type | Tissue | Disease Stage | Target Gene | RSS | Regulon Activity |
| ∗The dot plots of a searched regulon are shown for all cell subpopulations in each disease state of each tissue based on the regulon specific score inferred using pySCENIC and by calculating the average expression. |
| Page: 1 |
Top |
Somatic mutation of malignant transformation related genes |
| Annotation of somatic variants for genes involved in malignant transformation |
| Hugo Symbol | Variant Class | Variant Classification | dbSNP RS | HGVSc | HGVSp | HGVSp Short | SWISSPROT | BIOTYPE | SIFT | PolyPhen | Tumor Sample Barcode | Tissue | Histology | Sex | Age | Stage | Therapy Types | Drugs | Outcome |
| GGT7 | SNV | Missense_Mutation | rs556288098 | c.1100N>A | p.Arg367Lys | p.R367K | Q9UJ14 | protein_coding | tolerated(0.47) | benign(0) | TCGA-A2-A0EQ-01 | Breast | breast invasive carcinoma | Female | <65 | I/II | Chemotherapy | adriamycin | SD |
| GGT7 | SNV | Missense_Mutation | novel | c.1552N>A | p.Pro518Thr | p.P518T | Q9UJ14 | protein_coding | tolerated(0.11) | benign(0.081) | TCGA-E2-A1B6-01 | Breast | breast invasive carcinoma | Female | <65 | I/II | Unspecific | Adriamycin | SD |
| GGT7 | SNV | Missense_Mutation | rs778546985 | c.979G>A | p.Ala327Thr | p.A327T | Q9UJ14 | protein_coding | tolerated(0.26) | benign(0.006) | TCGA-OL-A6VQ-01 | Breast | breast invasive carcinoma | Female | <65 | I/II | Unknown | Unknown | SD |
| GGT7 | SNV | Missense_Mutation | novel | c.659N>T | p.Arg220Ile | p.R220I | Q9UJ14 | protein_coding | tolerated(0.2) | benign(0.062) | TCGA-2W-A8YY-01 | Cervix | cervical & endocervical cancer | Female | <65 | I/II | Chemotherapy | cisplatin | CR |
| GGT7 | SNV | Missense_Mutation | c.1361N>T | p.Ser454Phe | p.S454F | Q9UJ14 | protein_coding | deleterious(0) | probably_damaging(0.99) | TCGA-EK-A2PG-01 | Cervix | cervical & endocervical cancer | Female | >=65 | I/II | Unknown | Unknown | SD | |
| GGT7 | SNV | Missense_Mutation | rs766936948 | c.1093N>A | p.Val365Met | p.V365M | Q9UJ14 | protein_coding | tolerated(0.16) | benign(0.01) | TCGA-A6-3808-01 | Colorectum | colon adenocarcinoma | Male | >=65 | I/II | Unknown | Unknown | SD |
| GGT7 | SNV | Missense_Mutation | novel | c.1495G>A | p.Gly499Ser | p.G499S | Q9UJ14 | protein_coding | tolerated(0.09) | probably_damaging(0.949) | TCGA-AA-3947-01 | Colorectum | colon adenocarcinoma | Female | <65 | I/II | Unknown | Unknown | SD |
| GGT7 | SNV | Missense_Mutation | rs780547379 | c.890G>A | p.Arg297His | p.R297H | Q9UJ14 | protein_coding | tolerated(0.3) | benign(0.005) | TCGA-AA-3947-01 | Colorectum | colon adenocarcinoma | Female | <65 | I/II | Unknown | Unknown | SD |
| GGT7 | SNV | Missense_Mutation | novel | c.34G>A | p.Ala12Thr | p.A12T | Q9UJ14 | protein_coding | tolerated_low_confidence(1) | benign(0) | TCGA-AA-3947-01 | Colorectum | colon adenocarcinoma | Female | <65 | I/II | Unknown | Unknown | SD |
| GGT7 | SNV | Missense_Mutation | rs746457014 | c.463G>A | p.Glu155Lys | p.E155K | Q9UJ14 | protein_coding | tolerated(0.17) | benign(0.04) | TCGA-AA-A010-01 | Colorectum | colon adenocarcinoma | Female | <65 | I/II | Chemotherapy | folinic | CR |
| Page: 1 2 3 4 5 6 |
Top |
Related drugs of malignant transformation related genes |
| Identification of chemicals and drugs interact with genes involved in malignant transfromation |
| (DGIdb 4.0) |
| Entrez ID | Symbol | Category | Interaction Types | Drug Claim Name | Drug Name | PMIDs |
| Page: 1 |

Copyright 2023-Present -The University of Texas Health Science Center at Houston |