
|
|||||
|
 | |
| |
| |
| |
| |
| |
|
Gene: GGT6 |
Gene summary for GGT6 |
| Gene information | Species | Human | Gene symbol | GGT6 | Gene ID | 124975 |
| Gene name | gamma-glutamyltransferase 6 | |
| Gene Alias | GGT6 | |
| Cytomap | 17p13.2 | |
| Gene Type | protein-coding | GO ID | GO:0006082 | UniProtAcc | Q6P531 |
Top |
Malignant transformation analysis |
| Identification of the aberrant gene expression in precancerous and cancerous lesions by comparing the gene expression of stem-like cells in diseased tissues with normal stem cells |
| Entrez ID | Symbol | Replicates | Species | Organ | Tissue | Adj P-value | Log2FC | Malignancy |
| 124975 | GGT6 | HTA11_3410_2000001011 | Human | Colorectum | AD | 4.01e-03 | 1.76e-01 | 0.0155 |
| 124975 | GGT6 | HTA11_2487_2000001011 | Human | Colorectum | SER | 5.27e-21 | 8.66e-01 | -0.1808 |
| 124975 | GGT6 | HTA11_1938_2000001011 | Human | Colorectum | AD | 3.43e-18 | 7.51e-01 | -0.0811 |
| 124975 | GGT6 | HTA11_78_2000001011 | Human | Colorectum | AD | 3.76e-13 | 6.59e-01 | -0.1088 |
| 124975 | GGT6 | HTA11_347_2000001011 | Human | Colorectum | AD | 7.67e-56 | 1.28e+00 | -0.1954 |
| 124975 | GGT6 | HTA11_411_2000001011 | Human | Colorectum | SER | 4.09e-08 | 1.25e+00 | -0.2602 |
| 124975 | GGT6 | HTA11_2112_2000001011 | Human | Colorectum | SER | 2.11e-05 | 7.20e-01 | -0.2196 |
| 124975 | GGT6 | HTA11_3361_2000001011 | Human | Colorectum | AD | 1.44e-16 | 7.39e-01 | -0.1207 |
| 124975 | GGT6 | HTA11_83_2000001011 | Human | Colorectum | SER | 1.75e-11 | 5.58e-01 | -0.1526 |
| 124975 | GGT6 | HTA11_696_2000001011 | Human | Colorectum | AD | 2.33e-32 | 8.82e-01 | -0.1464 |
| 124975 | GGT6 | HTA11_866_2000001011 | Human | Colorectum | AD | 1.62e-16 | 6.11e-01 | -0.1001 |
| 124975 | GGT6 | HTA11_1391_2000001011 | Human | Colorectum | AD | 1.02e-19 | 7.56e-01 | -0.059 |
| 124975 | GGT6 | HTA11_2992_2000001011 | Human | Colorectum | SER | 7.46e-07 | 7.92e-01 | -0.1706 |
| 124975 | GGT6 | HTA11_5212_2000001011 | Human | Colorectum | AD | 1.33e-16 | 1.13e+00 | -0.2061 |
| 124975 | GGT6 | HTA11_5216_2000001011 | Human | Colorectum | SER | 1.50e-09 | 7.43e-01 | -0.1462 |
| 124975 | GGT6 | HTA11_546_2000001011 | Human | Colorectum | AD | 9.10e-07 | 5.67e-01 | -0.0842 |
| 124975 | GGT6 | HTA11_866_3004761011 | Human | Colorectum | AD | 8.39e-05 | 2.64e-01 | 0.096 |
| 124975 | GGT6 | HTA11_7663_2000001011 | Human | Colorectum | SER | 6.09e-03 | 4.24e-01 | 0.0131 |
| 124975 | GGT6 | HTA11_10623_2000001011 | Human | Colorectum | AD | 5.65e-04 | 5.10e-01 | -0.0177 |
| 124975 | GGT6 | HTA11_6801_2000001011 | Human | Colorectum | SER | 4.03e-03 | 4.23e-01 | 0.0171 |
| Page: 1 2 3 4 |
| Tissue | Expression Dynamics | Abbreviation |
| Colorectum (GSE201348) |  | FAP: Familial adenomatous polyposis |
| CRC: Colorectal cancer | ||
| Colorectum (HTA11) |  | AD: Adenomas |
| SER: Sessile serrated lesions | ||
| MSI-H: Microsatellite-high colorectal cancer | ||
| MSS: Microsatellite stable colorectal cancer | ||
| Esophagus | 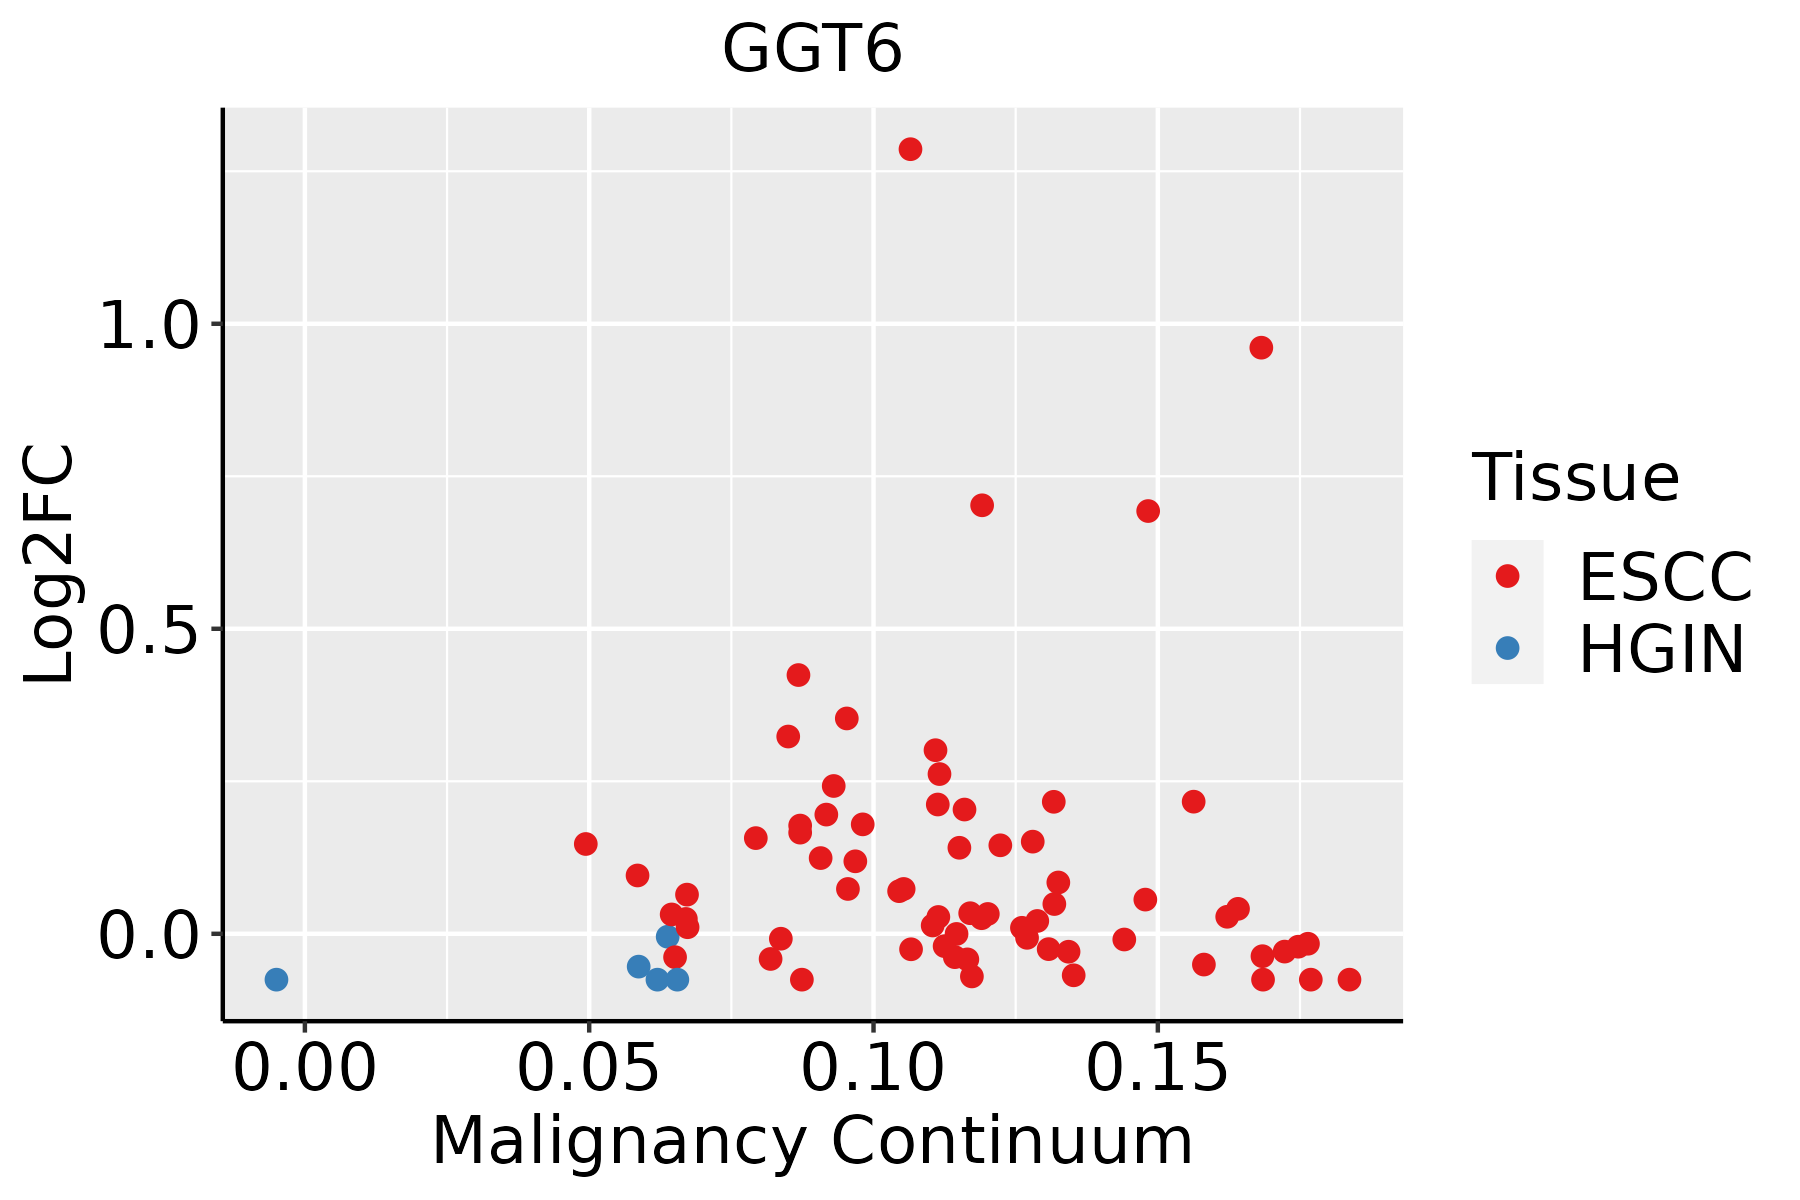 | ESCC: Esophageal squamous cell carcinoma |
| HGIN: High-grade intraepithelial neoplasias | ||
| LGIN: Low-grade intraepithelial neoplasias | ||
| Liver | 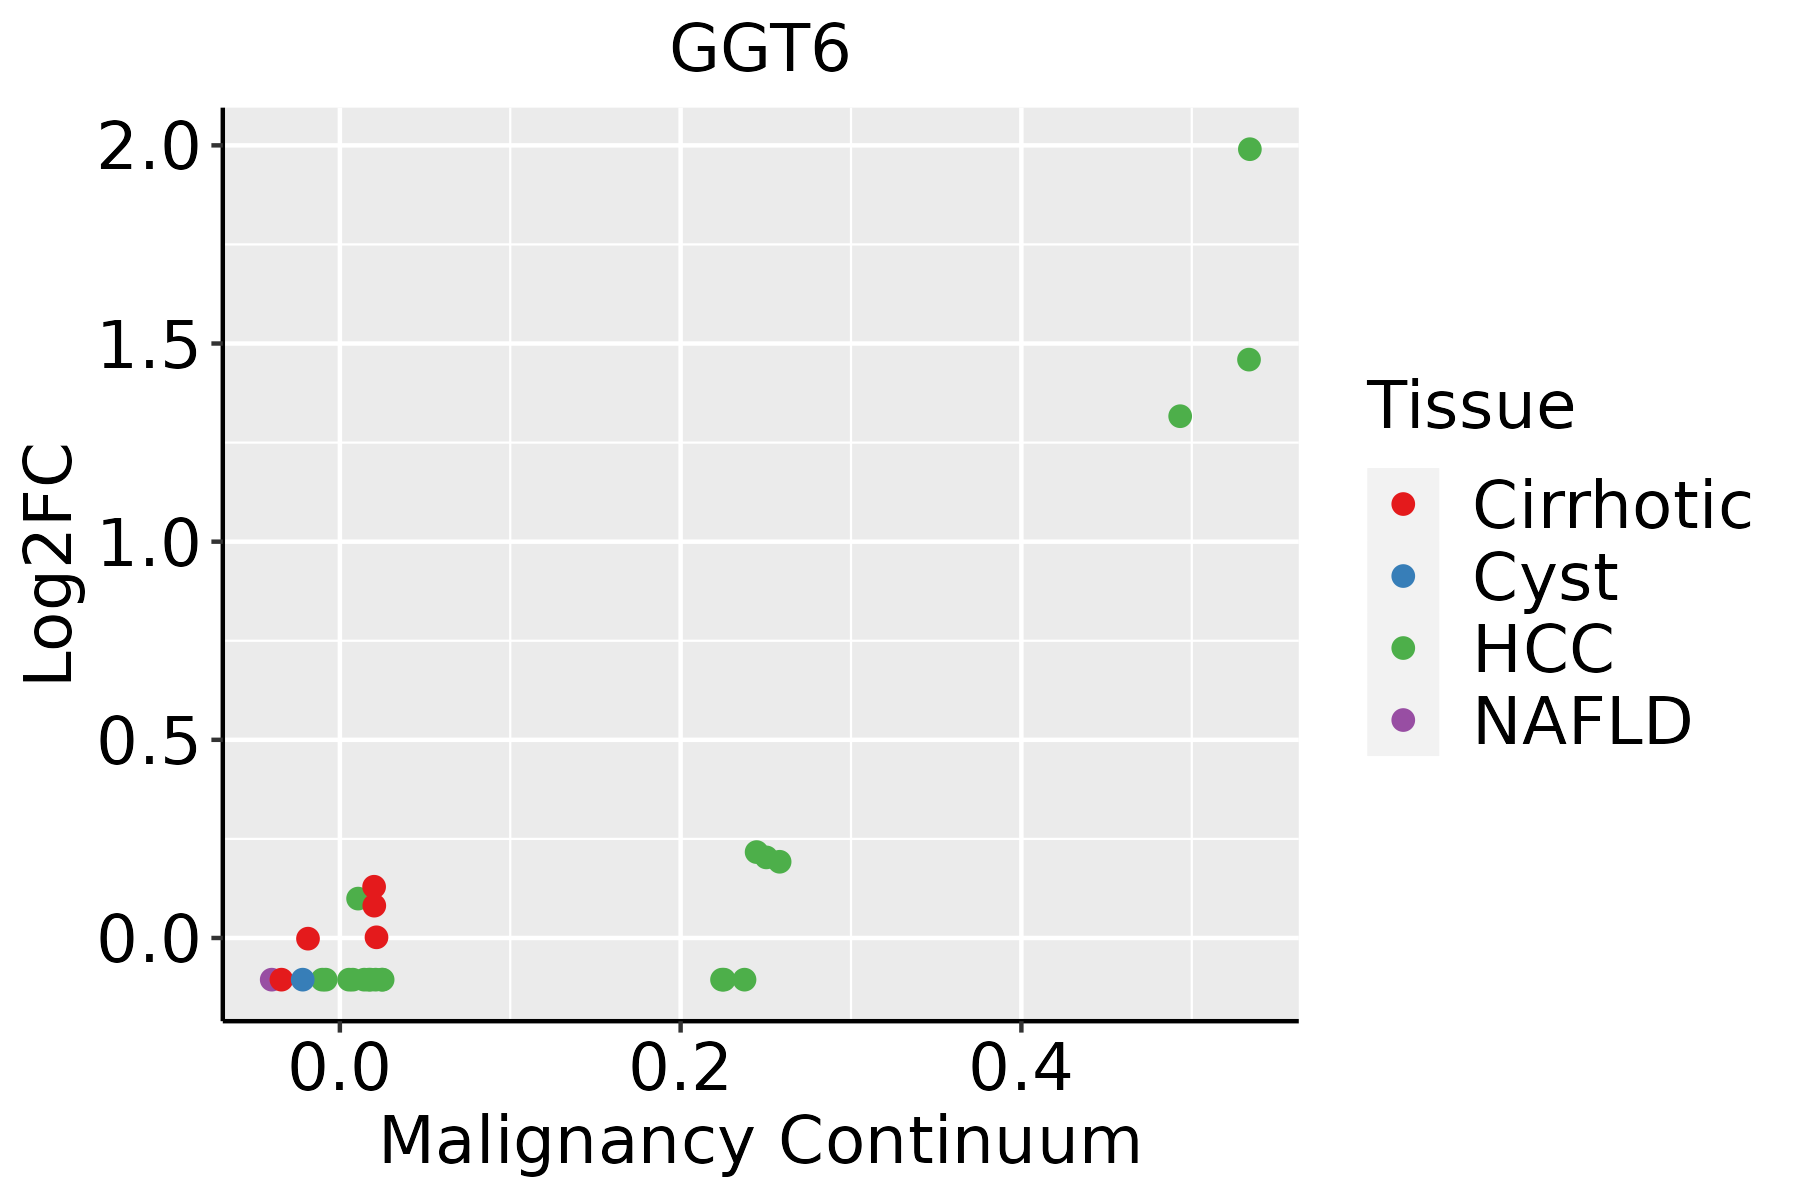 | HCC: Hepatocellular carcinoma |
| NAFLD: Non-alcoholic fatty liver disease |
| ∗log2FC in expression of this searched gene in stem-like cells from each diseased tissue sample relative to stem-like cells in normal samples in each tissue plotted against the malignancy continuum. Samples are colored based on if they are from different disease stage. |
Top |
Malignant transformation related pathway analysis |
| Find out the enriched GO biological processes and KEGG pathways involved in transition from healthy to precancer to cancer |
| Tissue | Disease Stage | Enriched GO biological Processes |
| Colorectum | AD |  |
| Colorectum | SER |  |
| Colorectum | MSS |  |
| Colorectum | MSI-H |  |
| Colorectum | FAP |  |
| ∗Top 15 enriched GO BP terms are showed in the bar plot of each disease state in each tissue. Each row represents a significant GO biological process which is colored according to the -log10(p.adjust). |
| Page: 1 2 3 4 5 6 7 8 9 |
| GO ID | Tissue | Disease Stage | Description | Gene Ratio | Bg Ratio | pvalue | p.adjust | Count |
| GO:0006790 | Colorectum | AD | sulfur compound metabolic process | 101/3918 | 339/18723 | 6.46e-05 | 1.07e-03 | 101 |
| GO:0006575 | Colorectum | AD | cellular modified amino acid metabolic process | 59/3918 | 188/18723 | 4.80e-04 | 5.27e-03 | 59 |
| GO:0042398 | Colorectum | AD | cellular modified amino acid biosynthetic process | 18/3918 | 46/18723 | 3.67e-03 | 2.60e-02 | 18 |
| GO:00067901 | Colorectum | SER | sulfur compound metabolic process | 73/2897 | 339/18723 | 1.75e-03 | 1.81e-02 | 73 |
| GO:00423981 | Colorectum | MSS | cellular modified amino acid biosynthetic process | 20/3467 | 46/18723 | 8.26e-05 | 1.35e-03 | 20 |
| GO:00065751 | Colorectum | MSS | cellular modified amino acid metabolic process | 55/3467 | 188/18723 | 2.16e-04 | 3.01e-03 | 55 |
| GO:00067902 | Colorectum | MSS | sulfur compound metabolic process | 85/3467 | 339/18723 | 1.52e-03 | 1.39e-02 | 85 |
| GO:0046394 | Colorectum | MSS | carboxylic acid biosynthetic process | 76/3467 | 314/18723 | 6.71e-03 | 4.38e-02 | 76 |
| GO:0016053 | Colorectum | MSS | organic acid biosynthetic process | 76/3467 | 316/18723 | 7.88e-03 | 4.84e-02 | 76 |
| GO:00423983 | Colorectum | FAP | cellular modified amino acid biosynthetic process | 13/2622 | 46/18723 | 8.71e-03 | 4.98e-02 | 13 |
| GO:00067906 | Esophagus | ESCC | sulfur compound metabolic process | 201/8552 | 339/18723 | 2.64e-07 | 3.94e-06 | 201 |
| GO:00442725 | Esophagus | ESCC | sulfur compound biosynthetic process | 96/8552 | 148/18723 | 1.86e-06 | 2.16e-05 | 96 |
| GO:00065757 | Esophagus | ESCC | cellular modified amino acid metabolic process | 112/8552 | 188/18723 | 8.31e-05 | 6.06e-04 | 112 |
| GO:00423986 | Esophagus | ESCC | cellular modified amino acid biosynthetic process | 34/8552 | 46/18723 | 9.39e-05 | 6.70e-04 | 34 |
| GO:00463948 | Esophagus | ESCC | carboxylic acid biosynthetic process | 175/8552 | 314/18723 | 1.98e-04 | 1.26e-03 | 175 |
| GO:00160538 | Esophagus | ESCC | organic acid biosynthetic process | 175/8552 | 316/18723 | 3.04e-04 | 1.82e-03 | 175 |
| GO:000674912 | Esophagus | ESCC | glutathione metabolic process | 42/8552 | 64/18723 | 1.01e-03 | 5.12e-03 | 42 |
| GO:001605312 | Liver | Cirrhotic | organic acid biosynthetic process | 139/4634 | 316/18723 | 4.28e-14 | 3.83e-12 | 139 |
| GO:004639412 | Liver | Cirrhotic | carboxylic acid biosynthetic process | 137/4634 | 314/18723 | 1.40e-13 | 1.14e-11 | 137 |
| GO:000679011 | Liver | Cirrhotic | sulfur compound metabolic process | 129/4634 | 339/18723 | 3.06e-08 | 1.04e-06 | 129 |
| Page: 1 2 |
| Pathway ID | Tissue | Disease Stage | Description | Gene Ratio | Bg Ratio | pvalue | p.adjust | qvalue | Count |
| hsa00480 | Colorectum | AD | Glutathione metabolism | 23/2092 | 57/8465 | 6.52e-03 | 2.76e-02 | 1.76e-02 | 23 |
| hsa004801 | Colorectum | AD | Glutathione metabolism | 23/2092 | 57/8465 | 6.52e-03 | 2.76e-02 | 1.76e-02 | 23 |
| hsa0048018 | Esophagus | ESCC | Glutathione metabolism | 44/4205 | 57/8465 | 1.81e-05 | 9.03e-05 | 4.63e-05 | 44 |
| hsa0048019 | Esophagus | ESCC | Glutathione metabolism | 44/4205 | 57/8465 | 1.81e-05 | 9.03e-05 | 4.63e-05 | 44 |
| hsa004809 | Liver | Cirrhotic | Glutathione metabolism | 30/2530 | 57/8465 | 2.63e-04 | 1.72e-03 | 1.06e-03 | 30 |
| hsa0048012 | Liver | Cirrhotic | Glutathione metabolism | 30/2530 | 57/8465 | 2.63e-04 | 1.72e-03 | 1.06e-03 | 30 |
| hsa0048022 | Liver | HCC | Glutathione metabolism | 42/4020 | 57/8465 | 5.00e-05 | 2.62e-04 | 1.46e-04 | 42 |
| hsa0048032 | Liver | HCC | Glutathione metabolism | 42/4020 | 57/8465 | 5.00e-05 | 2.62e-04 | 1.46e-04 | 42 |
| Page: 1 |
Top |
Cell-cell communication analysis |
| Identification of potential cell-cell interactions between two cell types and their ligand-receptor pairs for different disease states |
| Ligand | Receptor | LRpair | Pathway | Tissue | Disease Stage |
| Page: 1 |
Top |
Single-cell gene regulatory network inference analysis |
| Find out the significant the regulons (TFs) and the target genes of each regulon across cell types for different disease states |
| TF | Cell Type | Tissue | Disease Stage | Target Gene | RSS | Regulon Activity |
| ∗The dot plots of a searched regulon are shown for all cell subpopulations in each disease state of each tissue based on the regulon specific score inferred using pySCENIC and by calculating the average expression. |
| Page: 1 |
Top |
Somatic mutation of malignant transformation related genes |
| Annotation of somatic variants for genes involved in malignant transformation |
| Hugo Symbol | Variant Class | Variant Classification | dbSNP RS | HGVSc | HGVSp | HGVSp Short | SWISSPROT | BIOTYPE | SIFT | PolyPhen | Tumor Sample Barcode | Tissue | Histology | Sex | Age | Stage | Therapy Types | Drugs | Outcome |
| GGT6 | insertion | Nonsense_Mutation | novel | c.1165_1166insAGGGTGACCAGTAGCAGTTCCCCTCCCCTGCCATTGTAAAA | p.Gly389GlufsTer5 | p.G389Efs*5 | protein_coding | TCGA-BH-A0B8-01 | Breast | breast invasive carcinoma | Female | <65 | I/II | Hormone Therapy | arimidex | SD | |||
| GGT6 | SNV | Missense_Mutation | novel | c.1198N>T | p.Thr400Ser | p.T400S | protein_coding | tolerated(0.17) | benign(0.003) | TCGA-DS-A1OB-01 | Cervix | cervical & endocervical cancer | Female | <65 | I/II | Chemotherapy | carboplatin | PD | |
| GGT6 | SNV | Missense_Mutation | novel | c.460N>A | p.Ala154Thr | p.A154T | protein_coding | deleterious(0.04) | possibly_damaging(0.523) | TCGA-VS-A957-01 | Cervix | cervical & endocervical cancer | Female | <65 | I/II | Chemotherapy | cisplatin | CR | |
| GGT6 | insertion | Frame_Shift_Ins | novel | c.1198_1199insGG | p.Thr400ArgfsTer38 | p.T400Rfs*38 | protein_coding | TCGA-DS-A1OB-01 | Cervix | cervical & endocervical cancer | Female | <65 | I/II | Chemotherapy | carboplatin | PD | |||
| GGT6 | SNV | Missense_Mutation | novel | c.911C>T | p.Ala304Val | p.A304V | protein_coding | tolerated(0.18) | possibly_damaging(0.519) | TCGA-AA-3947-01 | Colorectum | colon adenocarcinoma | Female | <65 | I/II | Unknown | Unknown | SD | |
| GGT6 | SNV | Missense_Mutation | rs762142364 | c.1450G>A | p.Ala484Thr | p.A484T | protein_coding | tolerated(0.1) | benign(0.078) | TCGA-AM-5821-01 | Colorectum | colon adenocarcinoma | Female | >=65 | I/II | Unknown | Unknown | SD | |
| GGT6 | SNV | Missense_Mutation | c.1478N>A | p.Cys493Tyr | p.C493Y | protein_coding | deleterious(0.03) | probably_damaging(0.998) | TCGA-AZ-6601-01 | Colorectum | colon adenocarcinoma | Male | >=65 | I/II | Unknown | Unknown | PD | ||
| GGT6 | SNV | Missense_Mutation | c.758C>T | p.Ala253Val | p.A253V | protein_coding | tolerated(0.1) | possibly_damaging(0.637) | TCGA-CK-4951-01 | Colorectum | colon adenocarcinoma | Female | >=65 | I/II | Unknown | Unknown | PD | ||
| GGT6 | SNV | Missense_Mutation | novel | c.923N>A | p.Pro308His | p.P308H | protein_coding | tolerated(0.07) | benign(0.067) | TCGA-A5-A0G1-01 | Endometrium | uterine corpus endometrioid carcinoma | Female | >=65 | I/II | Unknown | Unknown | SD | |
| GGT6 | SNV | Missense_Mutation | novel | c.1372N>A | p.Gly458Ser | p.G458S | protein_coding | tolerated(0.4) | benign(0.149) | TCGA-A5-A0GG-01 | Endometrium | uterine corpus endometrioid carcinoma | Female | >=65 | I/II | Unknown | Unknown | SD |
| Page: 1 2 3 4 |
Top |
Related drugs of malignant transformation related genes |
| Identification of chemicals and drugs interact with genes involved in malignant transfromation |
| (DGIdb 4.0) |
| Entrez ID | Symbol | Category | Interaction Types | Drug Claim Name | Drug Name | PMIDs |
| Page: 1 |

Copyright 2023-Present -The University of Texas Health Science Center at Houston |