
|
|||||
|
 | |
| |
| |
| |
| |
| |
|
Gene: GGT5 |
Gene summary for GGT5 |
| Gene information | Species | Human | Gene symbol | GGT5 | Gene ID | 2687 |
| Gene name | gamma-glutamyltransferase 5 | |
| Gene Alias | GGL | |
| Cytomap | 22q11.23 | |
| Gene Type | protein-coding | GO ID | GO:0000003 | UniProtAcc | P36269 |
Top |
Malignant transformation analysis |
| Identification of the aberrant gene expression in precancerous and cancerous lesions by comparing the gene expression of stem-like cells in diseased tissues with normal stem cells |
| Entrez ID | Symbol | Replicates | Species | Organ | Tissue | Adj P-value | Log2FC | Malignancy |
| 2687 | GGT5 | RNA-P6T2-P6T2-1 | Human | Lung | IAC | 2.30e-07 | 3.32e-01 | -0.0166 |
| 2687 | GGT5 | RNA-P6T2-P6T2-2 | Human | Lung | IAC | 1.72e-06 | 2.95e-01 | -0.0132 |
| 2687 | GGT5 | RNA-P6T2-P6T2-3 | Human | Lung | IAC | 2.27e-07 | 2.80e-01 | -0.013 |
| 2687 | GGT5 | RNA-P6T2-P6T2-4 | Human | Lung | IAC | 1.59e-06 | 3.14e-01 | -0.0121 |
| 2687 | GGT5 | RNA-P7T1-P7T1-2 | Human | Lung | AIS | 1.33e-07 | 6.76e-01 | -0.0876 |
| 2687 | GGT5 | RNA-P7T1-P7T1-3 | Human | Lung | AIS | 1.43e-04 | 6.34e-01 | -0.0822 |
| 2687 | GGT5 | RNA-P7T1-P7T1-4 | Human | Lung | AIS | 1.05e-04 | 5.52e-01 | -0.0809 |
| 2687 | GGT5 | male-WTA | Human | Thyroid | PTC | 5.51e-30 | 3.22e-01 | 0.1037 |
| 2687 | GGT5 | PTC01 | Human | Thyroid | PTC | 1.22e-13 | 2.73e-01 | 0.1899 |
| 2687 | GGT5 | PTC04 | Human | Thyroid | PTC | 2.55e-18 | 5.06e-01 | 0.1927 |
| 2687 | GGT5 | PTC06 | Human | Thyroid | PTC | 2.71e-23 | 7.53e-01 | 0.2057 |
| 2687 | GGT5 | PTC07 | Human | Thyroid | PTC | 3.35e-32 | 5.40e-01 | 0.2044 |
| 2687 | GGT5 | ATC11 | Human | Thyroid | ATC | 5.73e-04 | 5.26e-01 | 0.3386 |
| 2687 | GGT5 | ATC13 | Human | Thyroid | ATC | 8.67e-36 | 8.63e-01 | 0.34 |
| 2687 | GGT5 | ATC2 | Human | Thyroid | ATC | 1.67e-03 | 4.29e-01 | 0.34 |
| 2687 | GGT5 | ATC3 | Human | Thyroid | ATC | 1.21e-05 | 4.28e-01 | 0.338 |
| 2687 | GGT5 | ATC4 | Human | Thyroid | ATC | 6.02e-03 | 7.65e-02 | 0.34 |
| 2687 | GGT5 | ATC5 | Human | Thyroid | ATC | 4.94e-41 | 9.29e-01 | 0.34 |
| Page: 1 |
| Tissue | Expression Dynamics | Abbreviation |
| Lung | 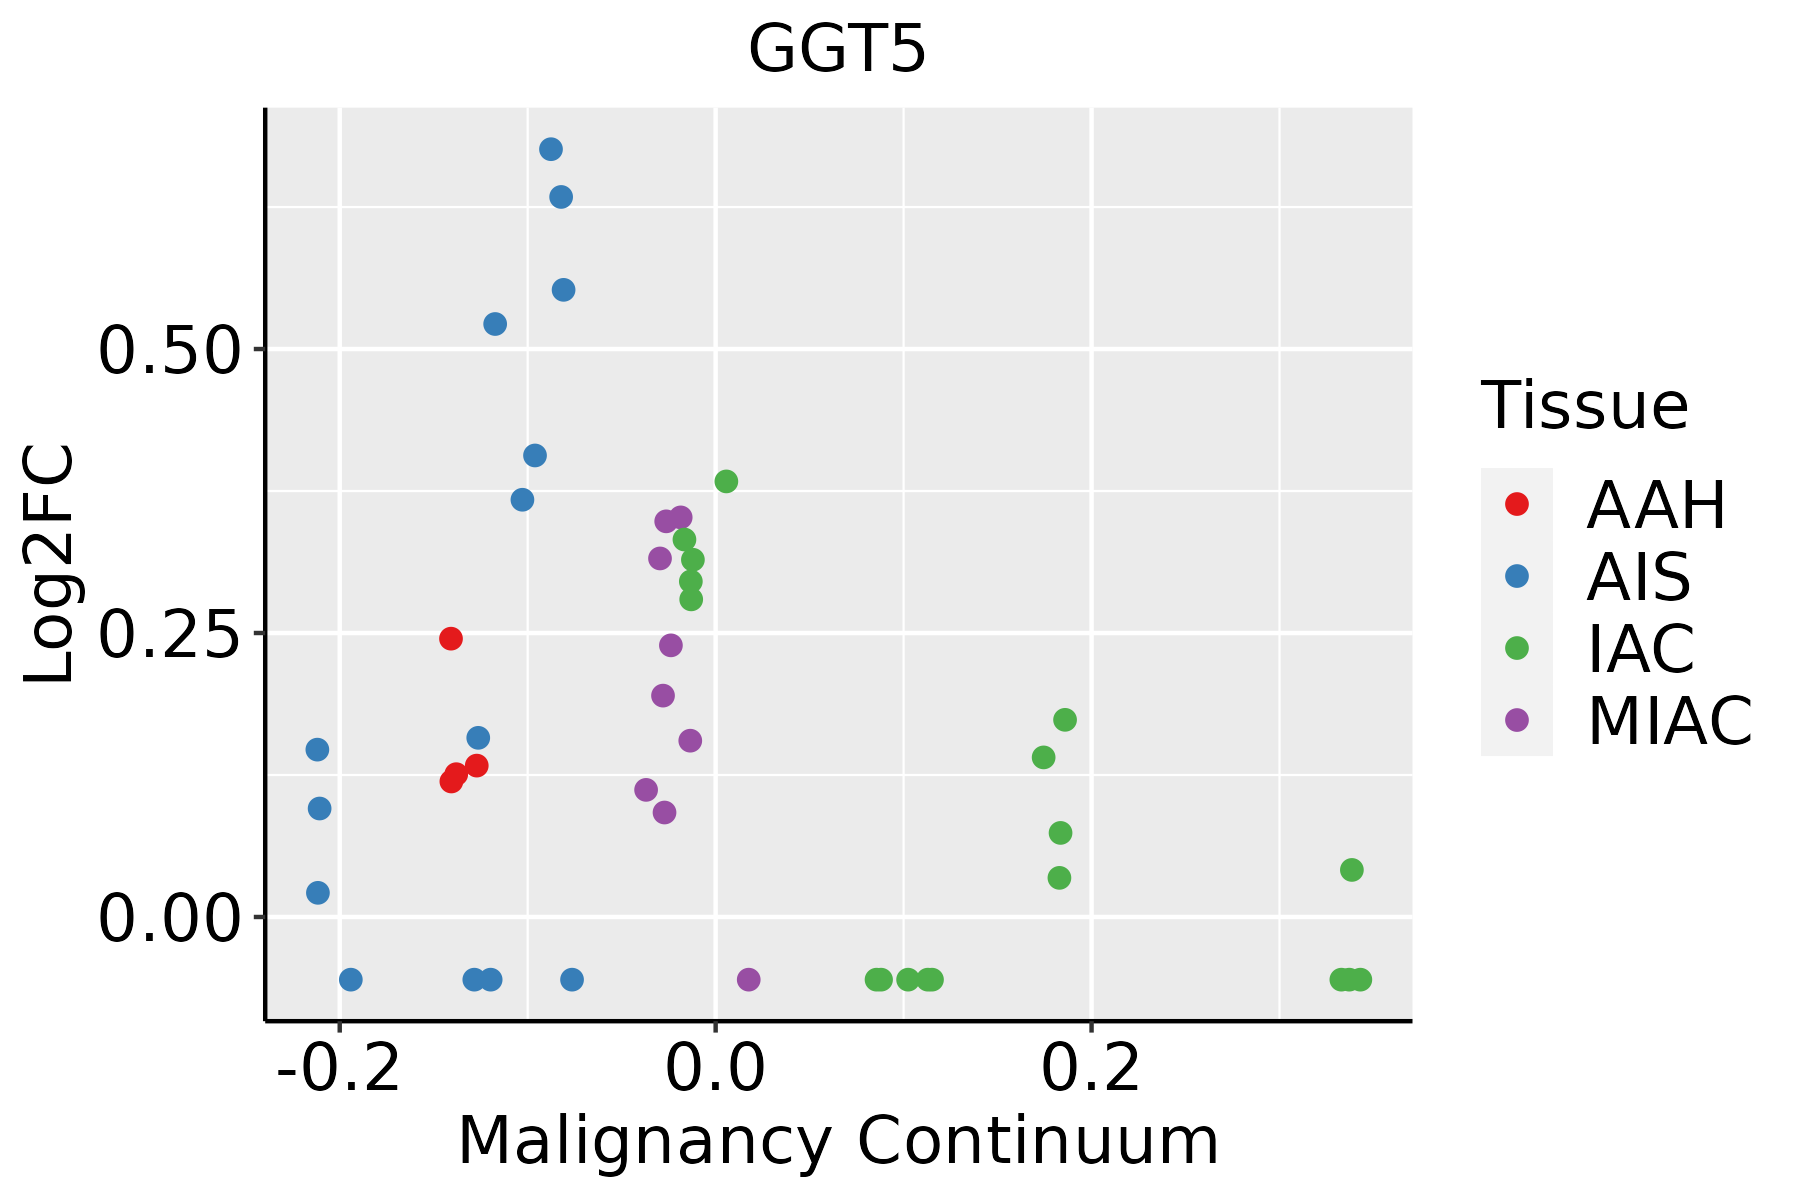 | AAH: Atypical adenomatous hyperplasia |
| AIS: Adenocarcinoma in situ | ||
| IAC: Invasive lung adenocarcinoma | ||
| MIA: Minimally invasive adenocarcinoma | ||
| Thyroid | 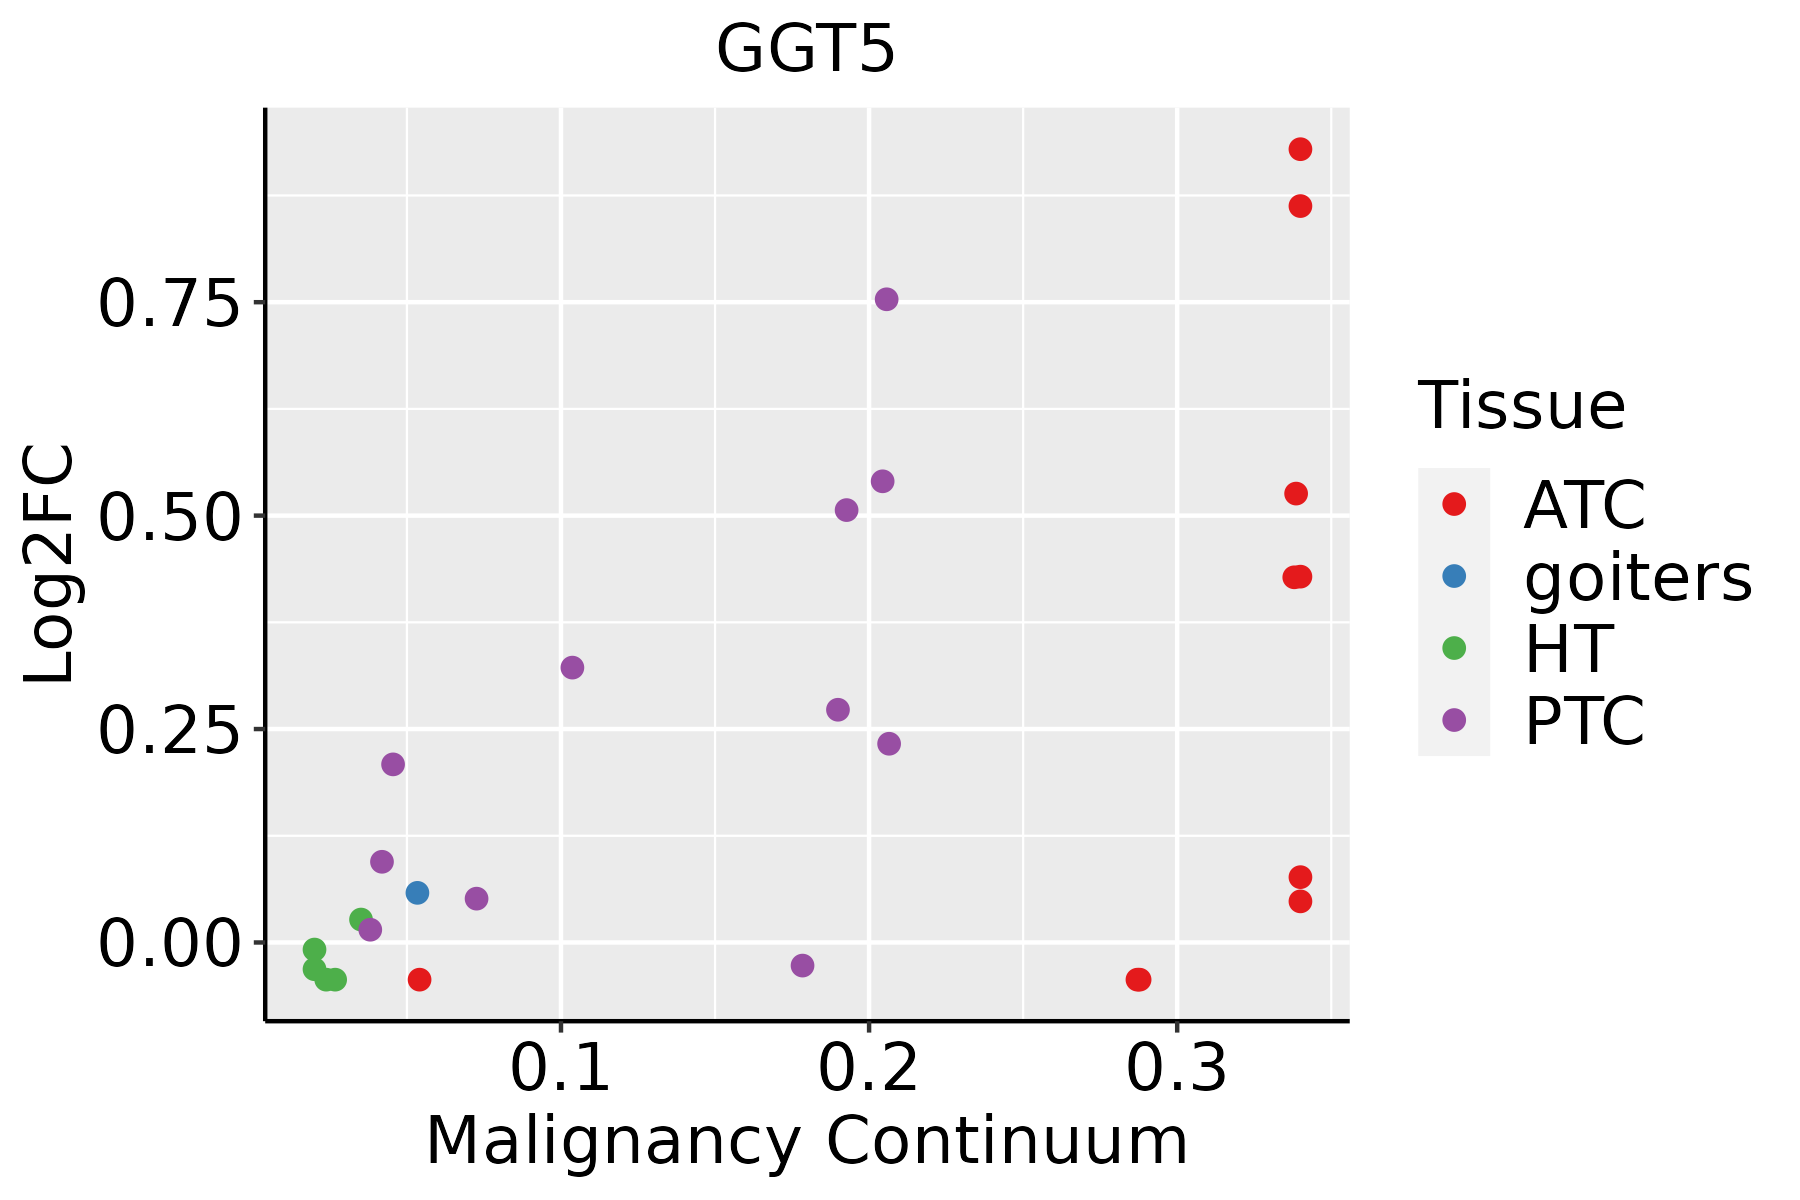 | ATC: Anaplastic thyroid cancer |
| HT: Hashimoto's thyroiditis | ||
| PTC: Papillary thyroid cancer |
| ∗log2FC in expression of this searched gene in stem-like cells from each diseased tissue sample relative to stem-like cells in normal samples in each tissue plotted against the malignancy continuum. Samples are colored based on if they are from different disease stage. |
Top |
Malignant transformation related pathway analysis |
| Find out the enriched GO biological processes and KEGG pathways involved in transition from healthy to precancer to cancer |
| Tissue | Disease Stage | Enriched GO biological Processes |
| Colorectum | AD |  |
| Colorectum | SER |  |
| Colorectum | MSS |  |
| Colorectum | MSI-H |  |
| Colorectum | FAP |  |
| ∗Top 15 enriched GO BP terms are showed in the bar plot of each disease state in each tissue. Each row represents a significant GO biological process which is colored according to the -log10(p.adjust). |
| Page: 1 2 3 4 5 6 7 8 9 |
| GO ID | Tissue | Disease Stage | Description | Gene Ratio | Bg Ratio | pvalue | p.adjust | Count |
| GO:00346127 | Lung | IAC | response to tumor necrosis factor | 46/2061 | 253/18723 | 4.28e-04 | 6.37e-03 | 46 |
| GO:00323554 | Lung | IAC | response to estradiol | 27/2061 | 141/18723 | 2.89e-03 | 2.60e-02 | 27 |
| GO:00022377 | Lung | IAC | response to molecule of bacterial origin | 56/2061 | 363/18723 | 5.78e-03 | 4.21e-02 | 56 |
| GO:00324967 | Lung | IAC | response to lipopolysaccharide | 53/2061 | 343/18723 | 6.87e-03 | 4.75e-02 | 53 |
| GO:003235511 | Lung | AIS | response to estradiol | 25/1849 | 141/18723 | 2.78e-03 | 2.77e-02 | 25 |
| GO:003461212 | Lung | AIS | response to tumor necrosis factor | 39/1849 | 253/18723 | 3.40e-03 | 3.23e-02 | 39 |
| GO:000657513 | Thyroid | PTC | cellular modified amino acid metabolic process | 85/5968 | 188/18723 | 8.29e-05 | 7.01e-04 | 85 |
| GO:0034612111 | Thyroid | PTC | response to tumor necrosis factor | 109/5968 | 253/18723 | 1.08e-04 | 8.69e-04 | 109 |
| GO:004239813 | Thyroid | PTC | cellular modified amino acid biosynthetic process | 25/5968 | 46/18723 | 1.31e-03 | 7.43e-03 | 25 |
| GO:003235518 | Thyroid | PTC | response to estradiol | 62/5968 | 141/18723 | 1.67e-03 | 9.16e-03 | 62 |
| GO:00442726 | Thyroid | PTC | sulfur compound biosynthetic process | 63/5968 | 148/18723 | 3.91e-03 | 1.87e-02 | 63 |
| GO:003235519 | Thyroid | ATC | response to estradiol | 72/6293 | 141/18723 | 1.35e-05 | 1.29e-04 | 72 |
| GO:003461228 | Thyroid | ATC | response to tumor necrosis factor | 116/6293 | 253/18723 | 3.22e-05 | 2.68e-04 | 116 |
| GO:000657522 | Thyroid | ATC | cellular modified amino acid metabolic process | 82/6293 | 188/18723 | 2.60e-03 | 1.20e-02 | 82 |
| GO:004239822 | Thyroid | ATC | cellular modified amino acid biosynthetic process | 25/6293 | 46/18723 | 3.00e-03 | 1.36e-02 | 25 |
| GO:004427212 | Thyroid | ATC | sulfur compound biosynthetic process | 66/6293 | 148/18723 | 3.43e-03 | 1.53e-02 | 66 |
| Page: 1 |
| Pathway ID | Tissue | Disease Stage | Description | Gene Ratio | Bg Ratio | pvalue | p.adjust | qvalue | Count |
| Page: 1 |
Top |
Cell-cell communication analysis |
| Identification of potential cell-cell interactions between two cell types and their ligand-receptor pairs for different disease states |
| Ligand | Receptor | LRpair | Pathway | Tissue | Disease Stage |
| Page: 1 |
Top |
Single-cell gene regulatory network inference analysis |
| Find out the significant the regulons (TFs) and the target genes of each regulon across cell types for different disease states |
| TF | Cell Type | Tissue | Disease Stage | Target Gene | RSS | Regulon Activity |
| ∗The dot plots of a searched regulon are shown for all cell subpopulations in each disease state of each tissue based on the regulon specific score inferred using pySCENIC and by calculating the average expression. |
| Page: 1 |
Top |
Somatic mutation of malignant transformation related genes |
| Annotation of somatic variants for genes involved in malignant transformation |
| Hugo Symbol | Variant Class | Variant Classification | dbSNP RS | HGVSc | HGVSp | HGVSp Short | SWISSPROT | BIOTYPE | SIFT | PolyPhen | Tumor Sample Barcode | Tissue | Histology | Sex | Age | Stage | Therapy Types | Drugs | Outcome |
| GGT5 | SNV | Missense_Mutation | c.829N>T | p.Asp277Tyr | p.D277Y | P36269 | protein_coding | deleterious(0) | possibly_damaging(0.765) | TCGA-A1-A0SO-01 | Breast | breast invasive carcinoma | Female | >=65 | I/II | Chemotherapy | SD | ||
| GGT5 | SNV | Missense_Mutation | c.313N>C | p.Glu105Gln | p.E105Q | P36269 | protein_coding | deleterious(0.03) | benign(0.309) | TCGA-AC-A23H-01 | Breast | breast invasive carcinoma | Female | >=65 | I/II | Unknown | Unknown | PD | |
| GGT5 | SNV | Missense_Mutation | novel | c.95N>G | p.His32Arg | p.H32R | P36269 | protein_coding | tolerated(0.96) | benign(0.003) | TCGA-2W-A8YY-01 | Cervix | cervical & endocervical cancer | Female | <65 | I/II | Chemotherapy | cisplatin | CR |
| GGT5 | SNV | Missense_Mutation | rs759124656 | c.1301N>A | p.Arg434Gln | p.R434Q | P36269 | protein_coding | deleterious(0) | possibly_damaging(0.49) | TCGA-C5-A902-01 | Cervix | cervical & endocervical cancer | Female | <65 | I/II | Chemotherapy | cisplatin | SD |
| GGT5 | SNV | Missense_Mutation | novel | c.1556N>T | p.Ala519Val | p.A519V | P36269 | protein_coding | deleterious(0.02) | benign(0.142) | TCGA-EK-A3GJ-01 | Cervix | cervical & endocervical cancer | Female | <65 | I/II | Unknown | Unknown | SD |
| GGT5 | SNV | Missense_Mutation | novel | c.466N>T | p.Arg156Cys | p.R156C | P36269 | protein_coding | deleterious(0) | probably_damaging(0.953) | TCGA-VS-A9U6-01 | Cervix | cervical & endocervical cancer | Female | <65 | I/II | Chemotherapy | cisplatin | PD |
| GGT5 | SNV | Missense_Mutation | c.1756N>T | p.Gly586Cys | p.G586C | P36269 | protein_coding | deleterious(0) | probably_damaging(1) | TCGA-AD-6889-01 | Colorectum | colon adenocarcinoma | Male | >=65 | I/II | Chemotherapy | xeloda | PD | |
| GGT5 | SNV | Missense_Mutation | rs567555612 | c.584N>T | p.Ala195Val | p.A195V | P36269 | protein_coding | tolerated(0.27) | benign(0.067) | TCGA-AZ-4315-01 | Colorectum | colon adenocarcinoma | Male | <65 | I/II | Unknown | Unknown | SD |
| GGT5 | SNV | Missense_Mutation | rs749872439 | c.202N>A | p.Val68Met | p.V68M | P36269 | protein_coding | deleterious(0.03) | probably_damaging(0.93) | TCGA-AZ-6598-01 | Colorectum | colon adenocarcinoma | Female | >=65 | I/II | Unknown | Unknown | SD |
| GGT5 | SNV | Missense_Mutation | rs567555612 | c.584N>T | p.Ala195Val | p.A195V | P36269 | protein_coding | tolerated(0.27) | benign(0.067) | TCGA-AZ-6601-01 | Colorectum | colon adenocarcinoma | Male | >=65 | I/II | Unknown | Unknown | PD |
| Page: 1 2 3 4 5 6 7 |
Top |
Related drugs of malignant transformation related genes |
| Identification of chemicals and drugs interact with genes involved in malignant transfromation |
| (DGIdb 4.0) |
| Entrez ID | Symbol | Category | Interaction Types | Drug Claim Name | Drug Name | PMIDs |
| Page: 1 |

Copyright 2023-Present -The University of Texas Health Science Center at Houston |