
|
|||||
|
 | |
| |
| |
| |
| |
| |
|
Gene: GGPS1 |
Gene summary for GGPS1 |
| Gene information | Species | Human | Gene symbol | GGPS1 | Gene ID | 9453 |
| Gene name | geranylgeranyl diphosphate synthase 1 | |
| Gene Alias | GGPPS | |
| Cytomap | 1q42.3 | |
| Gene Type | protein-coding | GO ID | GO:0006629 | UniProtAcc | A0A024R3W4 |
Top |
Malignant transformation analysis |
| Identification of the aberrant gene expression in precancerous and cancerous lesions by comparing the gene expression of stem-like cells in diseased tissues with normal stem cells |
| Entrez ID | Symbol | Replicates | Species | Organ | Tissue | Adj P-value | Log2FC | Malignancy |
| 9453 | GGPS1 | LZE24T | Human | Esophagus | ESCC | 1.24e-02 | 8.07e-02 | 0.0596 |
| 9453 | GGPS1 | P1T-E | Human | Esophagus | ESCC | 1.07e-04 | 3.01e-01 | 0.0875 |
| 9453 | GGPS1 | P2T-E | Human | Esophagus | ESCC | 4.99e-21 | 4.00e-01 | 0.1177 |
| 9453 | GGPS1 | P4T-E | Human | Esophagus | ESCC | 1.26e-15 | 3.51e-01 | 0.1323 |
| 9453 | GGPS1 | P5T-E | Human | Esophagus | ESCC | 2.64e-27 | 4.60e-01 | 0.1327 |
| 9453 | GGPS1 | P8T-E | Human | Esophagus | ESCC | 1.42e-23 | 3.55e-01 | 0.0889 |
| 9453 | GGPS1 | P9T-E | Human | Esophagus | ESCC | 9.59e-09 | 2.93e-01 | 0.1131 |
| 9453 | GGPS1 | P10T-E | Human | Esophagus | ESCC | 1.79e-48 | 9.24e-01 | 0.116 |
| 9453 | GGPS1 | P11T-E | Human | Esophagus | ESCC | 2.41e-11 | 5.22e-01 | 0.1426 |
| 9453 | GGPS1 | P12T-E | Human | Esophagus | ESCC | 5.00e-19 | 3.25e-01 | 0.1122 |
| 9453 | GGPS1 | P15T-E | Human | Esophagus | ESCC | 4.69e-24 | 3.75e-01 | 0.1149 |
| 9453 | GGPS1 | P16T-E | Human | Esophagus | ESCC | 4.90e-34 | 5.91e-01 | 0.1153 |
| 9453 | GGPS1 | P17T-E | Human | Esophagus | ESCC | 1.57e-03 | 2.32e-01 | 0.1278 |
| 9453 | GGPS1 | P19T-E | Human | Esophagus | ESCC | 4.26e-11 | 5.76e-01 | 0.1662 |
| 9453 | GGPS1 | P20T-E | Human | Esophagus | ESCC | 2.68e-16 | 3.66e-01 | 0.1124 |
| 9453 | GGPS1 | P21T-E | Human | Esophagus | ESCC | 9.66e-47 | 7.65e-01 | 0.1617 |
| 9453 | GGPS1 | P22T-E | Human | Esophagus | ESCC | 1.19e-18 | 3.51e-01 | 0.1236 |
| 9453 | GGPS1 | P23T-E | Human | Esophagus | ESCC | 8.70e-25 | 5.12e-01 | 0.108 |
| 9453 | GGPS1 | P24T-E | Human | Esophagus | ESCC | 2.45e-19 | 3.42e-01 | 0.1287 |
| 9453 | GGPS1 | P26T-E | Human | Esophagus | ESCC | 5.39e-26 | 4.13e-01 | 0.1276 |
| Page: 1 2 3 4 5 |
| Tissue | Expression Dynamics | Abbreviation |
| Esophagus |  | ESCC: Esophageal squamous cell carcinoma |
| HGIN: High-grade intraepithelial neoplasias | ||
| LGIN: Low-grade intraepithelial neoplasias | ||
| Liver |  | HCC: Hepatocellular carcinoma |
| NAFLD: Non-alcoholic fatty liver disease | ||
| Oral Cavity |  | EOLP: Erosive Oral lichen planus |
| LP: leukoplakia | ||
| NEOLP: Non-erosive oral lichen planus | ||
| OSCC: Oral squamous cell carcinoma | ||
| Prostate |  | BPH: Benign Prostatic Hyperplasia |
| Skin | 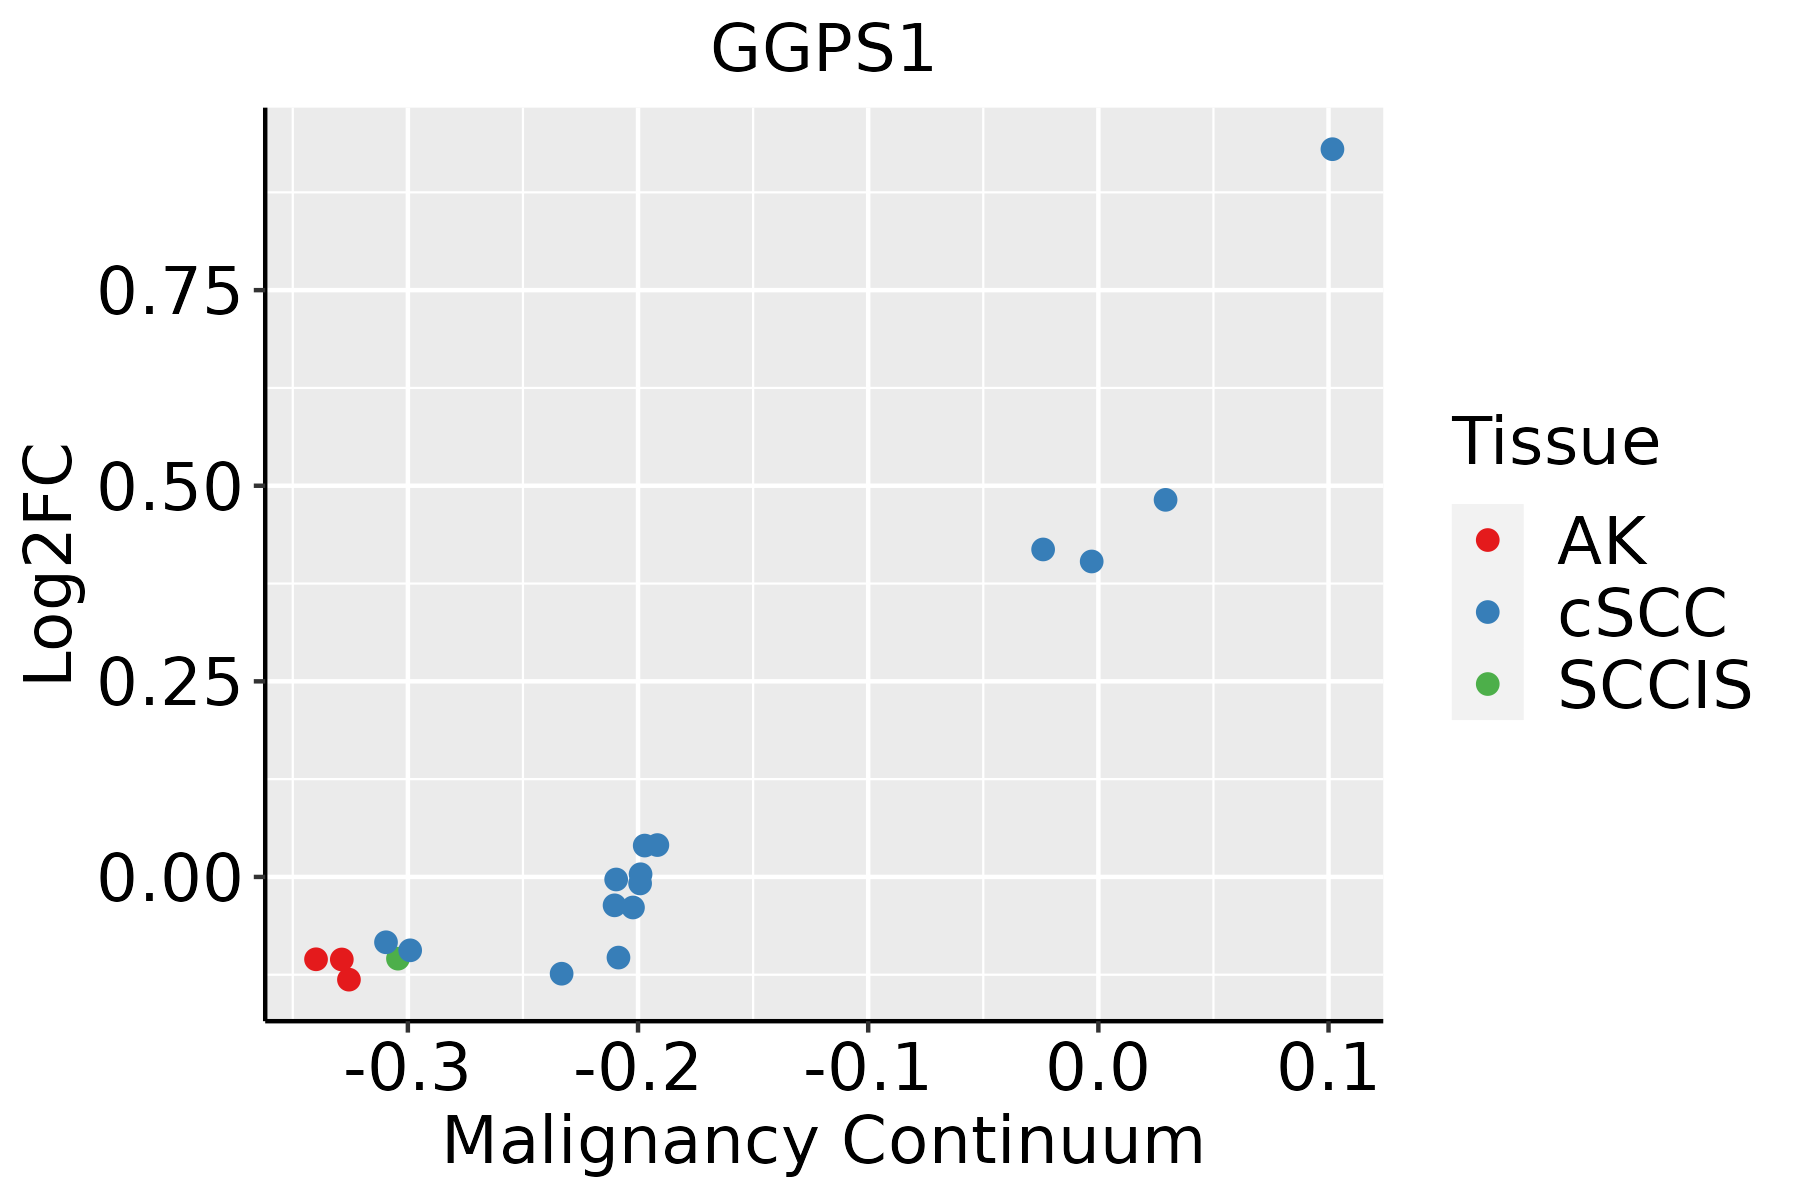 | AK: Actinic keratosis |
| cSCC: Cutaneous squamous cell carcinoma | ||
| SCCIS:squamous cell carcinoma in situ |
| ∗log2FC in expression of this searched gene in stem-like cells from each diseased tissue sample relative to stem-like cells in normal samples in each tissue plotted against the malignancy continuum. Samples are colored based on if they are from different disease stage. |
Top |
Malignant transformation related pathway analysis |
| Find out the enriched GO biological processes and KEGG pathways involved in transition from healthy to precancer to cancer |
| Tissue | Disease Stage | Enriched GO biological Processes |
| Colorectum | AD |  |
| Colorectum | SER |  |
| Colorectum | MSS |  |
| Colorectum | MSI-H |  |
| Colorectum | FAP |  |
| ∗Top 15 enriched GO BP terms are showed in the bar plot of each disease state in each tissue. Each row represents a significant GO biological process which is colored according to the -log10(p.adjust). |
| Page: 1 2 3 4 5 6 7 8 9 |
| GO ID | Tissue | Disease Stage | Description | Gene Ratio | Bg Ratio | pvalue | p.adjust | Count |
| GO:00086544 | Esophagus | ESCC | phospholipid biosynthetic process | 162/8552 | 253/18723 | 2.59e-09 | 5.73e-08 | 162 |
| GO:00066446 | Esophagus | ESCC | phospholipid metabolic process | 218/8552 | 383/18723 | 5.37e-06 | 5.59e-05 | 218 |
| GO:00082991 | Esophagus | ESCC | isoprenoid biosynthetic process | 21/8552 | 28/18723 | 1.57e-03 | 7.33e-03 | 21 |
| GO:00067202 | Liver | Cirrhotic | isoprenoid metabolic process | 46/4634 | 116/18723 | 2.71e-04 | 2.41e-03 | 46 |
| GO:00067212 | Liver | Cirrhotic | terpenoid metabolic process | 38/4634 | 97/18723 | 1.16e-03 | 7.89e-03 | 38 |
| GO:00086542 | Liver | HCC | phospholipid biosynthetic process | 150/7958 | 253/18723 | 4.77e-08 | 1.03e-06 | 150 |
| GO:00066444 | Liver | HCC | phospholipid metabolic process | 214/7958 | 383/18723 | 7.25e-08 | 1.48e-06 | 214 |
| GO:000672011 | Liver | HCC | isoprenoid metabolic process | 65/7958 | 116/18723 | 2.23e-03 | 1.11e-02 | 65 |
| GO:00086543 | Oral cavity | OSCC | phospholipid biosynthetic process | 130/7305 | 253/18723 | 3.96e-05 | 3.46e-04 | 130 |
| GO:0008299 | Oral cavity | OSCC | isoprenoid biosynthetic process | 20/7305 | 28/18723 | 5.13e-04 | 2.99e-03 | 20 |
| GO:00066445 | Oral cavity | OSCC | phospholipid metabolic process | 175/7305 | 383/18723 | 4.21e-03 | 1.71e-02 | 175 |
| GO:00067203 | Oral cavity | OSCC | isoprenoid metabolic process | 59/7305 | 116/18723 | 6.18e-03 | 2.33e-02 | 59 |
| Page: 1 |
| Pathway ID | Tissue | Disease Stage | Description | Gene Ratio | Bg Ratio | pvalue | p.adjust | qvalue | Count |
| hsa009005 | Esophagus | ESCC | Terpenoid backbone biosynthesis | 20/4205 | 23/8465 | 2.14e-04 | 7.87e-04 | 4.03e-04 | 20 |
| hsa0090012 | Esophagus | ESCC | Terpenoid backbone biosynthesis | 20/4205 | 23/8465 | 2.14e-04 | 7.87e-04 | 4.03e-04 | 20 |
| hsa00900 | Liver | HCC | Terpenoid backbone biosynthesis | 17/4020 | 23/8465 | 9.26e-03 | 2.46e-02 | 1.37e-02 | 17 |
| hsa009001 | Liver | HCC | Terpenoid backbone biosynthesis | 17/4020 | 23/8465 | 9.26e-03 | 2.46e-02 | 1.37e-02 | 17 |
| hsa009004 | Oral cavity | OSCC | Terpenoid backbone biosynthesis | 19/3704 | 23/8465 | 1.55e-04 | 5.34e-04 | 2.72e-04 | 19 |
| hsa0090011 | Oral cavity | OSCC | Terpenoid backbone biosynthesis | 19/3704 | 23/8465 | 1.55e-04 | 5.34e-04 | 2.72e-04 | 19 |
| hsa009002 | Oral cavity | LP | Terpenoid backbone biosynthesis | 12/2418 | 23/8465 | 1.43e-02 | 4.59e-02 | 2.96e-02 | 12 |
| hsa009003 | Oral cavity | LP | Terpenoid backbone biosynthesis | 12/2418 | 23/8465 | 1.43e-02 | 4.59e-02 | 2.96e-02 | 12 |
| Page: 1 |
Top |
Cell-cell communication analysis |
| Identification of potential cell-cell interactions between two cell types and their ligand-receptor pairs for different disease states |
| Ligand | Receptor | LRpair | Pathway | Tissue | Disease Stage |
| Page: 1 |
Top |
Single-cell gene regulatory network inference analysis |
| Find out the significant the regulons (TFs) and the target genes of each regulon across cell types for different disease states |
| TF | Cell Type | Tissue | Disease Stage | Target Gene | RSS | Regulon Activity |
| ∗The dot plots of a searched regulon are shown for all cell subpopulations in each disease state of each tissue based on the regulon specific score inferred using pySCENIC and by calculating the average expression. |
| Page: 1 |
Top |
Somatic mutation of malignant transformation related genes |
| Annotation of somatic variants for genes involved in malignant transformation |
| Hugo Symbol | Variant Class | Variant Classification | dbSNP RS | HGVSc | HGVSp | HGVSp Short | SWISSPROT | BIOTYPE | SIFT | PolyPhen | Tumor Sample Barcode | Tissue | Histology | Sex | Age | Stage | Therapy Types | Drugs | Outcome |
| GGPS1 | SNV | Missense_Mutation | c.754G>A | p.Glu252Lys | p.E252K | O95749 | protein_coding | tolerated(0.14) | benign(0.054) | TCGA-AC-A23H-01 | Breast | breast invasive carcinoma | Female | >=65 | I/II | Unknown | Unknown | PD | |
| GGPS1 | SNV | Missense_Mutation | rs752833128 | c.29G>T | p.Arg10Ile | p.R10I | O95749 | protein_coding | deleterious(0.01) | benign(0.003) | TCGA-AN-A046-01 | Breast | breast invasive carcinoma | Female | >=65 | I/II | Unknown | Unknown | SD |
| GGPS1 | SNV | Missense_Mutation | c.229N>T | p.Pro77Ser | p.P77S | O95749 | protein_coding | deleterious(0) | probably_damaging(1) | TCGA-D8-A1JA-01 | Breast | breast invasive carcinoma | Female | <65 | III/IV | Chemotherapy | adriamycin | PD | |
| GGPS1 | SNV | Missense_Mutation | c.283N>A | p.Val95Met | p.V95M | O95749 | protein_coding | tolerated(0.06) | benign(0.231) | TCGA-F4-6808-01 | Colorectum | colon adenocarcinoma | Female | <65 | I/II | Unknown | Unknown | SD | |
| GGPS1 | SNV | Missense_Mutation | novel | c.636G>T | p.Lys212Asn | p.K212N | O95749 | protein_coding | deleterious(0) | probably_damaging(1) | TCGA-AG-A002-01 | Colorectum | rectum adenocarcinoma | Male | <65 | I/II | Unknown | Unknown | SD |
| GGPS1 | SNV | Missense_Mutation | novel | c.34C>A | p.Leu12Ile | p.L12I | O95749 | protein_coding | tolerated(0.26) | benign(0.179) | TCGA-F5-6814-01 | Colorectum | rectum adenocarcinoma | Male | <65 | I/II | Unknown | Unknown | SD |
| GGPS1 | SNV | Missense_Mutation | novel | c.833N>T | p.Arg278Leu | p.R278L | O95749 | protein_coding | tolerated(1) | benign(0) | TCGA-AP-A1DK-01 | Endometrium | uterine corpus endometrioid carcinoma | Female | <65 | I/II | Unknown | Unknown | SD |
| GGPS1 | SNV | Missense_Mutation | c.572C>A | p.Ala191Asp | p.A191D | O95749 | protein_coding | tolerated(0.49) | probably_damaging(0.958) | TCGA-B5-A11E-01 | Endometrium | uterine corpus endometrioid carcinoma | Female | <65 | I/II | Unknown | Unknown | SD | |
| GGPS1 | SNV | Missense_Mutation | novel | c.214N>A | p.Leu72Ile | p.L72I | O95749 | protein_coding | deleterious(0) | probably_damaging(0.995) | TCGA-B5-A1MR-01 | Endometrium | uterine corpus endometrioid carcinoma | Female | >=65 | III/IV | Unknown | Unknown | SD |
| GGPS1 | SNV | Missense_Mutation | rs752833128 | c.29N>T | p.Arg10Ile | p.R10I | O95749 | protein_coding | deleterious(0.01) | benign(0.003) | TCGA-BS-A0UF-01 | Endometrium | uterine corpus endometrioid carcinoma | Female | >=65 | I/II | Unknown | Unknown | SD |
| Page: 1 2 3 |
Top |
Related drugs of malignant transformation related genes |
| Identification of chemicals and drugs interact with genes involved in malignant transfromation |
| (DGIdb 4.0) |
| Entrez ID | Symbol | Category | Interaction Types | Drug Claim Name | Drug Name | PMIDs |
| 9453 | GGPS1 | DRUGGABLE GENOME, ENZYME | inhibitor | 135649698 | ||
| 9453 | GGPS1 | DRUGGABLE GENOME, ENZYME | inhibitor | 249565660 | ||
| 9453 | GGPS1 | DRUGGABLE GENOME, ENZYME | inhibitor | 135650200 | ||
| 9453 | GGPS1 | DRUGGABLE GENOME, ENZYME | inhibitor | 249565659 | CHEMBL411274 | |
| 9453 | GGPS1 | DRUGGABLE GENOME, ENZYME | inhibitor | 249565658 | CHEMBL259026 | |
| 9453 | GGPS1 | DRUGGABLE GENOME, ENZYME | inhibitor | 135651491 | ||
| 9453 | GGPS1 | DRUGGABLE GENOME, ENZYME | inhibitor | 249565661 | ||
| 9453 | GGPS1 | DRUGGABLE GENOME, ENZYME | DIGERANYL BISPHOSPHONATE | DIGERANYL BISPHOSPHONATE | 24726306 | |
| 9453 | GGPS1 | DRUGGABLE GENOME, ENZYME | inhibitor | 135650016 | ||
| 9453 | GGPS1 | DRUGGABLE GENOME, ENZYME | ZOLEDRONATE | ZOLEDRONIC ACID |
| Page: 1 2 3 |

Copyright 2023-Present -The University of Texas Health Science Center at Houston |