Schematic overview of the cellular and molecular mechanisms involved in the cancer progression, including the proposed cellular and molecular mechanisms in cancer cells trajectory. AT1: alveolar type 1 cells; AT2: alveolar type 2 cells; AAH: atypical adenomatous hyperplasia; AIS: adenocarcinoma in situ; MIA: minimally invasive adenocarcinoma; IA: invasive adenocarcinoma; EMT: epithelial-mesenchymal transition

Home

Download

Statistics

Help

Contact

Center for Computational Systems Medicine
leaf

Gene summary

leaf

Malignant transformation analysis

leaf

Malignant transformation related pathway analysis

leaf

Cell-cell communication analysis

leaf

Single-cell gene regulatory network inference analysis

leaf

Somatic mutation of malignant transformation related genes

leaf

Related drugs of malignant transformation related genes

Gene: GGNBP2

Gene summary for GGNBP2

check button Gene summary.

Gene informationSpeciesHuman
Gene symbol

GGNBP2

Gene ID

79893

Gene namegametogenetin binding protein 2
Gene AliasDIF-3
Cytomap17q12
Gene Typeprotein-coding
GO ID

GO:0000003

UniProtAcc

Q9H3C7


Top

Malignant transformation analysis

check button Identification of the aberrant gene expression in precancerous and cancerous lesions by comparing the gene expression of stem-like cells in diseased tissues with normal stem cells
check button Malignant transformation involving gene list.
Entrez IDSymbolReplicatesSpeciesOrganTissueAdj P-valueLog2FCMalignancy
79893GGNBP2HTA11_3410_2000001011HumanColorectumAD1.21e-09-5.63e-010.0155
79893GGNBP2HTA11_347_2000001011HumanColorectumAD1.07e-053.78e-01-0.1954
79893GGNBP2HTA11_866_3004761011HumanColorectumAD1.93e-06-5.34e-010.096
79893GGNBP2HTA11_10711_2000001011HumanColorectumAD3.31e-02-4.46e-010.0338
79893GGNBP2HTA11_7696_3000711011HumanColorectumAD7.69e-03-2.65e-010.0674
79893GGNBP2HTA11_99999970781_79442HumanColorectumMSS1.42e-03-2.80e-010.294
79893GGNBP2HTA11_99999971662_82457HumanColorectumMSS1.00e-02-3.18e-010.3859
79893GGNBP2HTA11_99999974143_84620HumanColorectumMSS3.08e-07-4.13e-010.3005
79893GGNBP2A002-C-010HumanColorectumFAP2.91e-07-3.14e-010.242
79893GGNBP2A001-C-207HumanColorectumFAP2.27e-02-2.41e-010.1278
79893GGNBP2A015-C-203HumanColorectumFAP9.77e-29-1.94e-01-0.1294
79893GGNBP2A015-C-204HumanColorectumFAP4.08e-052.71e-02-0.0228
79893GGNBP2A014-C-040HumanColorectumFAP3.04e-03-7.85e-02-0.1184
79893GGNBP2A002-C-201HumanColorectumFAP5.50e-10-2.23e-010.0324
79893GGNBP2A002-C-203HumanColorectumFAP2.86e-05-2.31e-010.2786
79893GGNBP2A001-C-119HumanColorectumFAP3.47e-134.14e-01-0.1557
79893GGNBP2A001-C-108HumanColorectumFAP5.72e-17-9.81e-02-0.0272
79893GGNBP2A002-C-205HumanColorectumFAP2.92e-231.57e-01-0.1236
79893GGNBP2A001-C-104HumanColorectumFAP1.31e-06-5.90e-020.0184
79893GGNBP2A015-C-005HumanColorectumFAP3.80e-03-1.94e-01-0.0336
Page: 1 2 3 4 5 6 7 8 9 

check button Transcriptomic changes along malignancy continuum.
TissueExpression DynamicsAbbreviation
Colorectum (GSE201348)The image shows the transcriptomic changes along malignancy continuum.log2FC in expression of this searched gene in stem-like cells from each diseased tissue sample relative to stem-like cells in normal samples in each tissue plotted against the malignancy continuum. Samples are colored based on if they are from different disease stage.FAP: Familial adenomatous polyposis
CRC: Colorectal cancer
Colorectum (HTA11)The image shows the transcriptomic changes along malignancy continuum.log2FC in expression of this searched gene in stem-like cells from each diseased tissue sample relative to stem-like cells in normal samples in each tissue plotted against the malignancy continuum. Samples are colored based on if they are from different disease stage.AD: Adenomas
SER: Sessile serrated lesions
MSI-H: Microsatellite-high colorectal cancer
MSS: Microsatellite stable colorectal cancer
EsophagusThe image shows the transcriptomic changes along malignancy continuum.log2FC in expression of this searched gene in stem-like cells from each diseased tissue sample relative to stem-like cells in normal samples in each tissue plotted against the malignancy continuum. Samples are colored based on if they are from different disease stage.
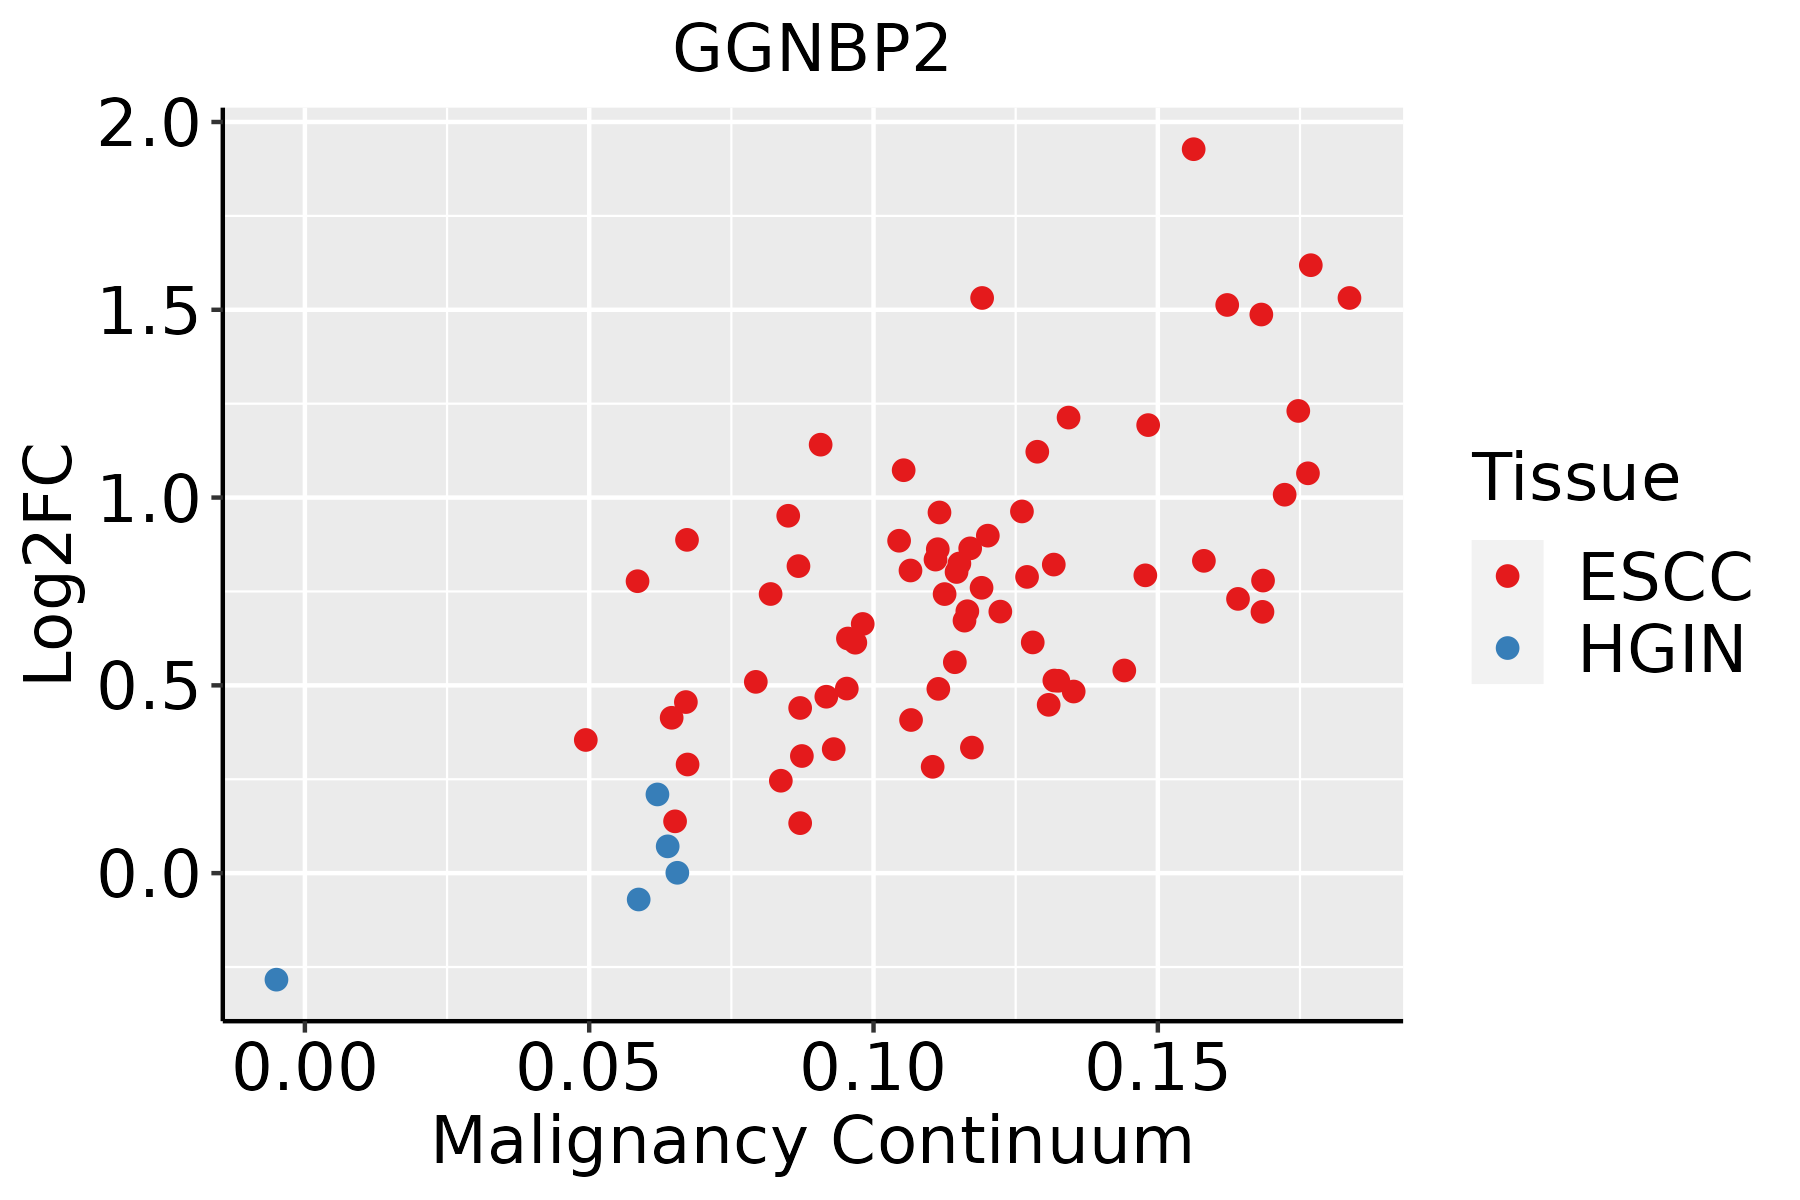
ESCC: Esophageal squamous cell carcinoma
HGIN: High-grade intraepithelial neoplasias
LGIN: Low-grade intraepithelial neoplasias
LiverThe image shows the transcriptomic changes along malignancy continuum.log2FC in expression of this searched gene in stem-like cells from each diseased tissue sample relative to stem-like cells in normal samples in each tissue plotted against the malignancy continuum. Samples are colored based on if they are from different disease stage.
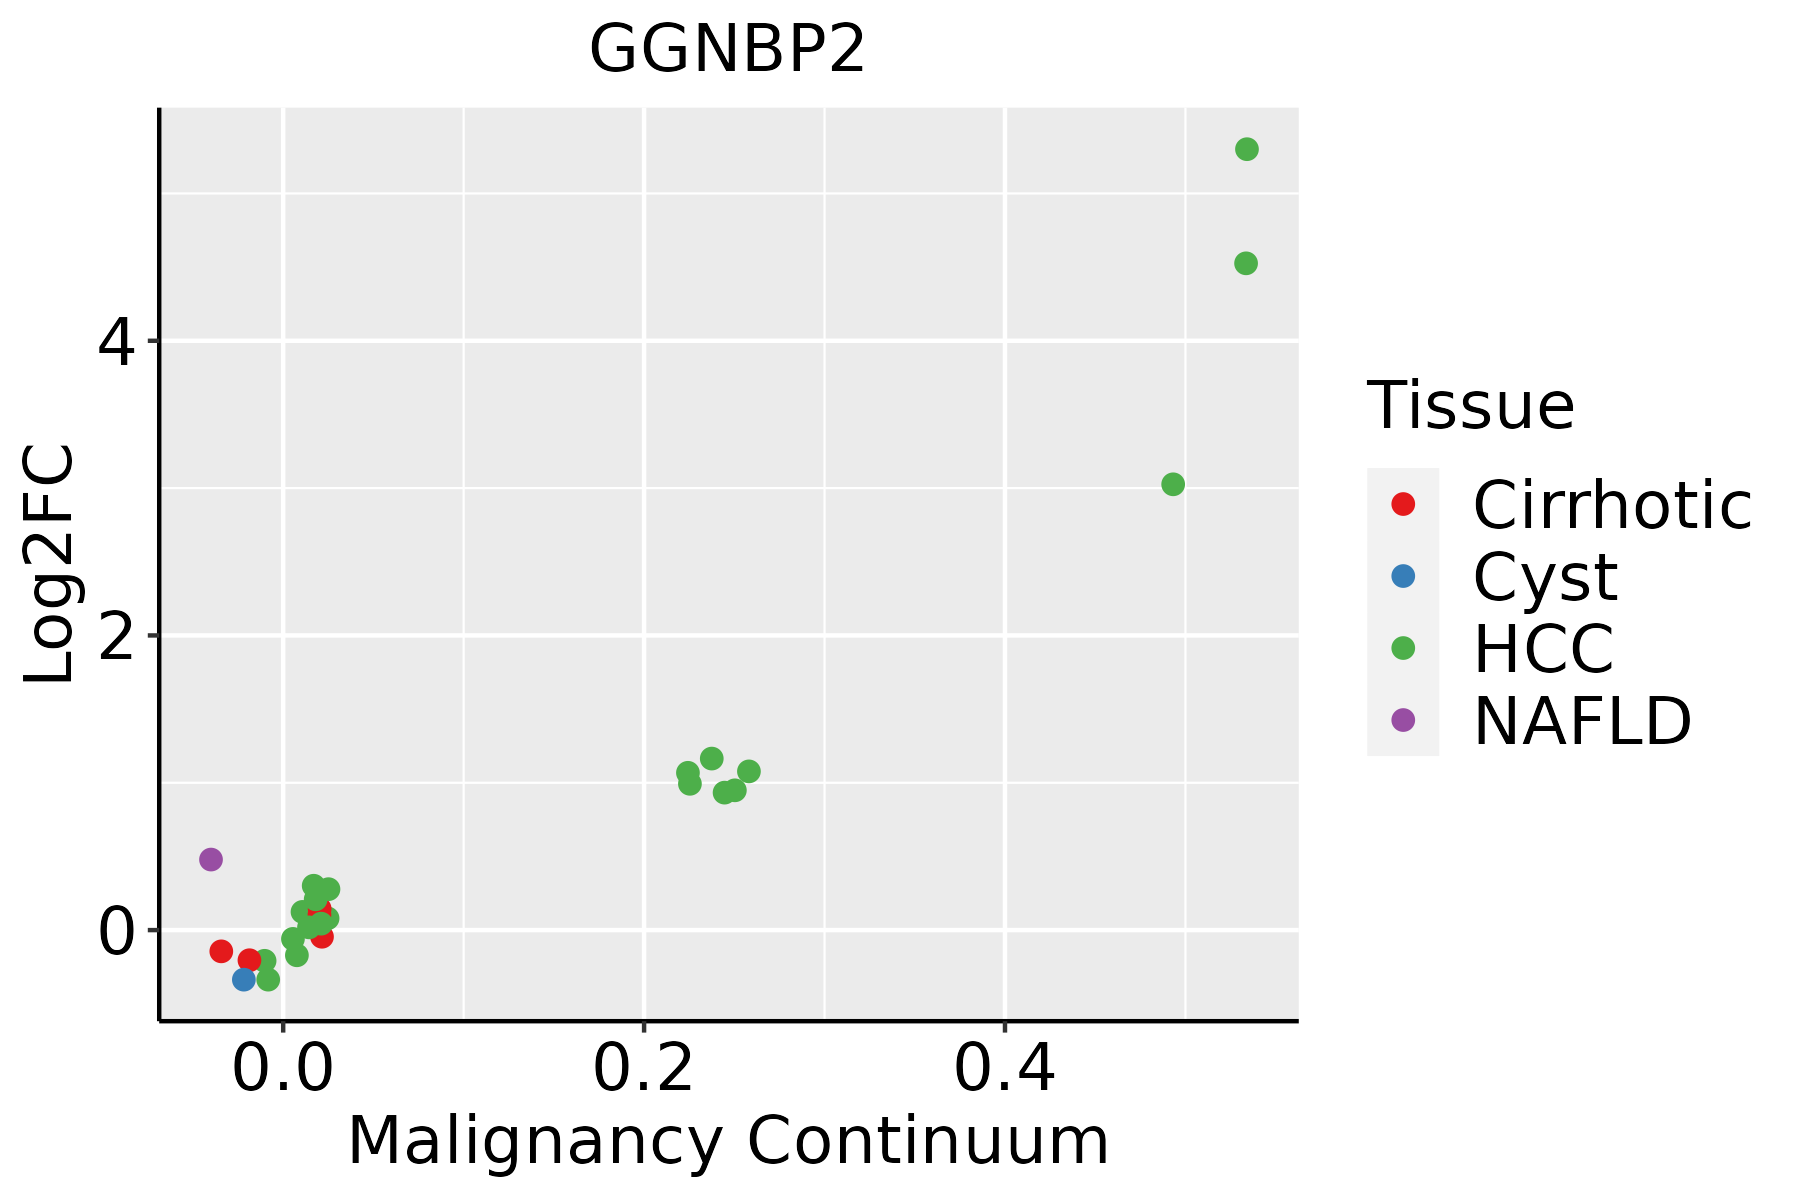
HCC: Hepatocellular carcinoma
NAFLD: Non-alcoholic fatty liver disease
Oral CavityThe image shows the transcriptomic changes along malignancy continuum.log2FC in expression of this searched gene in stem-like cells from each diseased tissue sample relative to stem-like cells in normal samples in each tissue plotted against the malignancy continuum. Samples are colored based on if they are from different disease stage.
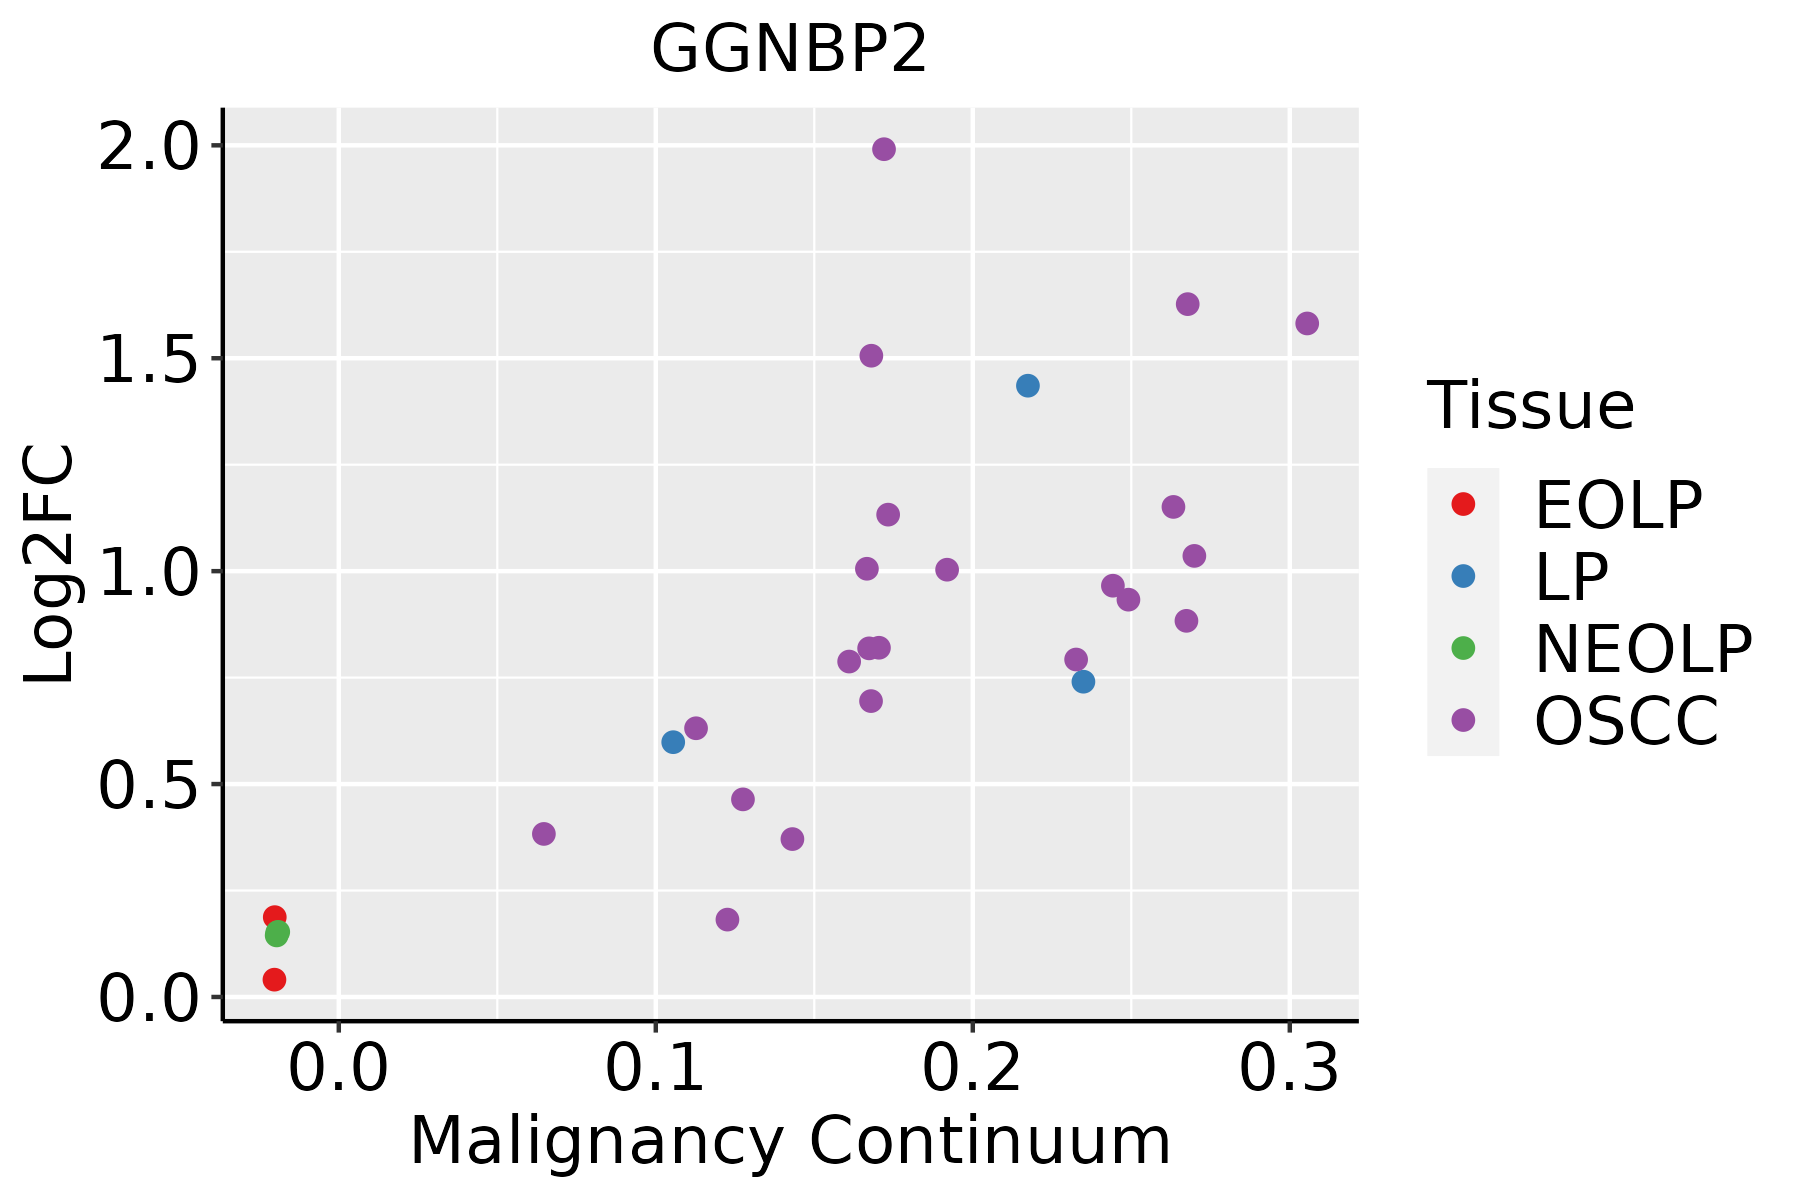
EOLP: Erosive Oral lichen planus
LP: leukoplakia
NEOLP: Non-erosive oral lichen planus
OSCC: Oral squamous cell carcinoma
SkinThe image shows the transcriptomic changes along malignancy continuum.log2FC in expression of this searched gene in stem-like cells from each diseased tissue sample relative to stem-like cells in normal samples in each tissue plotted against the malignancy continuum. Samples are colored based on if they are from different disease stage.
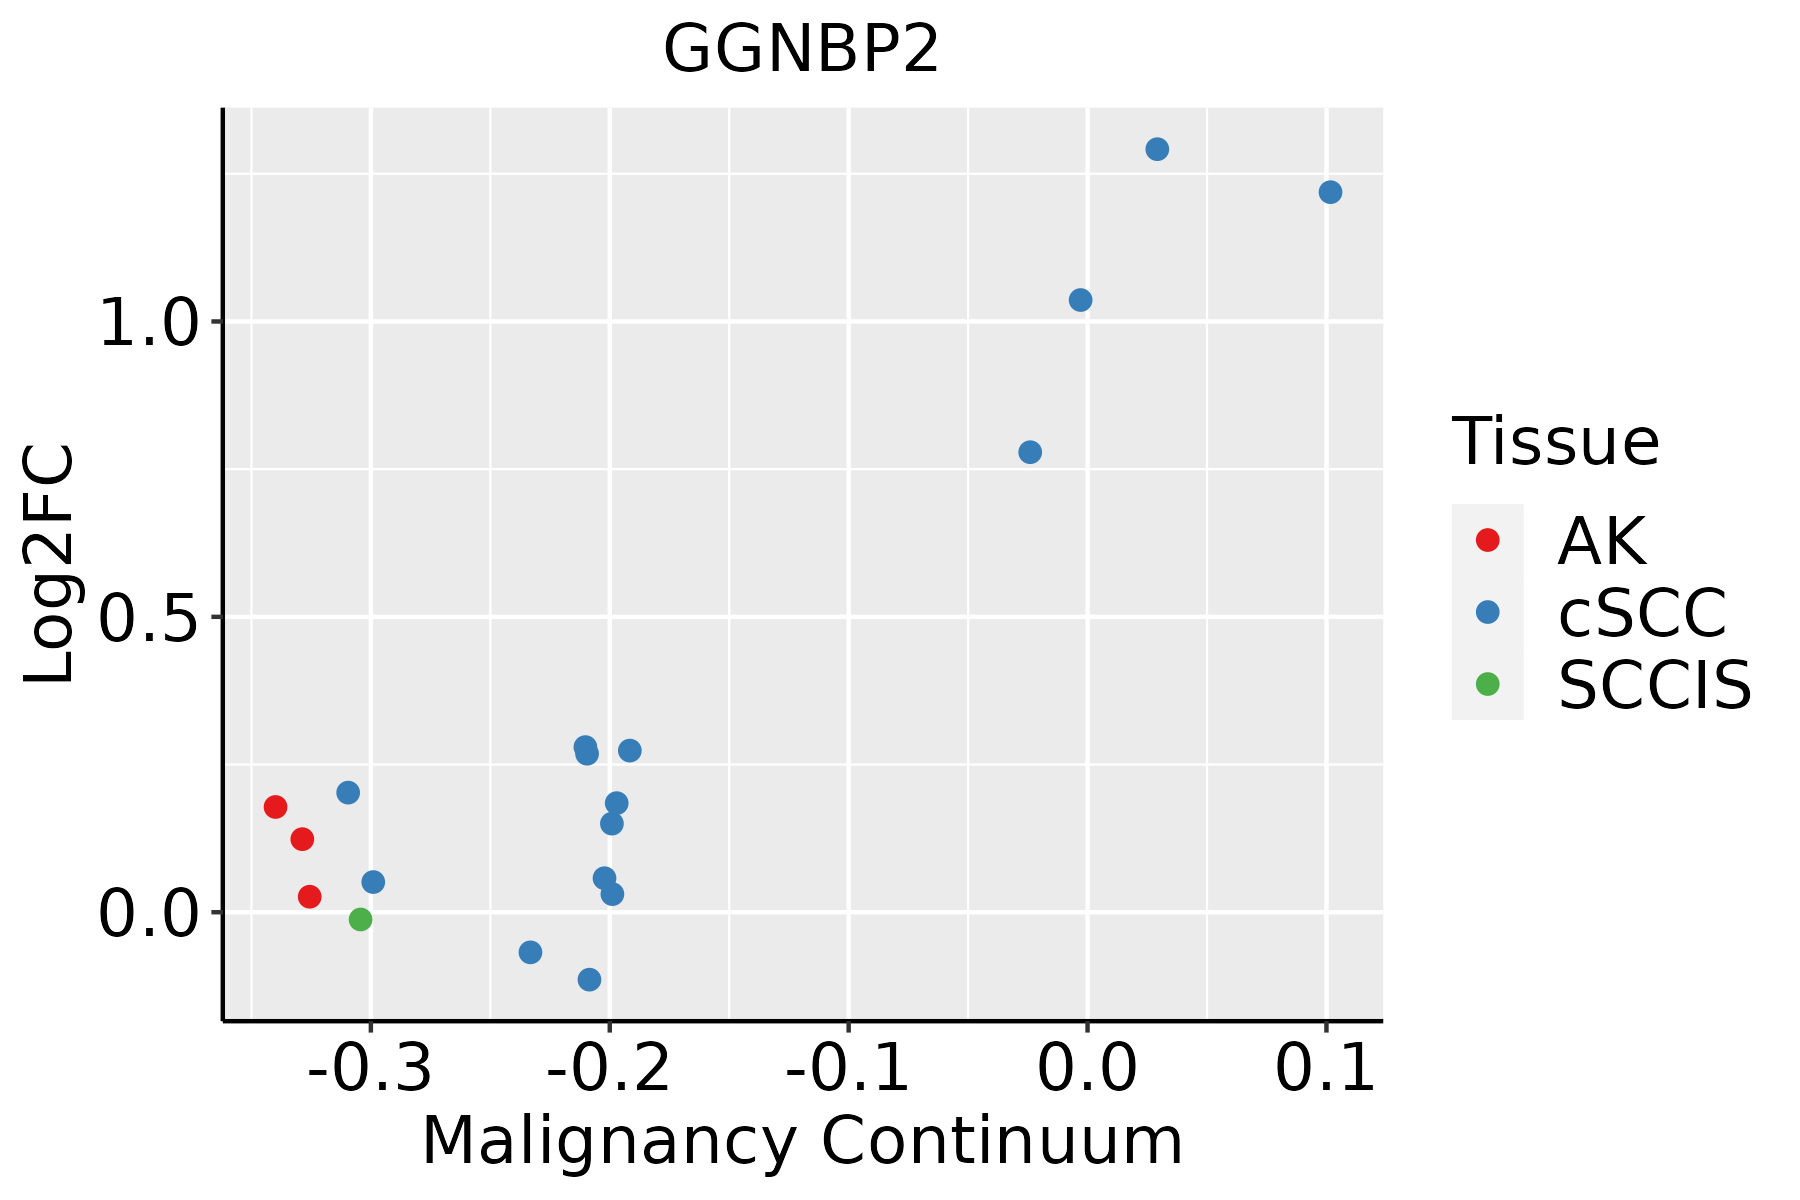
AK: Actinic keratosis
cSCC: Cutaneous squamous cell carcinoma
SCCIS:squamous cell carcinoma in situ
ThyroidThe image shows the transcriptomic changes along malignancy continuum.log2FC in expression of this searched gene in stem-like cells from each diseased tissue sample relative to stem-like cells in normal samples in each tissue plotted against the malignancy continuum. Samples are colored based on if they are from different disease stage.ATC: Anaplastic thyroid cancer
HT: Hashimoto's thyroiditis
PTC: Papillary thyroid cancer
∗log2FC in expression of this searched gene in stem-like cells from each diseased tissue sample relative to stem-like cells in normal samples in each tissue plotted against the malignancy continuum. Samples are colored based on if they are from different disease stage.

Top

Malignant transformation related pathway analysis

check buttonFind out the enriched GO biological processes and KEGG pathways involved in transition from healthy to precancer to cancer
check button Figure of enriched GO biological processes.
TissueDisease StageEnriched GO biological Processes
ColorectumADGO analysis - Figure of enriched GO biological processes: Top 15 enriched GO BP terms are showed in the bar plot of each disease state in each tissue. Each row represents a significant GO biological process which is colored according to the -log10(p.adjust).
ColorectumSERGO analysis - Figure of enriched GO biological processes: Top 15 enriched GO BP terms are showed in the bar plot of each disease state in each tissue. Each row represents a significant GO biological process which is colored according to the -log10(p.adjust).
ColorectumMSSGO analysis - Figure of enriched GO biological processes: Top 15 enriched GO BP terms are showed in the bar plot of each disease state in each tissue. Each row represents a significant GO biological process which is colored according to the -log10(p.adjust).
ColorectumMSI-HGO analysis - Figure of enriched GO biological processes: Top 15 enriched GO BP terms are showed in the bar plot of each disease state in each tissue. Each row represents a significant GO biological process which is colored according to the -log10(p.adjust).
ColorectumFAPGO analysis - Figure of enriched GO biological processes: Top 15 enriched GO BP terms are showed in the bar plot of each disease state in each tissue. Each row represents a significant GO biological process which is colored according to the -log10(p.adjust).
∗Top 15 enriched GO BP terms are showed in the bar plot of each disease state in each tissue. Each row represents a significant GO biological process which is colored according to the -log10(p.adjust).
Page: 1 2 3 4 5 6 7 8 9 

check button Enriched GO biological processes.
GO IDTissueDisease StageDescriptionGene RatioBg Ratiopvaluep.adjustCount
GO:0010563ColorectumADnegative regulation of phosphorus metabolic process130/3918442/187231.26e-052.76e-04130
GO:0045936ColorectumADnegative regulation of phosphate metabolic process129/3918441/187231.81e-053.76e-04129
GO:0051348ColorectumADnegative regulation of transferase activity85/3918268/187232.07e-054.19e-0485
GO:0001701ColorectumADin utero embryonic development110/3918367/187232.36e-054.62e-04110
GO:0001890ColorectumADplacenta development51/3918144/187233.99e-057.16e-0451
GO:0001892ColorectumADembryonic placenta development33/391882/187235.30e-059.01e-0433
GO:0042326ColorectumADnegative regulation of phosphorylation112/3918385/187238.02e-051.27e-03112
GO:0001933ColorectumADnegative regulation of protein phosphorylation101/3918342/187239.39e-051.42e-03101
GO:0006469ColorectumADnegative regulation of protein kinase activity65/3918212/187235.21e-045.62e-0365
GO:0033673ColorectumADnegative regulation of kinase activity71/3918237/187236.18e-046.47e-0371
GO:0060711ColorectumADlabyrinthine layer development19/391844/187237.13e-047.21e-0319
GO:0061458ColorectumADreproductive system development116/3918427/187231.11e-031.01e-02116
GO:0018105ColorectumADpeptidyl-serine phosphorylation88/3918315/187231.73e-031.43e-0288
GO:0048608ColorectumADreproductive structure development114/3918424/187231.78e-031.47e-02114
GO:0018209ColorectumADpeptidyl-serine modification92/3918338/187233.19e-032.36e-0292
GO:0048568ColorectumADembryonic organ development112/3918427/187234.60e-033.14e-02112
GO:0060716ColorectumADlabyrinthine layer blood vessel development9/391818/187235.82e-033.67e-029
GO:0061099ColorectumADnegative regulation of protein tyrosine kinase activity13/391831/187236.53e-034.06e-0213
GO:00018902ColorectumMSSplacenta development51/3467144/187231.10e-063.77e-0551
GO:00513482ColorectumMSSnegative regulation of transferase activity80/3467268/187234.06e-061.17e-0480
Page: 1 2 3 4 5 6 7 8 9 10 11 12 13 14 

check button Enriched KEGG pathways.
Pathway IDTissueDisease StageDescriptionGene RatioBg Ratiopvaluep.adjustqvalueCount
Page: 1 

Top

Cell-cell communication analysis

check buttonIdentification of potential cell-cell interactions between two cell types and their ligand-receptor pairs for different disease states
LigandReceptorLRpairPathwayTissueDisease Stage
Page: 1 

Top

Single-cell gene regulatory network inference analysis

check buttonFind out the significant the regulons (TFs) and the target genes of each regulon across cell types for different disease states
TFCell TypeTissueDisease StageTarget GeneRSSRegulon Activity
∗The dot plots of a searched regulon are shown for all cell subpopulations in each disease state of each tissue based on the regulon specific score inferred using pySCENIC and by calculating the average expression.
Page: 1 

Top

Somatic mutation of malignant transformation related genes

check buttonAnnotation of somatic variants for genes involved in malignant transformation
Hugo SymbolVariant ClassVariant ClassificationdbSNP RSHGVScHGVSpHGVSp ShortSWISSPROTBIOTYPESIFTPolyPhenTumor Sample BarcodeTissueHistologySexAgeStageTherapy TypesDrugsOutcome
GGNBP2SNVMissense_Mutationnovelc.308N>Cp.Leu103Prop.L103PQ9H3C7protein_codingdeleterious(0)probably_damaging(0.952)TCGA-A8-A09Z-01Breastbreast invasive carcinomaFemale>=65I/IIUnknownUnknownSD
GGNBP2insertionFrame_Shift_Insnovelc.1108_1109insCGCTAAGTTGCTTTAGTAAGTCTCACAGGp.Gln370ProfsTer42p.Q370Pfs*42Q9H3C7protein_codingTCGA-A2-A0YH-01Breastbreast invasive carcinomaFemale<65III/IVChemotherapyadriamycinSD
GGNBP2insertionNonsense_Mutationnovelc.824_825insGCGTATGTTTTAAATGTGTGTATGGAGGCTTATTTTGGATGCTGTAGAp.Ala275_Glu276insArgMetPheTerMetCysValTrpArgLeuIleLeuAspAlaValAspp.A275_E276insRMF*MCVWRLILDAVDQ9H3C7protein_codingTCGA-A8-A08H-01Breastbreast invasive carcinomaFemale>=65I/IIUnknownUnknownSD
GGNBP2SNVMissense_Mutationnovelc.2077N>Gp.Thr693Alap.T693AQ9H3C7protein_codingtolerated_low_confidence(0.13)benign(0.026)TCGA-2W-A8YY-01Cervixcervical & endocervical cancerFemale<65I/IIChemotherapycisplatinCR
GGNBP2SNVMissense_Mutationnovelc.259N>Ap.Val87Ilep.V87IQ9H3C7protein_codingtolerated(0.19)benign(0.003)TCGA-DG-A2KJ-01Cervixcervical & endocervical cancerFemale<65III/IVChemotherapycisplatinSD
GGNBP2SNVMissense_Mutationnovelc.778N>Tp.His260Tyrp.H260YQ9H3C7protein_codingdeleterious(0)probably_damaging(0.988)TCGA-IR-A3LA-01Cervixcervical & endocervical cancerFemale<65I/IIChemotherapycisplatinCR
GGNBP2SNVMissense_Mutationnovelc.583G>Cp.Val195Leup.V195LQ9H3C7protein_codingtolerated(0.08)benign(0.342)TCGA-IR-A3LK-01Cervixcervical & endocervical cancerFemale>=65I/IIChemotherapycisplatinPD
GGNBP2SNVMissense_Mutationnovelc.939C>Gp.Ile313Metp.I313MQ9H3C7protein_codingdeleterious(0)probably_damaging(0.931)TCGA-Q1-A6DT-01Cervixcervical & endocervical cancerFemale<65I/IIUnknownUnknownPD
GGNBP2SNVMissense_Mutationnovelc.935N>Ap.Arg312Glnp.R312QQ9H3C7protein_codingdeleterious(0)probably_damaging(0.984)TCGA-AA-A00N-01Colorectumcolon adenocarcinomaMale>=65I/IIUnknownUnknownPD
GGNBP2SNVMissense_Mutationnovelc.1134N>Tp.Lys378Asnp.K378NQ9H3C7protein_codingtolerated(0.06)probably_damaging(0.996)TCGA-AA-A00N-01Colorectumcolon adenocarcinomaMale>=65I/IIUnknownUnknownPD
Page: 1 2 3 4 5 6 7 8 9 

Top

Related drugs of malignant transformation related genes

check buttonIdentification of chemicals and drugs interact with genes involved in malignant transfromation
(DGIdb 4.0)
Entrez IDSymbolCategoryInteraction TypesDrug Claim NameDrug NamePMIDs
Page: 1