
|
|||||
|
 | |
| |
| |
| |
| |
| |
|
Gene: GGCX |
Gene summary for GGCX |
| Gene information | Species | Human | Gene symbol | GGCX | Gene ID | 2677 |
| Gene name | gamma-glutamyl carboxylase | |
| Gene Alias | VKCFD1 | |
| Cytomap | 2p11.2 | |
| Gene Type | protein-coding | GO ID | GO:0006464 | UniProtAcc | P38435 |
Top |
Malignant transformation analysis |
| Identification of the aberrant gene expression in precancerous and cancerous lesions by comparing the gene expression of stem-like cells in diseased tissues with normal stem cells |
| Entrez ID | Symbol | Replicates | Species | Organ | Tissue | Adj P-value | Log2FC | Malignancy |
| 2677 | GGCX | LZE2T | Human | Esophagus | ESCC | 4.83e-03 | 6.02e-01 | 0.082 |
| 2677 | GGCX | LZE4T | Human | Esophagus | ESCC | 1.68e-08 | 6.74e-02 | 0.0811 |
| 2677 | GGCX | LZE7T | Human | Esophagus | ESCC | 6.02e-05 | 2.32e-01 | 0.0667 |
| 2677 | GGCX | LZE8T | Human | Esophagus | ESCC | 5.84e-06 | 1.19e-01 | 0.067 |
| 2677 | GGCX | LZE20T | Human | Esophagus | ESCC | 8.50e-08 | 1.57e-01 | 0.0662 |
| 2677 | GGCX | LZE22T | Human | Esophagus | ESCC | 4.33e-05 | 1.73e-01 | 0.068 |
| 2677 | GGCX | LZE24T | Human | Esophagus | ESCC | 2.80e-12 | 3.60e-01 | 0.0596 |
| 2677 | GGCX | P2T-E | Human | Esophagus | ESCC | 3.58e-30 | 6.08e-01 | 0.1177 |
| 2677 | GGCX | P4T-E | Human | Esophagus | ESCC | 1.56e-32 | 7.35e-01 | 0.1323 |
| 2677 | GGCX | P5T-E | Human | Esophagus | ESCC | 7.08e-18 | 2.63e-01 | 0.1327 |
| 2677 | GGCX | P8T-E | Human | Esophagus | ESCC | 2.73e-17 | 1.96e-01 | 0.0889 |
| 2677 | GGCX | P9T-E | Human | Esophagus | ESCC | 2.09e-04 | 1.49e-01 | 0.1131 |
| 2677 | GGCX | P10T-E | Human | Esophagus | ESCC | 1.55e-33 | 3.26e-01 | 0.116 |
| 2677 | GGCX | P11T-E | Human | Esophagus | ESCC | 9.92e-09 | 2.14e-01 | 0.1426 |
| 2677 | GGCX | P12T-E | Human | Esophagus | ESCC | 1.52e-23 | 2.77e-01 | 0.1122 |
| 2677 | GGCX | P15T-E | Human | Esophagus | ESCC | 6.96e-22 | 4.81e-01 | 0.1149 |
| 2677 | GGCX | P16T-E | Human | Esophagus | ESCC | 3.55e-21 | 5.14e-01 | 0.1153 |
| 2677 | GGCX | P17T-E | Human | Esophagus | ESCC | 1.95e-08 | 3.87e-01 | 0.1278 |
| 2677 | GGCX | P19T-E | Human | Esophagus | ESCC | 2.44e-06 | 7.21e-01 | 0.1662 |
| 2677 | GGCX | P20T-E | Human | Esophagus | ESCC | 2.15e-22 | 4.21e-01 | 0.1124 |
| Page: 1 2 3 4 5 6 |
| Tissue | Expression Dynamics | Abbreviation |
| Esophagus | 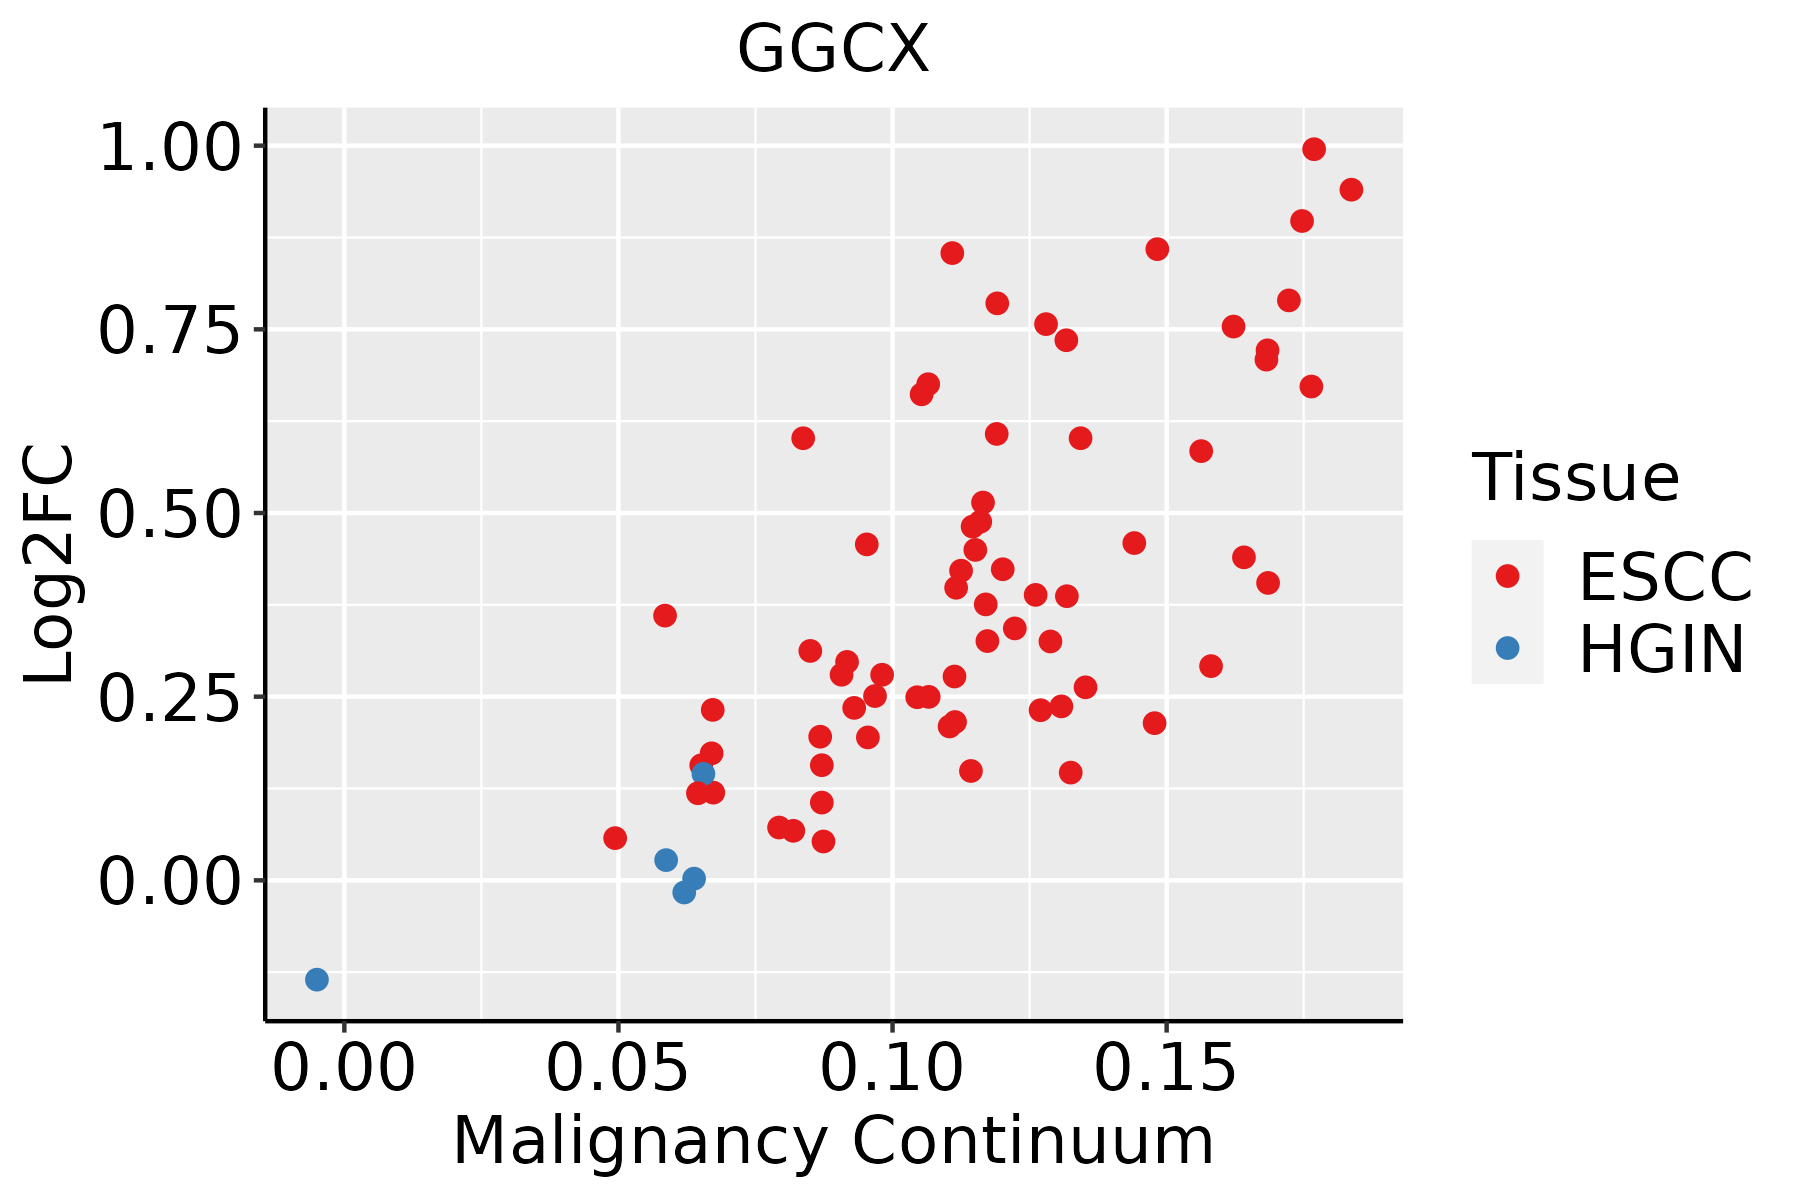 | ESCC: Esophageal squamous cell carcinoma |
| HGIN: High-grade intraepithelial neoplasias | ||
| LGIN: Low-grade intraepithelial neoplasias | ||
| Liver |  | HCC: Hepatocellular carcinoma |
| NAFLD: Non-alcoholic fatty liver disease | ||
| Oral Cavity | 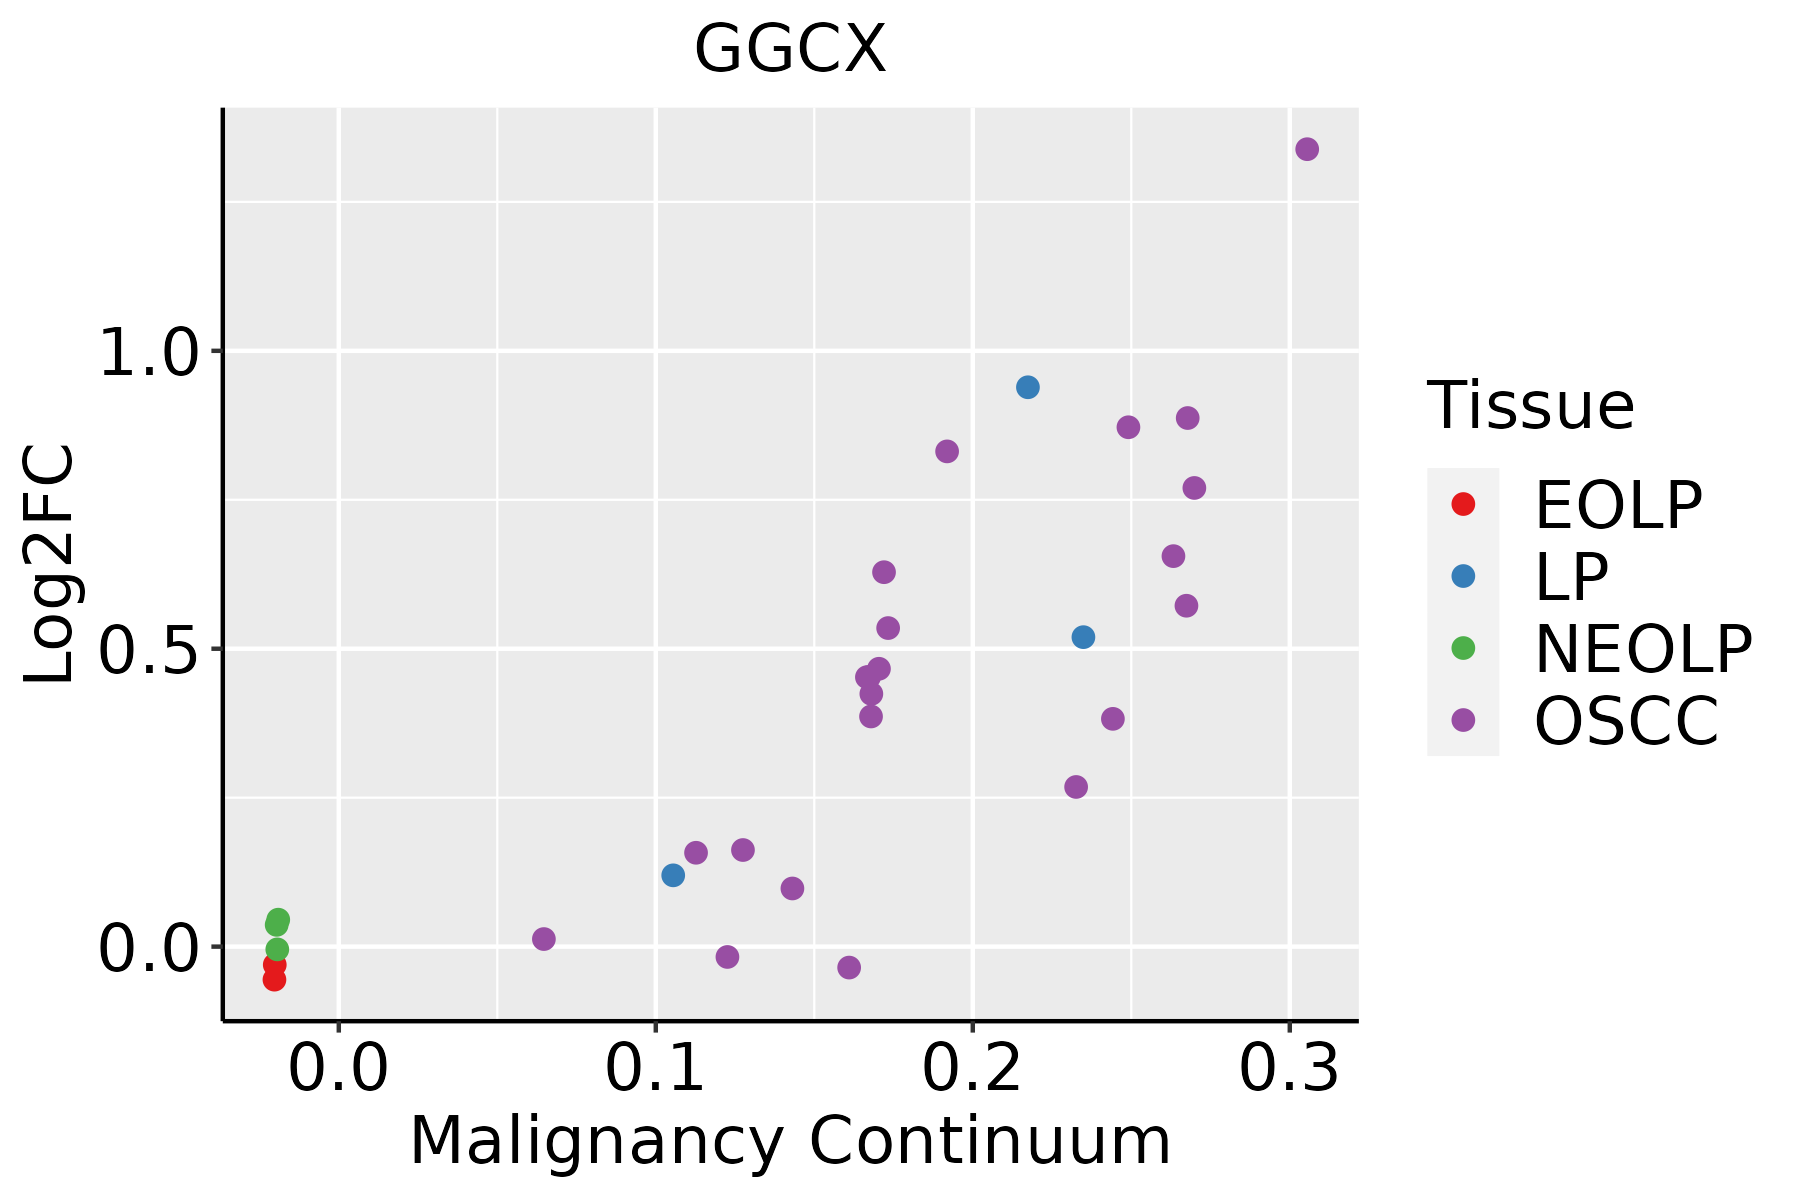 | EOLP: Erosive Oral lichen planus |
| LP: leukoplakia | ||
| NEOLP: Non-erosive oral lichen planus | ||
| OSCC: Oral squamous cell carcinoma | ||
| Thyroid | 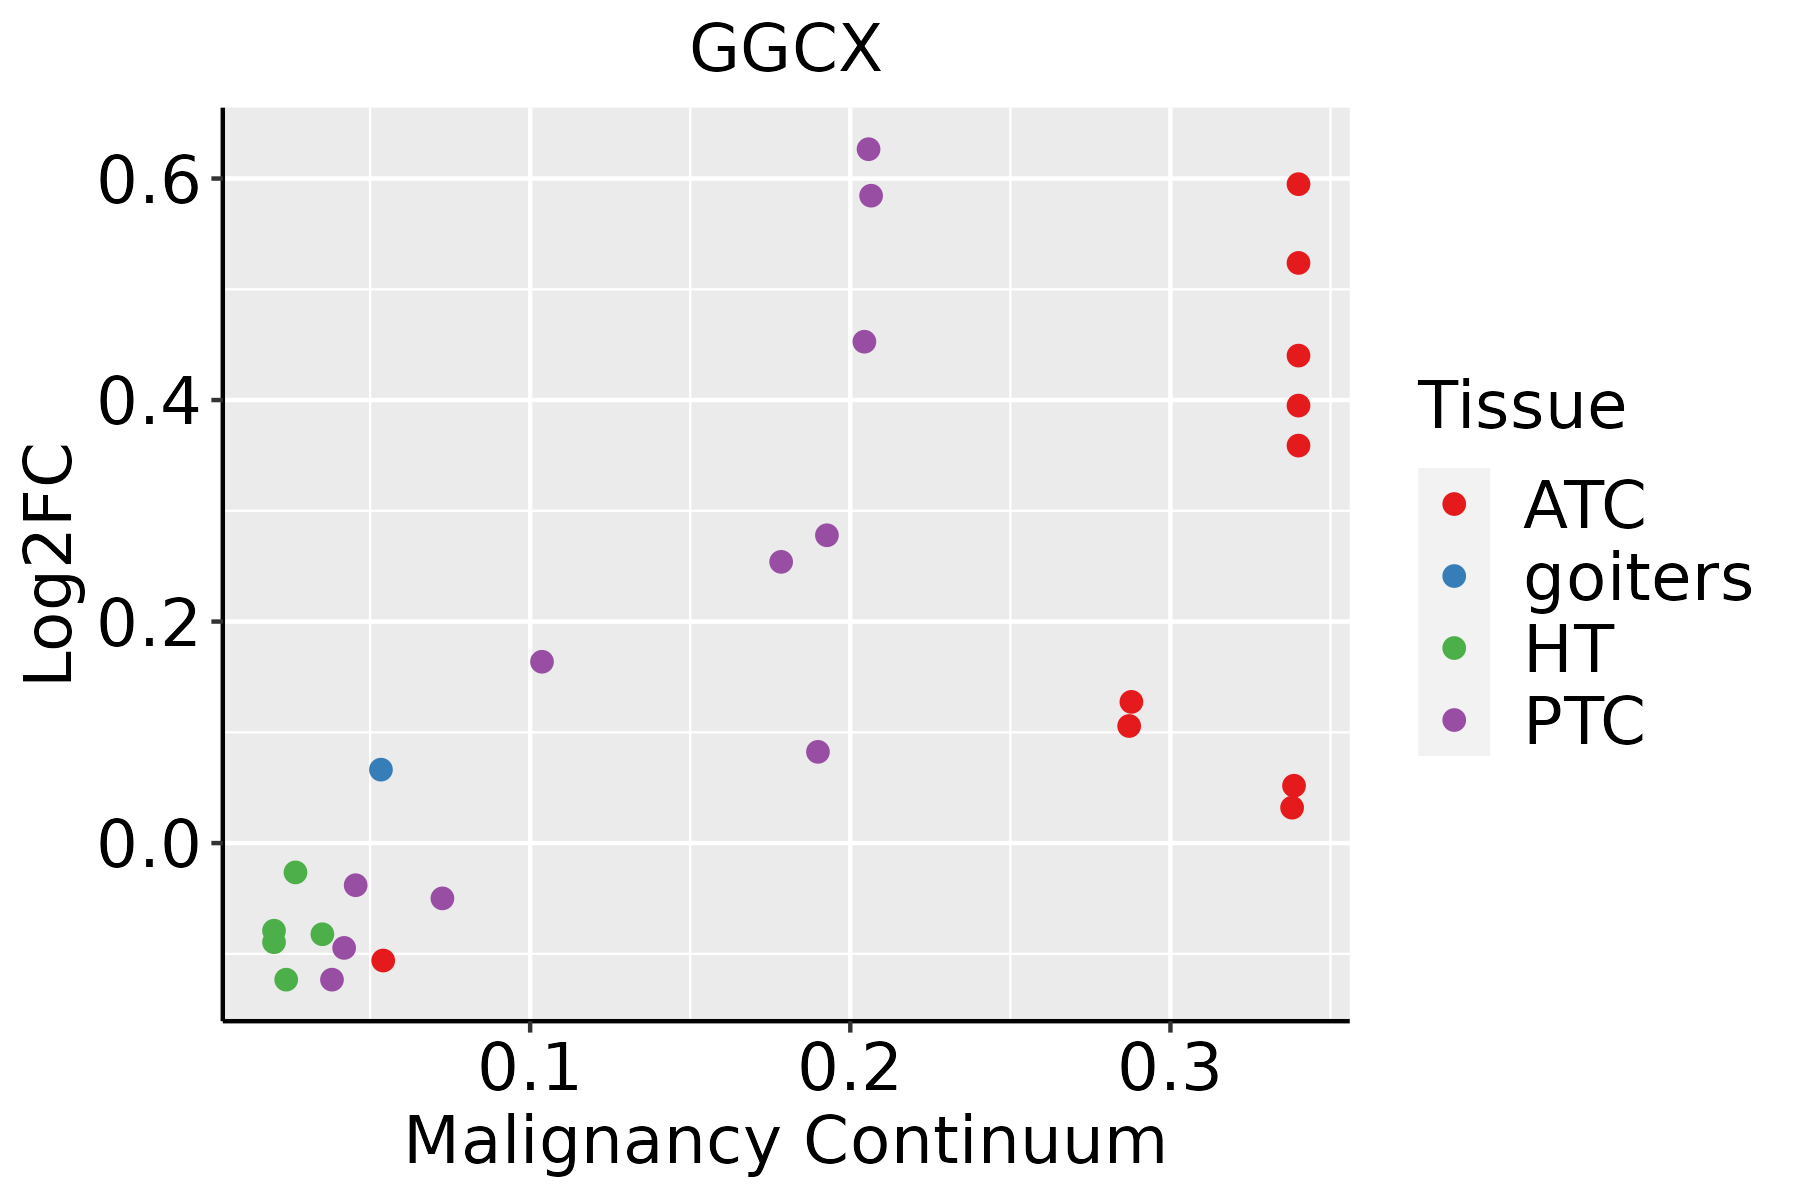 | ATC: Anaplastic thyroid cancer |
| HT: Hashimoto's thyroiditis | ||
| PTC: Papillary thyroid cancer |
| ∗log2FC in expression of this searched gene in stem-like cells from each diseased tissue sample relative to stem-like cells in normal samples in each tissue plotted against the malignancy continuum. Samples are colored based on if they are from different disease stage. |
Top |
Malignant transformation related pathway analysis |
| Find out the enriched GO biological processes and KEGG pathways involved in transition from healthy to precancer to cancer |
| Tissue | Disease Stage | Enriched GO biological Processes |
| Colorectum | AD |  |
| Colorectum | SER |  |
| Colorectum | MSS |  |
| Colorectum | MSI-H |  |
| Colorectum | FAP |  |
| ∗Top 15 enriched GO BP terms are showed in the bar plot of each disease state in each tissue. Each row represents a significant GO biological process which is colored according to the -log10(p.adjust). |
| Page: 1 2 3 4 5 6 7 8 9 |
| GO ID | Tissue | Disease Stage | Description | Gene Ratio | Bg Ratio | pvalue | p.adjust | Count |
| GO:004206027 | Esophagus | ESCC | wound healing | 243/8552 | 422/18723 | 4.62e-07 | 6.25e-06 | 243 |
| GO:004206012 | Liver | Cirrhotic | wound healing | 155/4634 | 422/18723 | 2.12e-08 | 7.56e-07 | 155 |
| GO:000759611 | Liver | Cirrhotic | blood coagulation | 79/4634 | 217/18723 | 8.06e-05 | 8.81e-04 | 79 |
| GO:000759911 | Liver | Cirrhotic | hemostasis | 80/4634 | 222/18723 | 1.08e-04 | 1.10e-03 | 80 |
| GO:005081711 | Liver | Cirrhotic | coagulation | 79/4634 | 222/18723 | 1.90e-04 | 1.76e-03 | 79 |
| GO:005087812 | Liver | Cirrhotic | regulation of body fluid levels | 118/4634 | 379/18723 | 2.65e-03 | 1.55e-02 | 118 |
| GO:004206022 | Liver | HCC | wound healing | 219/7958 | 422/18723 | 5.34e-05 | 5.04e-04 | 219 |
| GO:00075962 | Liver | HCC | blood coagulation | 118/7958 | 217/18723 | 2.63e-04 | 1.94e-03 | 118 |
| GO:00075992 | Liver | HCC | hemostasis | 119/7958 | 222/18723 | 5.25e-04 | 3.41e-03 | 119 |
| GO:00508172 | Liver | HCC | coagulation | 118/7958 | 222/18723 | 8.41e-04 | 5.03e-03 | 118 |
| GO:005087822 | Liver | HCC | regulation of body fluid levels | 191/7958 | 379/18723 | 1.06e-03 | 6.11e-03 | 191 |
| GO:004206020 | Oral cavity | OSCC | wound healing | 237/7305 | 422/18723 | 4.51e-13 | 2.18e-11 | 237 |
| GO:005087819 | Oral cavity | OSCC | regulation of body fluid levels | 179/7305 | 379/18723 | 6.19e-04 | 3.50e-03 | 179 |
| GO:00075969 | Oral cavity | OSCC | blood coagulation | 102/7305 | 217/18723 | 9.69e-03 | 3.43e-02 | 102 |
| GO:00075999 | Oral cavity | OSCC | hemostasis | 103/7305 | 222/18723 | 1.45e-02 | 4.73e-02 | 103 |
| GO:00508179 | Oral cavity | OSCC | coagulation | 103/7305 | 222/18723 | 1.45e-02 | 4.73e-02 | 103 |
| GO:0042060110 | Oral cavity | LP | wound healing | 139/4623 | 422/18723 | 7.10e-05 | 9.48e-04 | 139 |
| GO:0042060112 | Thyroid | PTC | wound healing | 190/5968 | 422/18723 | 7.72e-09 | 1.92e-07 | 190 |
| GO:004206034 | Thyroid | ATC | wound healing | 210/6293 | 422/18723 | 3.33e-12 | 1.37e-10 | 210 |
| GO:000759618 | Thyroid | ATC | blood coagulation | 93/6293 | 217/18723 | 2.69e-03 | 1.23e-02 | 93 |
| Page: 1 2 |
| Pathway ID | Tissue | Disease Stage | Description | Gene Ratio | Bg Ratio | pvalue | p.adjust | qvalue | Count |
| hsa012405 | Esophagus | ESCC | Biosynthesis of cofactors | 97/4205 | 153/8465 | 3.88e-04 | 1.35e-03 | 6.94e-04 | 97 |
| hsa0124012 | Esophagus | ESCC | Biosynthesis of cofactors | 97/4205 | 153/8465 | 3.88e-04 | 1.35e-03 | 6.94e-04 | 97 |
| hsa01240 | Liver | Cirrhotic | Biosynthesis of cofactors | 66/2530 | 153/8465 | 3.11e-04 | 1.99e-03 | 1.23e-03 | 66 |
| hsa012401 | Liver | Cirrhotic | Biosynthesis of cofactors | 66/2530 | 153/8465 | 3.11e-04 | 1.99e-03 | 1.23e-03 | 66 |
| hsa012402 | Liver | HCC | Biosynthesis of cofactors | 103/4020 | 153/8465 | 4.67e-07 | 5.05e-06 | 2.81e-06 | 103 |
| hsa012403 | Liver | HCC | Biosynthesis of cofactors | 103/4020 | 153/8465 | 4.67e-07 | 5.05e-06 | 2.81e-06 | 103 |
| hsa012404 | Oral cavity | OSCC | Biosynthesis of cofactors | 88/3704 | 153/8465 | 3.84e-04 | 1.20e-03 | 6.12e-04 | 88 |
| hsa00130 | Oral cavity | OSCC | Ubiquinone and other terpenoid-quinone biosynthesis | 9/3704 | 11/8465 | 1.19e-02 | 2.62e-02 | 1.33e-02 | 9 |
| hsa0124011 | Oral cavity | OSCC | Biosynthesis of cofactors | 88/3704 | 153/8465 | 3.84e-04 | 1.20e-03 | 6.12e-04 | 88 |
| hsa001301 | Oral cavity | OSCC | Ubiquinone and other terpenoid-quinone biosynthesis | 9/3704 | 11/8465 | 1.19e-02 | 2.62e-02 | 1.33e-02 | 9 |
| hsa001302 | Oral cavity | LP | Ubiquinone and other terpenoid-quinone biosynthesis | 8/2418 | 11/8465 | 3.03e-03 | 1.29e-02 | 8.35e-03 | 8 |
| hsa0124021 | Oral cavity | LP | Biosynthesis of cofactors | 57/2418 | 153/8465 | 1.17e-02 | 3.91e-02 | 2.52e-02 | 57 |
| hsa001303 | Oral cavity | LP | Ubiquinone and other terpenoid-quinone biosynthesis | 8/2418 | 11/8465 | 3.03e-03 | 1.29e-02 | 8.35e-03 | 8 |
| hsa0124031 | Oral cavity | LP | Biosynthesis of cofactors | 57/2418 | 153/8465 | 1.17e-02 | 3.91e-02 | 2.52e-02 | 57 |
| Page: 1 |
Top |
Cell-cell communication analysis |
| Identification of potential cell-cell interactions between two cell types and their ligand-receptor pairs for different disease states |
| Ligand | Receptor | LRpair | Pathway | Tissue | Disease Stage |
| Page: 1 |
Top |
Single-cell gene regulatory network inference analysis |
| Find out the significant the regulons (TFs) and the target genes of each regulon across cell types for different disease states |
| TF | Cell Type | Tissue | Disease Stage | Target Gene | RSS | Regulon Activity |
| ∗The dot plots of a searched regulon are shown for all cell subpopulations in each disease state of each tissue based on the regulon specific score inferred using pySCENIC and by calculating the average expression. |
| Page: 1 |
Top |
Somatic mutation of malignant transformation related genes |
| Annotation of somatic variants for genes involved in malignant transformation |
| Hugo Symbol | Variant Class | Variant Classification | dbSNP RS | HGVSc | HGVSp | HGVSp Short | SWISSPROT | BIOTYPE | SIFT | PolyPhen | Tumor Sample Barcode | Tissue | Histology | Sex | Age | Stage | Therapy Types | Drugs | Outcome |
| GGCX | SNV | Missense_Mutation | novel | c.1114C>A | p.Leu372Met | p.L372M | P38435 | protein_coding | tolerated(0.17) | benign(0.209) | TCGA-AR-A0TR-01 | Breast | breast invasive carcinoma | Female | >=65 | I/II | Hormone Therapy | tamoxiphen | SD |
| GGCX | SNV | Missense_Mutation | novel | c.1190A>G | p.Tyr397Cys | p.Y397C | P38435 | protein_coding | deleterious(0) | probably_damaging(0.999) | TCGA-BH-A0EB-01 | Breast | breast invasive carcinoma | Female | >=65 | I/II | Hormone Therapy | arimidex | SD |
| GGCX | SNV | Missense_Mutation | novel | c.2242N>A | p.Glu748Lys | p.E748K | P38435 | protein_coding | tolerated_low_confidence(0.08) | benign(0.001) | TCGA-PE-A5DE-01 | Breast | breast invasive carcinoma | Female | <65 | I/II | Chemotherapy | taxotere | CR |
| GGCX | insertion | Nonsense_Mutation | novel | c.1558_1559insGCCAAATCTGTTTTCATT | p.Lys520delinsSerGlnIleCysPheHisTer | p.K520delinsSQICFH* | P38435 | protein_coding | TCGA-B6-A0RE-01 | Breast | breast invasive carcinoma | Female | <65 | I/II | Unknown | Unknown | SD | ||
| GGCX | insertion | Frame_Shift_Ins | novel | c.1188_1189insAGGAGGCTGAGGCATGAGAATCGCT | p.Tyr397ArgfsTer29 | p.Y397Rfs*29 | P38435 | protein_coding | TCGA-BH-A0EB-01 | Breast | breast invasive carcinoma | Female | >=65 | I/II | Hormone Therapy | arimidex | SD | ||
| GGCX | insertion | Frame_Shift_Ins | novel | c.993_994insA | p.Pro332ThrfsTer15 | p.P332Tfs*15 | P38435 | protein_coding | TCGA-BH-A0EE-01 | Breast | breast invasive carcinoma | Female | >=65 | I/II | Chemotherapy | docetaxel | SD | ||
| GGCX | insertion | In_Frame_Ins | novel | c.992_993insTTATACGAAGATATTTCCTTTTCTACCATT | p.Leu330_Leu331insPheTyrThrLysIlePheProPheLeuPro | p.L330_L331insFYTKIFPFLP | P38435 | protein_coding | TCGA-BH-A0EE-01 | Breast | breast invasive carcinoma | Female | >=65 | I/II | Chemotherapy | docetaxel | SD | ||
| GGCX | SNV | Missense_Mutation | rs773659201 | c.1453C>T | p.Arg485Cys | p.R485C | P38435 | protein_coding | deleterious(0.01) | possibly_damaging(0.773) | TCGA-2W-A8YY-01 | Cervix | cervical & endocervical cancer | Female | <65 | I/II | Chemotherapy | cisplatin | CR |
| GGCX | SNV | Missense_Mutation | c.787N>C | p.Asp263His | p.D263H | P38435 | protein_coding | deleterious(0) | probably_damaging(0.999) | TCGA-C5-A1BQ-01 | Cervix | cervical & endocervical cancer | Female | >=65 | III/IV | Chemotherapy | cisplatin | CR | |
| GGCX | SNV | Missense_Mutation | novel | c.193N>A | p.Ala65Thr | p.A65T | P38435 | protein_coding | deleterious(0) | possibly_damaging(0.833) | TCGA-EA-A410-01 | Cervix | cervical & endocervical cancer | Female | <65 | I/II | Unknown | Unknown | SD |
| Page: 1 2 3 4 5 6 7 8 9 |
Top |
Related drugs of malignant transformation related genes |
| Identification of chemicals and drugs interact with genes involved in malignant transfromation |
| (DGIdb 4.0) |
| Entrez ID | Symbol | Category | Interaction Types | Drug Claim Name | Drug Name | PMIDs |
| 2677 | GGCX | DRUGGABLE GENOME, ENZYME | PHYTONADIONE | PHYTONADIONE | ||
| 2677 | GGCX | DRUGGABLE GENOME, ENZYME | ANISINDIONE | ANISINDIONE | ||
| 2677 | GGCX | DRUGGABLE GENOME, ENZYME | ANISINDIONE | ANISINDIONE | ||
| 2677 | GGCX | DRUGGABLE GENOME, ENZYME | MENADIONE | MENADIONE | ||
| 2677 | GGCX | DRUGGABLE GENOME, ENZYME | PHYTONADIONE | PHYTONADIONE | ||
| 2677 | GGCX | DRUGGABLE GENOME, ENZYME | Phytonadione | PHYTONADIONE | ||
| 2677 | GGCX | DRUGGABLE GENOME, ENZYME | inhibitor | 178103541 | ANISINDIONE | |
| 2677 | GGCX | DRUGGABLE GENOME, ENZYME | MENADIONE | MENADIONE | ||
| 2677 | GGCX | DRUGGABLE GENOME, ENZYME | acenocoumarol | ACENOCOUMAROL | 25042728,25519826,24927344,29432897 |
| Page: 1 |

Copyright 2023-Present -The University of Texas Health Science Center at Houston |