
|
|||||
|
 | |
| |
| |
| |
| |
| |
|
Gene: GGA3 |
Gene summary for GGA3 |
| Gene information | Species | Human | Gene symbol | GGA3 | Gene ID | 23163 |
| Gene name | golgi associated, gamma adaptin ear containing, ARF binding protein 3 | |
| Gene Alias | GGA3 | |
| Cytomap | 17q25.1 | |
| Gene Type | protein-coding | GO ID | GO:0006518 | UniProtAcc | Q9NZ52 |
Top |
Malignant transformation analysis |
| Identification of the aberrant gene expression in precancerous and cancerous lesions by comparing the gene expression of stem-like cells in diseased tissues with normal stem cells |
| Entrez ID | Symbol | Replicates | Species | Organ | Tissue | Adj P-value | Log2FC | Malignancy |
| 23163 | GGA3 | HCC1_Meng | Human | Liver | HCC | 3.86e-19 | 2.01e-02 | 0.0246 |
| 23163 | GGA3 | HCC2_Meng | Human | Liver | HCC | 3.93e-04 | 3.99e-02 | 0.0107 |
| 23163 | GGA3 | HCC1 | Human | Liver | HCC | 4.86e-05 | 3.08e+00 | 0.5336 |
| 23163 | GGA3 | HCC2 | Human | Liver | HCC | 3.47e-09 | 3.05e+00 | 0.5341 |
| 23163 | GGA3 | S014 | Human | Liver | HCC | 1.34e-08 | 2.27e-01 | 0.2254 |
| 23163 | GGA3 | S016 | Human | Liver | HCC | 2.12e-05 | 1.80e-01 | 0.2243 |
| 23163 | GGA3 | S027 | Human | Liver | HCC | 5.89e-03 | 2.56e-01 | 0.2446 |
| 23163 | GGA3 | S028 | Human | Liver | HCC | 1.89e-12 | 3.46e-01 | 0.2503 |
| 23163 | GGA3 | S029 | Human | Liver | HCC | 1.02e-03 | 2.07e-01 | 0.2581 |
| Page: 1 |
| Tissue | Expression Dynamics | Abbreviation |
| Liver | 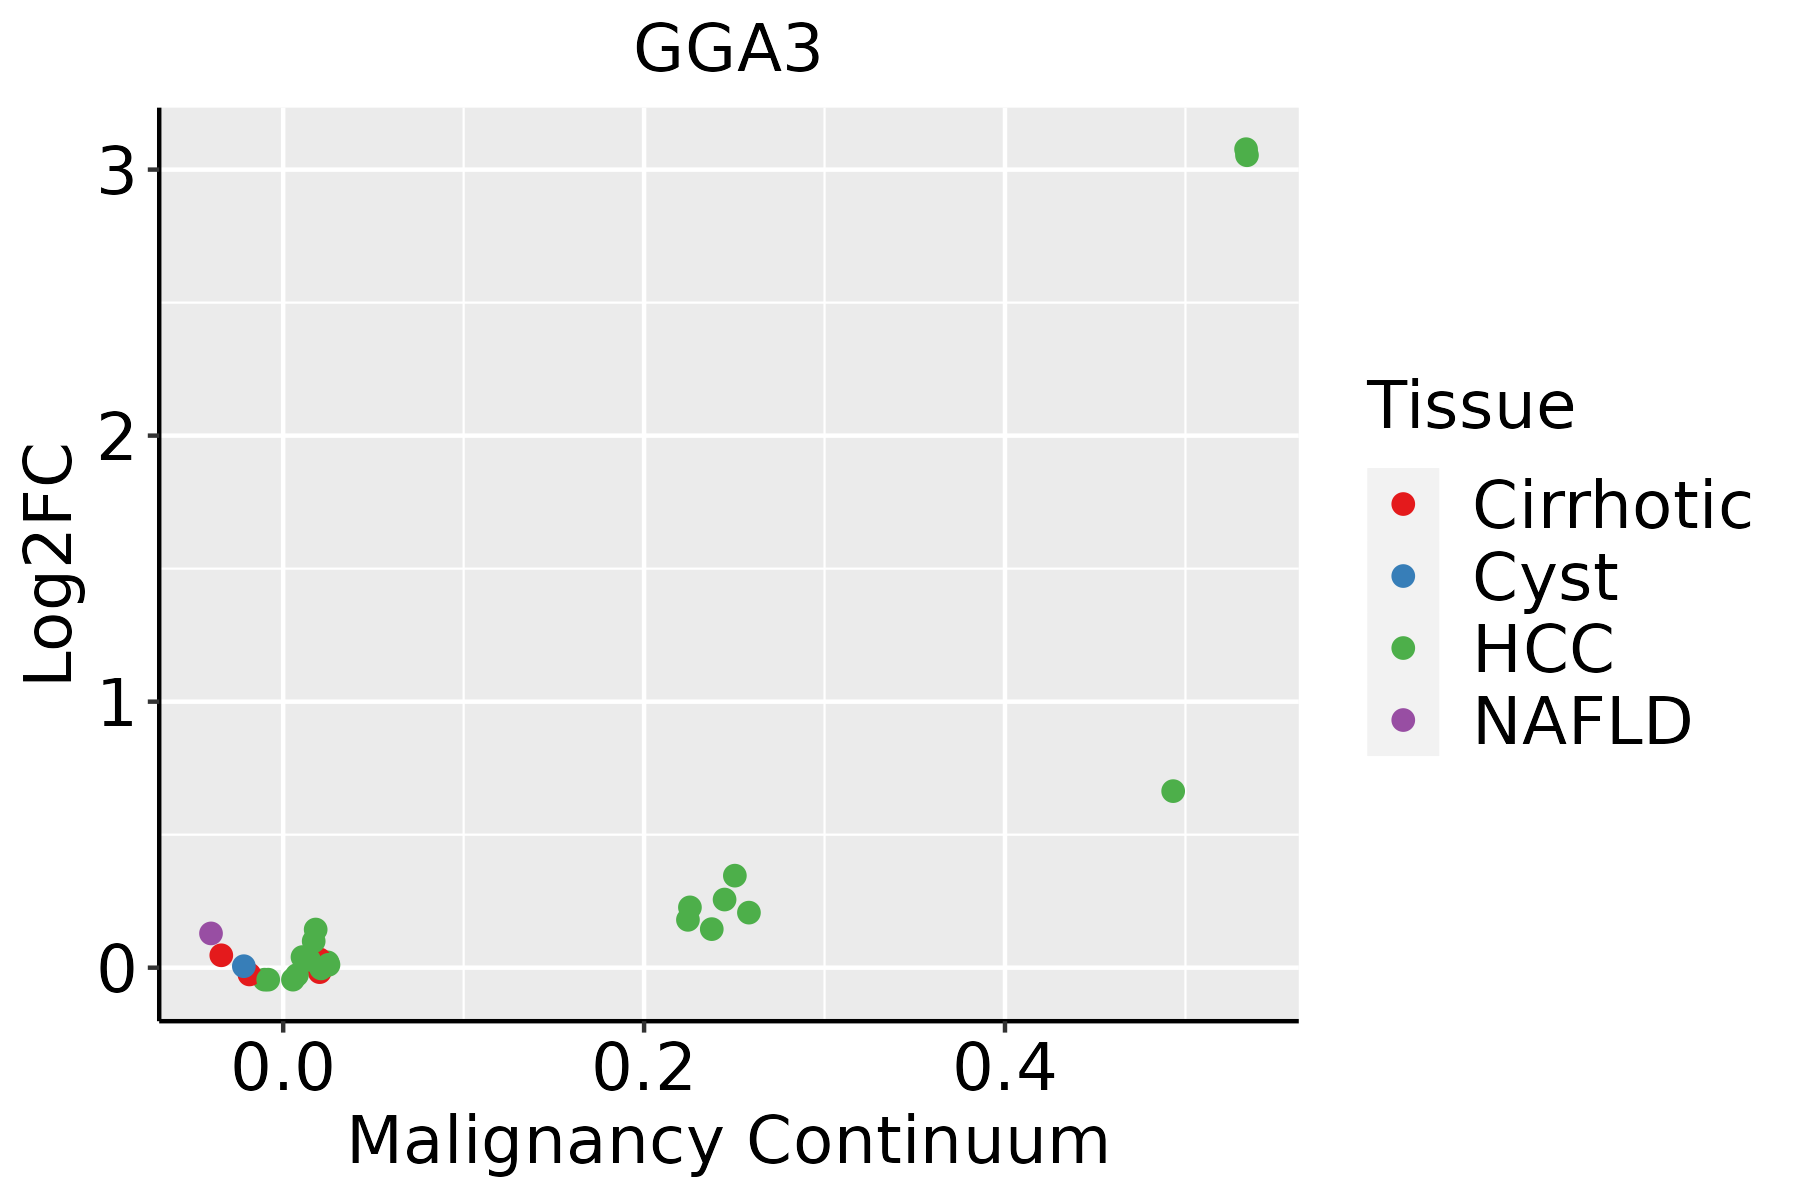 | HCC: Hepatocellular carcinoma |
| NAFLD: Non-alcoholic fatty liver disease |
| ∗log2FC in expression of this searched gene in stem-like cells from each diseased tissue sample relative to stem-like cells in normal samples in each tissue plotted against the malignancy continuum. Samples are colored based on if they are from different disease stage. |
Top |
Malignant transformation related pathway analysis |
| Find out the enriched GO biological processes and KEGG pathways involved in transition from healthy to precancer to cancer |
| Tissue | Disease Stage | Enriched GO biological Processes |
| Colorectum | AD |  |
| Colorectum | SER |  |
| Colorectum | MSS |  |
| Colorectum | MSI-H |  |
| Colorectum | FAP |  |
| ∗Top 15 enriched GO BP terms are showed in the bar plot of each disease state in each tissue. Each row represents a significant GO biological process which is colored according to the -log10(p.adjust). |
| Page: 1 2 3 4 5 6 7 8 9 |
| GO ID | Tissue | Disease Stage | Description | Gene Ratio | Bg Ratio | pvalue | p.adjust | Count |
| GO:007259422 | Liver | HCC | establishment of protein localization to organelle | 299/7958 | 422/18723 | 1.06e-32 | 6.10e-30 | 299 |
| GO:000989622 | Liver | HCC | positive regulation of catabolic process | 335/7958 | 492/18723 | 3.83e-31 | 1.87e-28 | 335 |
| GO:004819321 | Liver | HCC | Golgi vesicle transport | 217/7958 | 296/18723 | 2.58e-27 | 1.02e-24 | 217 |
| GO:004217622 | Liver | HCC | regulation of protein catabolic process | 267/7958 | 391/18723 | 2.45e-25 | 7.38e-23 | 267 |
| GO:003164722 | Liver | HCC | regulation of protein stability | 211/7958 | 298/18723 | 2.29e-23 | 5.01e-21 | 211 |
| GO:000660512 | Liver | HCC | protein targeting | 219/7958 | 314/18723 | 7.74e-23 | 1.49e-20 | 219 |
| GO:004573222 | Liver | HCC | positive regulation of protein catabolic process | 163/7958 | 231/18723 | 4.00e-18 | 4.69e-16 | 163 |
| GO:001619721 | Liver | HCC | endosomal transport | 154/7958 | 230/18723 | 4.74e-14 | 2.95e-12 | 154 |
| GO:009015012 | Liver | HCC | establishment of protein localization to membrane | 168/7958 | 260/18723 | 4.07e-13 | 2.13e-11 | 168 |
| GO:007265921 | Liver | HCC | protein localization to plasma membrane | 177/7958 | 284/18723 | 1.02e-11 | 4.18e-10 | 177 |
| GO:000703421 | Liver | HCC | vacuolar transport | 108/7958 | 157/18723 | 2.22e-11 | 8.69e-10 | 108 |
| GO:199077821 | Liver | HCC | protein localization to cell periphery | 200/7958 | 333/18723 | 6.07e-11 | 2.23e-09 | 200 |
| GO:000689221 | Liver | HCC | post-Golgi vesicle-mediated transport | 77/7958 | 104/18723 | 6.14e-11 | 2.24e-09 | 77 |
| GO:009887621 | Liver | HCC | vesicle-mediated transport to the plasma membrane | 92/7958 | 136/18723 | 2.57e-09 | 7.07e-08 | 92 |
| GO:000704121 | Liver | HCC | lysosomal transport | 76/7958 | 114/18723 | 1.56e-07 | 2.88e-06 | 76 |
| GO:000689321 | Liver | HCC | Golgi to plasma membrane transport | 44/7958 | 60/18723 | 1.24e-06 | 1.81e-05 | 44 |
| GO:007266521 | Liver | HCC | protein localization to vacuole | 48/7958 | 67/18723 | 1.27e-06 | 1.85e-05 | 48 |
| GO:004300121 | Liver | HCC | Golgi to plasma membrane protein transport | 32/7958 | 40/18723 | 1.40e-06 | 2.01e-05 | 32 |
| GO:00066222 | Liver | HCC | protein targeting to lysosome | 20/7958 | 23/18723 | 1.37e-05 | 1.51e-04 | 20 |
| GO:00726662 | Liver | HCC | establishment of protein localization to vacuole | 35/7958 | 49/18723 | 3.90e-05 | 3.85e-04 | 35 |
| Page: 1 2 |
| Pathway ID | Tissue | Disease Stage | Description | Gene Ratio | Bg Ratio | pvalue | p.adjust | qvalue | Count |
| hsa041422 | Liver | HCC | Lysosome | 100/4020 | 132/8465 | 2.32e-11 | 4.31e-10 | 2.40e-10 | 100 |
| hsa041423 | Liver | HCC | Lysosome | 100/4020 | 132/8465 | 2.32e-11 | 4.31e-10 | 2.40e-10 | 100 |
| Page: 1 |
Top |
Cell-cell communication analysis |
| Identification of potential cell-cell interactions between two cell types and their ligand-receptor pairs for different disease states |
| Ligand | Receptor | LRpair | Pathway | Tissue | Disease Stage |
| Page: 1 |
Top |
Single-cell gene regulatory network inference analysis |
| Find out the significant the regulons (TFs) and the target genes of each regulon across cell types for different disease states |
| TF | Cell Type | Tissue | Disease Stage | Target Gene | RSS | Regulon Activity |
| ∗The dot plots of a searched regulon are shown for all cell subpopulations in each disease state of each tissue based on the regulon specific score inferred using pySCENIC and by calculating the average expression. |
| Page: 1 |
Top |
Somatic mutation of malignant transformation related genes |
| Annotation of somatic variants for genes involved in malignant transformation |
| Hugo Symbol | Variant Class | Variant Classification | dbSNP RS | HGVSc | HGVSp | HGVSp Short | SWISSPROT | BIOTYPE | SIFT | PolyPhen | Tumor Sample Barcode | Tissue | Histology | Sex | Age | Stage | Therapy Types | Drugs | Outcome |
| GGA3 | SNV | Missense_Mutation | c.139N>T | p.Val47Phe | p.V47F | Q9NZ52 | protein_coding | deleterious(0) | probably_damaging(0.998) | TCGA-A8-A06X-01 | Breast | breast invasive carcinoma | Female | >=65 | I/II | Unknown | Unknown | SD | |
| GGA3 | SNV | Missense_Mutation | c.1290N>A | p.Phe430Leu | p.F430L | Q9NZ52 | protein_coding | tolerated(0.21) | benign(0.049) | TCGA-AC-A23H-01 | Breast | breast invasive carcinoma | Female | >=65 | I/II | Unknown | Unknown | PD | |
| GGA3 | SNV | Missense_Mutation | novel | c.241N>A | p.His81Asn | p.H81N | Q9NZ52 | protein_coding | deleterious(0) | probably_damaging(0.987) | TCGA-AN-A046-01 | Breast | breast invasive carcinoma | Female | >=65 | I/II | Unknown | Unknown | SD |
| GGA3 | SNV | Missense_Mutation | rs779436228 | c.1685T>C | p.Phe562Ser | p.F562S | Q9NZ52 | protein_coding | tolerated(0.35) | benign(0.014) | TCGA-BH-A0AU-01 | Breast | breast invasive carcinoma | Female | <65 | I/II | Unknown | Unknown | SD |
| GGA3 | SNV | Missense_Mutation | novel | c.478C>T | p.Pro160Ser | p.P160S | Q9NZ52 | protein_coding | deleterious(0.05) | benign(0.406) | TCGA-OL-A66N-01 | Breast | breast invasive carcinoma | Female | <65 | III/IV | Unknown | Unknown | SD |
| GGA3 | deletion | Frame_Shift_Del | c.310delN | p.Asp104ThrfsTer7 | p.D104Tfs*7 | Q9NZ52 | protein_coding | TCGA-D8-A1J8-01 | Breast | breast invasive carcinoma | Female | >=65 | I/II | Hormone Therapy | nolvadex | SD | |||
| GGA3 | SNV | Missense_Mutation | novel | c.1575N>T | p.Glu525Asp | p.E525D | Q9NZ52 | protein_coding | tolerated(0.2) | benign(0.001) | TCGA-2W-A8YY-01 | Cervix | cervical & endocervical cancer | Female | <65 | I/II | Chemotherapy | cisplatin | CR |
| GGA3 | SNV | Missense_Mutation | c.906N>G | p.Ile302Met | p.I302M | Q9NZ52 | protein_coding | deleterious(0.04) | benign(0.114) | TCGA-C5-A1BQ-01 | Cervix | cervical & endocervical cancer | Female | >=65 | III/IV | Chemotherapy | cisplatin | CR | |
| GGA3 | SNV | Missense_Mutation | rs372068946 | c.514N>A | p.Glu172Lys | p.E172K | Q9NZ52 | protein_coding | deleterious(0) | probably_damaging(0.997) | TCGA-FU-A40J-01 | Cervix | cervical & endocervical cancer | Female | <65 | III/IV | Chemotherapy | carboplatin | CR |
| GGA3 | SNV | Missense_Mutation | rs750932108 | c.1112N>G | p.Ser371Cys | p.S371C | Q9NZ52 | protein_coding | deleterious(0.05) | possibly_damaging(0.72) | TCGA-Q1-A73O-01 | Cervix | cervical & endocervical cancer | Female | <65 | I/II | Chemotherapy | cisplatin | CR |
| Page: 1 2 3 4 5 6 |
Top |
Related drugs of malignant transformation related genes |
| Identification of chemicals and drugs interact with genes involved in malignant transfromation |
| (DGIdb 4.0) |
| Entrez ID | Symbol | Category | Interaction Types | Drug Claim Name | Drug Name | PMIDs |
| Page: 1 |

Copyright 2023-Present -The University of Texas Health Science Center at Houston |