
|
|||||
|
 | |
| |
| |
| |
| |
| |
|
Gene: GGA2 |
Gene summary for GGA2 |
| Gene information | Species | Human | Gene symbol | GGA2 | Gene ID | 23062 |
| Gene name | golgi associated, gamma adaptin ear containing, ARF binding protein 2 | |
| Gene Alias | VEAR | |
| Cytomap | 16p12.2 | |
| Gene Type | protein-coding | GO ID | GO:0006810 | UniProtAcc | Q9UJY4 |
Top |
Malignant transformation analysis |
| Identification of the aberrant gene expression in precancerous and cancerous lesions by comparing the gene expression of stem-like cells in diseased tissues with normal stem cells |
| Entrez ID | Symbol | Replicates | Species | Organ | Tissue | Adj P-value | Log2FC | Malignancy |
| 23062 | GGA2 | LZE4T | Human | Esophagus | ESCC | 1.34e-06 | 1.65e-01 | 0.0811 |
| 23062 | GGA2 | LZE7T | Human | Esophagus | ESCC | 5.35e-05 | 3.00e-01 | 0.0667 |
| 23062 | GGA2 | LZE21D1 | Human | Esophagus | HGIN | 4.55e-03 | 3.10e-01 | 0.0632 |
| 23062 | GGA2 | LZE24T | Human | Esophagus | ESCC | 5.04e-04 | 1.51e-01 | 0.0596 |
| 23062 | GGA2 | LZE21T | Human | Esophagus | ESCC | 3.57e-02 | 1.62e-01 | 0.0655 |
| 23062 | GGA2 | P1T-E | Human | Esophagus | ESCC | 2.97e-04 | 3.80e-01 | 0.0875 |
| 23062 | GGA2 | P2T-E | Human | Esophagus | ESCC | 6.98e-27 | 5.48e-01 | 0.1177 |
| 23062 | GGA2 | P4T-E | Human | Esophagus | ESCC | 3.06e-09 | 2.54e-01 | 0.1323 |
| 23062 | GGA2 | P5T-E | Human | Esophagus | ESCC | 1.07e-08 | 1.52e-01 | 0.1327 |
| 23062 | GGA2 | P8T-E | Human | Esophagus | ESCC | 1.04e-14 | 2.62e-01 | 0.0889 |
| 23062 | GGA2 | P9T-E | Human | Esophagus | ESCC | 4.76e-16 | 1.87e-01 | 0.1131 |
| 23062 | GGA2 | P10T-E | Human | Esophagus | ESCC | 9.57e-12 | 2.77e-01 | 0.116 |
| 23062 | GGA2 | P11T-E | Human | Esophagus | ESCC | 1.01e-08 | 3.51e-01 | 0.1426 |
| 23062 | GGA2 | P12T-E | Human | Esophagus | ESCC | 7.74e-22 | 5.09e-01 | 0.1122 |
| 23062 | GGA2 | P15T-E | Human | Esophagus | ESCC | 3.59e-18 | 3.70e-01 | 0.1149 |
| 23062 | GGA2 | P16T-E | Human | Esophagus | ESCC | 2.31e-15 | 3.05e-01 | 0.1153 |
| 23062 | GGA2 | P17T-E | Human | Esophagus | ESCC | 1.08e-04 | 1.54e-01 | 0.1278 |
| 23062 | GGA2 | P20T-E | Human | Esophagus | ESCC | 1.56e-10 | 2.48e-01 | 0.1124 |
| 23062 | GGA2 | P21T-E | Human | Esophagus | ESCC | 3.79e-11 | 2.24e-01 | 0.1617 |
| 23062 | GGA2 | P22T-E | Human | Esophagus | ESCC | 1.22e-19 | 2.92e-01 | 0.1236 |
| Page: 1 2 3 4 5 6 |
| Tissue | Expression Dynamics | Abbreviation |
| Esophagus |  | ESCC: Esophageal squamous cell carcinoma |
| HGIN: High-grade intraepithelial neoplasias | ||
| LGIN: Low-grade intraepithelial neoplasias | ||
| Oral Cavity |  | EOLP: Erosive Oral lichen planus |
| LP: leukoplakia | ||
| NEOLP: Non-erosive oral lichen planus | ||
| OSCC: Oral squamous cell carcinoma | ||
| Prostate | 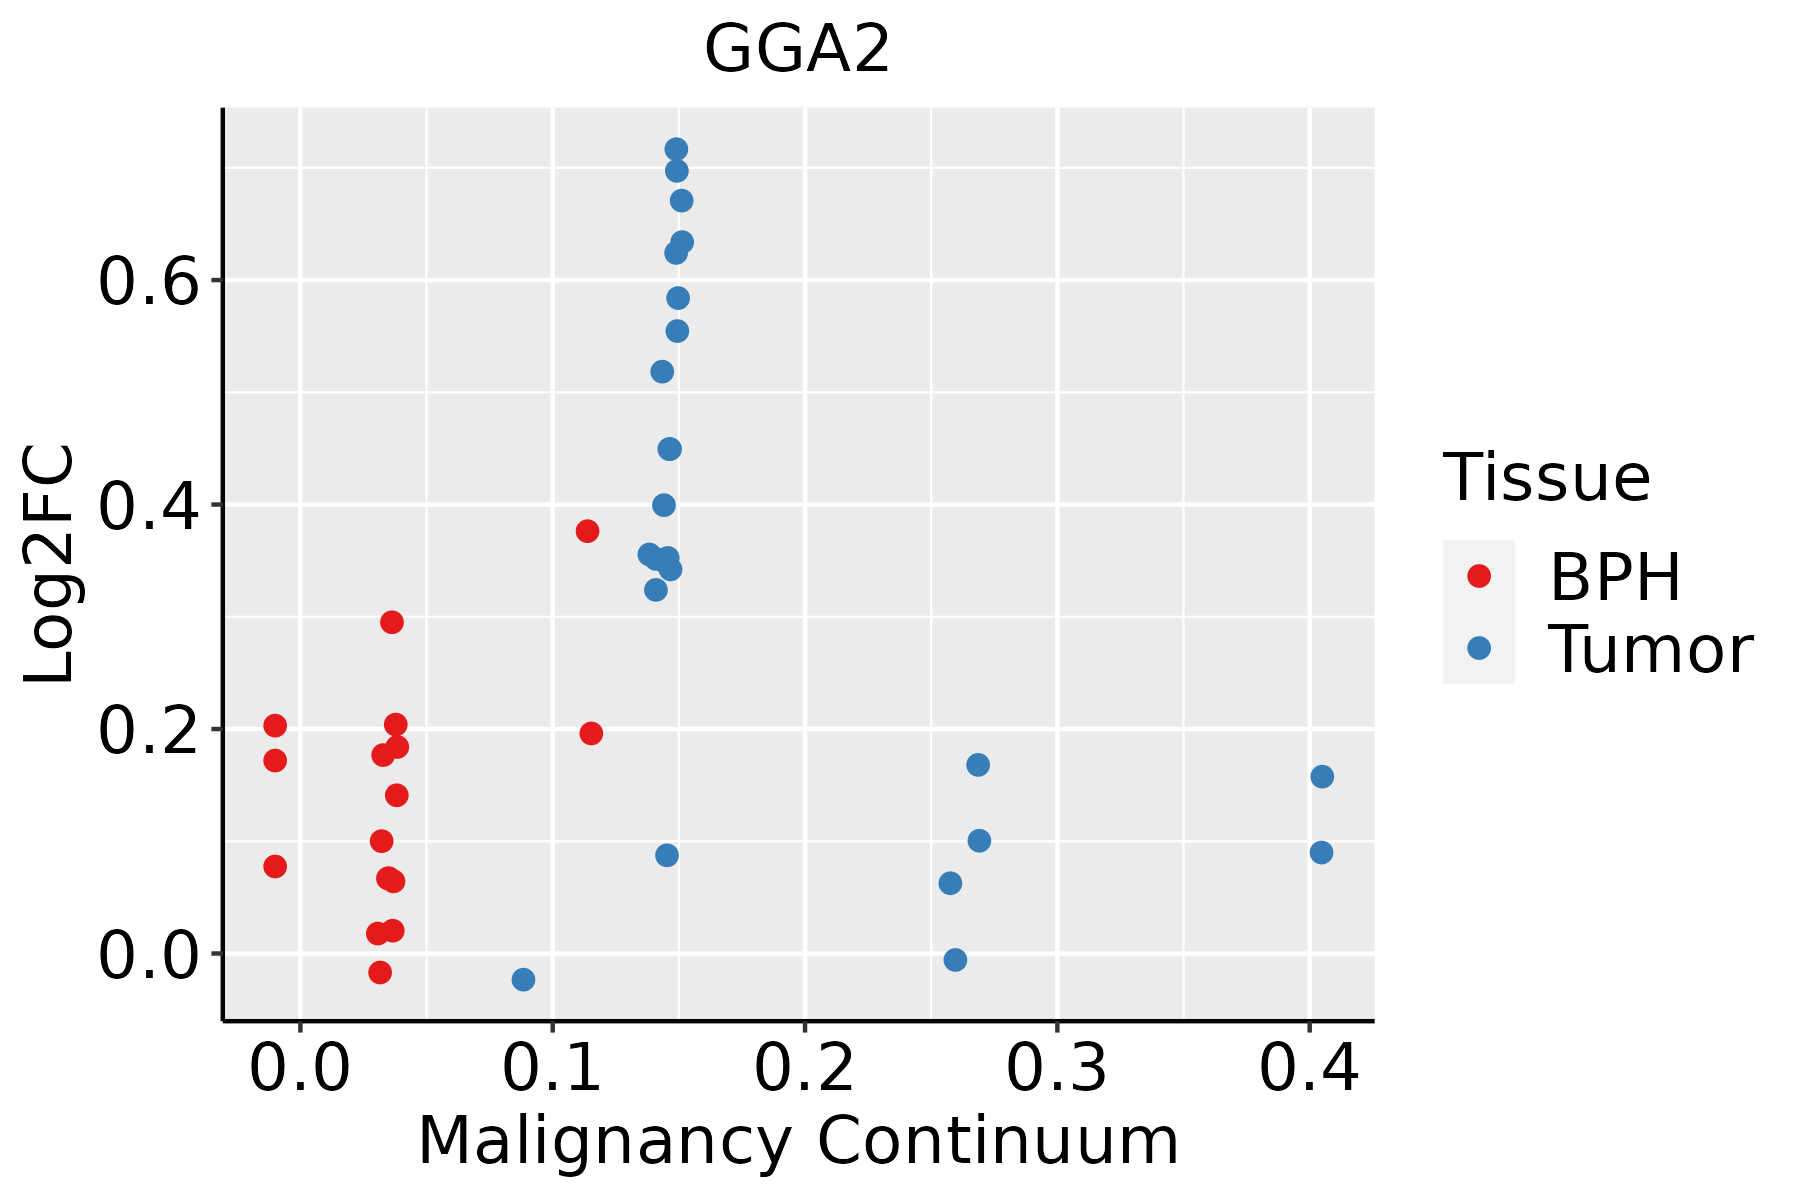 | BPH: Benign Prostatic Hyperplasia |
| Thyroid |  | ATC: Anaplastic thyroid cancer |
| HT: Hashimoto's thyroiditis | ||
| PTC: Papillary thyroid cancer |
| ∗log2FC in expression of this searched gene in stem-like cells from each diseased tissue sample relative to stem-like cells in normal samples in each tissue plotted against the malignancy continuum. Samples are colored based on if they are from different disease stage. |
Top |
Malignant transformation related pathway analysis |
| Find out the enriched GO biological processes and KEGG pathways involved in transition from healthy to precancer to cancer |
| Tissue | Disease Stage | Enriched GO biological Processes |
| Colorectum | AD |  |
| Colorectum | SER |  |
| Colorectum | MSS |  |
| Colorectum | MSI-H |  |
| Colorectum | FAP |  |
| ∗Top 15 enriched GO BP terms are showed in the bar plot of each disease state in each tissue. Each row represents a significant GO biological process which is colored according to the -log10(p.adjust). |
| Page: 1 2 3 4 5 6 7 8 9 |
| GO ID | Tissue | Disease Stage | Description | Gene Ratio | Bg Ratio | pvalue | p.adjust | Count |
| GO:004819317 | Esophagus | HGIN | Golgi vesicle transport | 83/2587 | 296/18723 | 8.59e-11 | 8.89e-09 | 83 |
| GO:009015020 | Esophagus | HGIN | establishment of protein localization to membrane | 67/2587 | 260/18723 | 1.96e-07 | 9.57e-06 | 67 |
| GO:007265920 | Esophagus | HGIN | protein localization to plasma membrane | 66/2587 | 284/18723 | 1.11e-05 | 3.18e-04 | 66 |
| GO:009887610 | Esophagus | HGIN | vesicle-mediated transport to the plasma membrane | 36/2587 | 136/18723 | 6.76e-05 | 1.55e-03 | 36 |
| GO:199077818 | Esophagus | HGIN | protein localization to cell periphery | 71/2587 | 333/18723 | 1.05e-04 | 2.24e-03 | 71 |
| GO:000689210 | Esophagus | HGIN | post-Golgi vesicle-mediated transport | 26/2587 | 104/18723 | 1.63e-03 | 1.81e-02 | 26 |
| GO:00430019 | Esophagus | HGIN | Golgi to plasma membrane protein transport | 13/2587 | 40/18723 | 2.04e-03 | 2.13e-02 | 13 |
| GO:00068939 | Esophagus | HGIN | Golgi to plasma membrane transport | 17/2587 | 60/18723 | 2.46e-03 | 2.45e-02 | 17 |
| GO:00619519 | Esophagus | HGIN | establishment of protein localization to plasma membrane | 17/2587 | 60/18723 | 2.46e-03 | 2.45e-02 | 17 |
| GO:004819318 | Esophagus | ESCC | Golgi vesicle transport | 231/8552 | 296/18723 | 1.82e-30 | 9.63e-28 | 231 |
| GO:0090150110 | Esophagus | ESCC | establishment of protein localization to membrane | 182/8552 | 260/18723 | 1.27e-15 | 8.19e-14 | 182 |
| GO:0072659110 | Esophagus | ESCC | protein localization to plasma membrane | 193/8552 | 284/18723 | 1.95e-14 | 1.03e-12 | 193 |
| GO:199077819 | Esophagus | ESCC | protein localization to cell periphery | 217/8552 | 333/18723 | 4.08e-13 | 1.88e-11 | 217 |
| GO:000689215 | Esophagus | ESCC | post-Golgi vesicle-mediated transport | 82/8552 | 104/18723 | 4.00e-12 | 1.55e-10 | 82 |
| GO:009887615 | Esophagus | ESCC | vesicle-mediated transport to the plasma membrane | 99/8552 | 136/18723 | 1.13e-10 | 3.39e-09 | 99 |
| GO:000689315 | Esophagus | ESCC | Golgi to plasma membrane transport | 48/8552 | 60/18723 | 5.11e-08 | 9.16e-07 | 48 |
| GO:004300114 | Esophagus | ESCC | Golgi to plasma membrane protein transport | 34/8552 | 40/18723 | 3.00e-07 | 4.27e-06 | 34 |
| GO:006195114 | Esophagus | ESCC | establishment of protein localization to plasma membrane | 44/8552 | 60/18723 | 1.25e-05 | 1.15e-04 | 44 |
| GO:004819315 | Oral cavity | OSCC | Golgi vesicle transport | 209/7305 | 296/18723 | 1.39e-28 | 6.30e-26 | 209 |
| GO:009015018 | Oral cavity | OSCC | establishment of protein localization to membrane | 163/7305 | 260/18723 | 7.13e-15 | 4.47e-13 | 163 |
| Page: 1 2 3 4 |
| Pathway ID | Tissue | Disease Stage | Description | Gene Ratio | Bg Ratio | pvalue | p.adjust | qvalue | Count |
| hsa041426 | Esophagus | HGIN | Lysosome | 33/1383 | 132/8465 | 6.65e-03 | 4.37e-02 | 3.47e-02 | 33 |
| hsa0414213 | Esophagus | HGIN | Lysosome | 33/1383 | 132/8465 | 6.65e-03 | 4.37e-02 | 3.47e-02 | 33 |
| hsa0414222 | Esophagus | ESCC | Lysosome | 102/4205 | 132/8465 | 5.11e-11 | 7.13e-10 | 3.65e-10 | 102 |
| hsa0414232 | Esophagus | ESCC | Lysosome | 102/4205 | 132/8465 | 5.11e-11 | 7.13e-10 | 3.65e-10 | 102 |
| hsa041425 | Oral cavity | OSCC | Lysosome | 87/3704 | 132/8465 | 1.97e-07 | 1.35e-06 | 6.86e-07 | 87 |
| hsa0414212 | Oral cavity | OSCC | Lysosome | 87/3704 | 132/8465 | 1.97e-07 | 1.35e-06 | 6.86e-07 | 87 |
| hsa0414221 | Oral cavity | LP | Lysosome | 67/2418 | 132/8465 | 5.13e-08 | 7.77e-07 | 5.01e-07 | 67 |
| hsa0414231 | Oral cavity | LP | Lysosome | 67/2418 | 132/8465 | 5.13e-08 | 7.77e-07 | 5.01e-07 | 67 |
| Page: 1 |
Top |
Cell-cell communication analysis |
| Identification of potential cell-cell interactions between two cell types and their ligand-receptor pairs for different disease states |
| Ligand | Receptor | LRpair | Pathway | Tissue | Disease Stage |
| Page: 1 |
Top |
Single-cell gene regulatory network inference analysis |
| Find out the significant the regulons (TFs) and the target genes of each regulon across cell types for different disease states |
| TF | Cell Type | Tissue | Disease Stage | Target Gene | RSS | Regulon Activity |
| ∗The dot plots of a searched regulon are shown for all cell subpopulations in each disease state of each tissue based on the regulon specific score inferred using pySCENIC and by calculating the average expression. |
| Page: 1 |
Top |
Somatic mutation of malignant transformation related genes |
| Annotation of somatic variants for genes involved in malignant transformation |
| Hugo Symbol | Variant Class | Variant Classification | dbSNP RS | HGVSc | HGVSp | HGVSp Short | SWISSPROT | BIOTYPE | SIFT | PolyPhen | Tumor Sample Barcode | Tissue | Histology | Sex | Age | Stage | Therapy Types | Drugs | Outcome |
| GGA2 | SNV | Missense_Mutation | c.1070N>A | p.Gly357Glu | p.G357E | Q9UJY4 | protein_coding | tolerated(0.2) | benign(0.297) | TCGA-A8-A0A7-01 | Breast | breast invasive carcinoma | Female | <65 | I/II | Unknown | Unknown | SD | |
| GGA2 | SNV | Missense_Mutation | c.919N>A | p.Val307Ile | p.V307I | Q9UJY4 | protein_coding | tolerated(1) | probably_damaging(0.91) | TCGA-B6-A0I8-01 | Breast | breast invasive carcinoma | Female | <65 | I/II | Unknown | Unknown | PD | |
| GGA2 | SNV | Missense_Mutation | c.595C>G | p.Leu199Val | p.L199V | Q9UJY4 | protein_coding | deleterious(0.01) | probably_damaging(0.994) | TCGA-C5-A2LX-01 | Cervix | cervical & endocervical cancer | Female | <65 | I/II | Chemotherapy | cisplatin | SD | |
| GGA2 | SNV | Missense_Mutation | novel | c.296G>T | p.Ser99Ile | p.S99I | Q9UJY4 | protein_coding | deleterious(0.01) | possibly_damaging(0.446) | TCGA-MA-AA42-01 | Cervix | cervical & endocervical cancer | Female | >=65 | I/II | Unknown | Unknown | SD |
| GGA2 | SNV | Missense_Mutation | c.1364N>C | p.Trp455Ser | p.W455S | Q9UJY4 | protein_coding | tolerated(0.46) | benign(0.028) | TCGA-WL-A834-01 | Cervix | cervical & endocervical cancer | Female | <65 | I/II | Chemotherapy | paclitaxel | SD | |
| GGA2 | SNV | Missense_Mutation | c.1741N>T | p.Arg581Cys | p.R581C | Q9UJY4 | protein_coding | deleterious(0) | probably_damaging(0.973) | TCGA-A6-2686-01 | Colorectum | colon adenocarcinoma | Female | >=65 | I/II | Unknown | Unknown | SD | |
| GGA2 | SNV | Missense_Mutation | c.910N>G | p.Thr304Ala | p.T304A | Q9UJY4 | protein_coding | deleterious(0.01) | probably_damaging(0.972) | TCGA-A6-5665-01 | Colorectum | colon adenocarcinoma | Female | >=65 | I/II | Unknown | Unknown | PD | |
| GGA2 | SNV | Missense_Mutation | novel | c.353A>G | p.Tyr118Cys | p.Y118C | Q9UJY4 | protein_coding | deleterious(0) | probably_damaging(1) | TCGA-AA-3510-01 | Colorectum | colon adenocarcinoma | Male | >=65 | I/II | Unknown | Unknown | SD |
| GGA2 | SNV | Missense_Mutation | rs751749491 | c.833N>T | p.Thr278Met | p.T278M | Q9UJY4 | protein_coding | tolerated(0.1) | possibly_damaging(0.73) | TCGA-AA-3877-01 | Colorectum | colon adenocarcinoma | Female | >=65 | I/II | Unknown | Unknown | SD |
| GGA2 | SNV | Missense_Mutation | rs752791823 | c.325N>A | p.Glu109Lys | p.E109K | Q9UJY4 | protein_coding | deleterious(0) | probably_damaging(1) | TCGA-AA-A00N-01 | Colorectum | colon adenocarcinoma | Male | >=65 | I/II | Unknown | Unknown | PD |
| Page: 1 2 3 4 5 |
Top |
Related drugs of malignant transformation related genes |
| Identification of chemicals and drugs interact with genes involved in malignant transfromation |
| (DGIdb 4.0) |
| Entrez ID | Symbol | Category | Interaction Types | Drug Claim Name | Drug Name | PMIDs |
| Page: 1 |

Copyright 2023-Present -The University of Texas Health Science Center at Houston |