
|
|||||
|
 | |
| |
| |
| |
| |
| |
|
Gene: GFRA3 |
Gene summary for GFRA3 |
| Gene information | Species | Human | Gene symbol | GFRA3 | Gene ID | 2676 |
| Gene name | GDNF family receptor alpha 3 | |
| Gene Alias | GDNFR3 | |
| Cytomap | 5q31.2 | |
| Gene Type | protein-coding | GO ID | GO:0000902 | UniProtAcc | O60609 |
Top |
Malignant transformation analysis |
| Identification of the aberrant gene expression in precancerous and cancerous lesions by comparing the gene expression of stem-like cells in diseased tissues with normal stem cells |
| Entrez ID | Symbol | Replicates | Species | Organ | Tissue | Adj P-value | Log2FC | Malignancy |
| 2676 | GFRA3 | LZE4T | Human | Esophagus | ESCC | 1.20e-04 | 1.72e-01 | 0.0811 |
| 2676 | GFRA3 | P4T-E | Human | Esophagus | ESCC | 3.85e-16 | 5.13e-01 | 0.1323 |
| 2676 | GFRA3 | P5T-E | Human | Esophagus | ESCC | 1.62e-13 | 3.59e-01 | 0.1327 |
| 2676 | GFRA3 | P8T-E | Human | Esophagus | ESCC | 9.07e-107 | 3.08e+00 | 0.0889 |
| 2676 | GFRA3 | P11T-E | Human | Esophagus | ESCC | 7.73e-16 | 1.03e+00 | 0.1426 |
| 2676 | GFRA3 | P15T-E | Human | Esophagus | ESCC | 2.13e-05 | 2.31e-01 | 0.1149 |
| 2676 | GFRA3 | P16T-E | Human | Esophagus | ESCC | 2.03e-09 | 2.53e-01 | 0.1153 |
| 2676 | GFRA3 | P19T-E | Human | Esophagus | ESCC | 7.97e-13 | 1.98e+00 | 0.1662 |
| 2676 | GFRA3 | P24T-E | Human | Esophagus | ESCC | 3.75e-03 | 2.01e-01 | 0.1287 |
| 2676 | GFRA3 | P26T-E | Human | Esophagus | ESCC | 1.97e-10 | 2.33e-01 | 0.1276 |
| 2676 | GFRA3 | P27T-E | Human | Esophagus | ESCC | 2.02e-06 | 2.43e-01 | 0.1055 |
| 2676 | GFRA3 | P32T-E | Human | Esophagus | ESCC | 4.31e-06 | 3.11e-01 | 0.1666 |
| 2676 | GFRA3 | P44T-E | Human | Esophagus | ESCC | 7.53e-03 | 2.97e-01 | 0.1096 |
| 2676 | GFRA3 | P47T-E | Human | Esophagus | ESCC | 3.97e-04 | 1.97e-01 | 0.1067 |
| 2676 | GFRA3 | P61T-E | Human | Esophagus | ESCC | 3.11e-12 | 4.20e-01 | 0.099 |
| 2676 | GFRA3 | P74T-E | Human | Esophagus | ESCC | 2.89e-15 | 4.01e-01 | 0.1479 |
| 2676 | GFRA3 | P75T-E | Human | Esophagus | ESCC | 1.96e-05 | 1.77e-01 | 0.1125 |
| 2676 | GFRA3 | P76T-E | Human | Esophagus | ESCC | 1.96e-05 | 1.59e-01 | 0.1207 |
| 2676 | GFRA3 | P107T-E | Human | Esophagus | ESCC | 1.01e-07 | 3.59e-01 | 0.171 |
| 2676 | GFRA3 | P128T-E | Human | Esophagus | ESCC | 1.37e-04 | 2.26e-01 | 0.1241 |
| Page: 1 2 |
| Tissue | Expression Dynamics | Abbreviation |
| Esophagus | 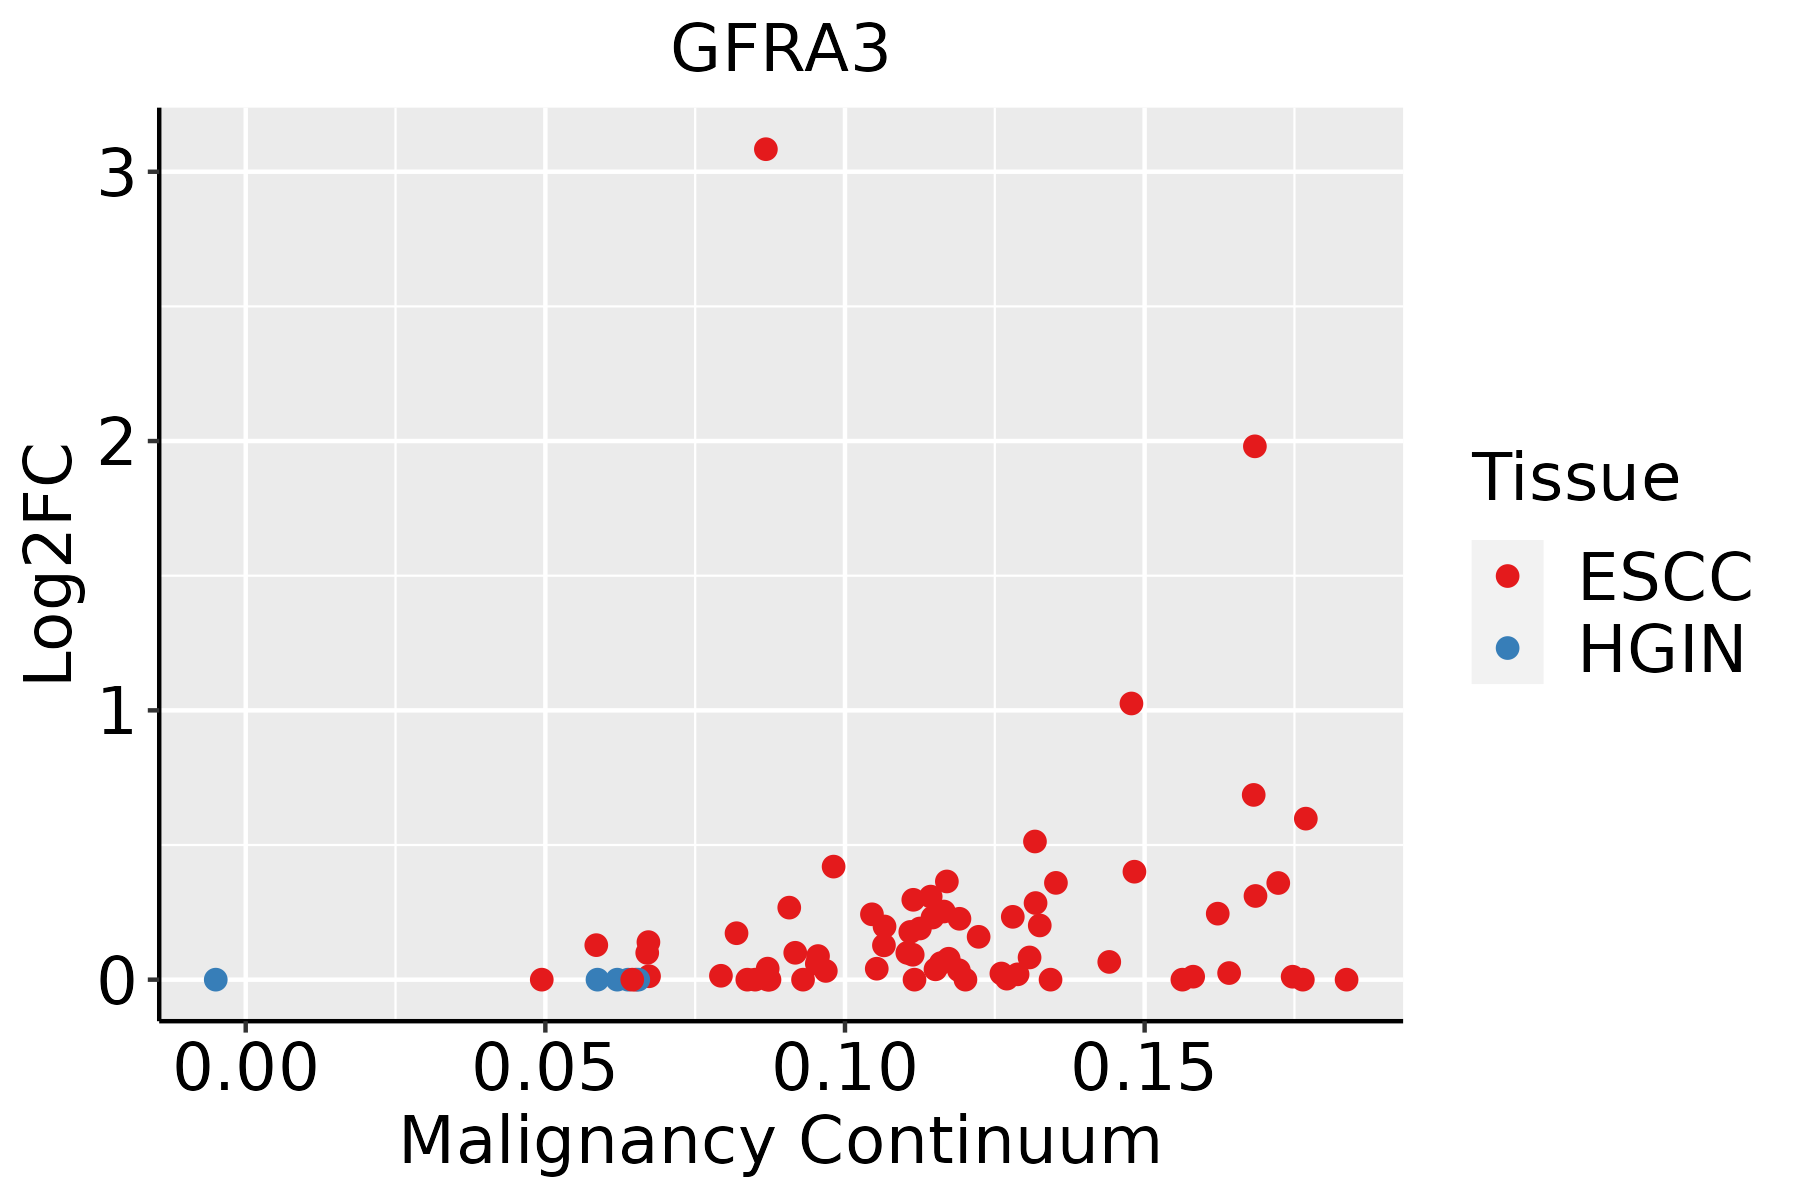 | ESCC: Esophageal squamous cell carcinoma |
| HGIN: High-grade intraepithelial neoplasias | ||
| LGIN: Low-grade intraepithelial neoplasias |
| ∗log2FC in expression of this searched gene in stem-like cells from each diseased tissue sample relative to stem-like cells in normal samples in each tissue plotted against the malignancy continuum. Samples are colored based on if they are from different disease stage. |
Top |
Malignant transformation related pathway analysis |
| Find out the enriched GO biological processes and KEGG pathways involved in transition from healthy to precancer to cancer |
| Tissue | Disease Stage | Enriched GO biological Processes |
| Colorectum | AD |  |
| Colorectum | SER |  |
| Colorectum | MSS |  |
| Colorectum | MSI-H |  |
| Colorectum | FAP |  |
| ∗Top 15 enriched GO BP terms are showed in the bar plot of each disease state in each tissue. Each row represents a significant GO biological process which is colored according to the -log10(p.adjust). |
| Page: 1 2 3 4 5 6 7 8 9 |
| GO ID | Tissue | Disease Stage | Description | Gene Ratio | Bg Ratio | pvalue | p.adjust | Count |
| GO:006156415 | Esophagus | ESCC | axon development | 251/8552 | 467/18723 | 2.41e-04 | 1.49e-03 | 251 |
| GO:000740915 | Esophagus | ESCC | axonogenesis | 219/8552 | 418/18723 | 3.14e-03 | 1.31e-02 | 219 |
| Page: 1 |
| Pathway ID | Tissue | Disease Stage | Description | Gene Ratio | Bg Ratio | pvalue | p.adjust | qvalue | Count |
| Page: 1 |
Top |
Cell-cell communication analysis |
| Identification of potential cell-cell interactions between two cell types and their ligand-receptor pairs for different disease states |
| Ligand | Receptor | LRpair | Pathway | Tissue | Disease Stage |
| Page: 1 |
Top |
Single-cell gene regulatory network inference analysis |
| Find out the significant the regulons (TFs) and the target genes of each regulon across cell types for different disease states |
| TF | Cell Type | Tissue | Disease Stage | Target Gene | RSS | Regulon Activity |
| ∗The dot plots of a searched regulon are shown for all cell subpopulations in each disease state of each tissue based on the regulon specific score inferred using pySCENIC and by calculating the average expression. |
| Page: 1 |
Top |
Somatic mutation of malignant transformation related genes |
| Annotation of somatic variants for genes involved in malignant transformation |
| Hugo Symbol | Variant Class | Variant Classification | dbSNP RS | HGVSc | HGVSp | HGVSp Short | SWISSPROT | BIOTYPE | SIFT | PolyPhen | Tumor Sample Barcode | Tissue | Histology | Sex | Age | Stage | Therapy Types | Drugs | Outcome |
| GFRA3 | SNV | Missense_Mutation | c.364N>T | p.Arg122Cys | p.R122C | O60609 | protein_coding | deleterious(0.03) | possibly_damaging(0.498) | TCGA-A8-A08P-01 | Breast | breast invasive carcinoma | Female | >=65 | III/IV | Chemotherapy | 5-fluorouracil | CR | |
| GFRA3 | SNV | Missense_Mutation | novel | c.290N>A | p.Ser97Tyr | p.S97Y | O60609 | protein_coding | deleterious(0.04) | probably_damaging(0.998) | TCGA-AN-A046-01 | Breast | breast invasive carcinoma | Female | >=65 | I/II | Unknown | Unknown | SD |
| GFRA3 | SNV | Missense_Mutation | novel | c.450C>A | p.Ser150Arg | p.S150R | O60609 | protein_coding | tolerated(0.09) | benign(0.003) | TCGA-E2-A15I-01 | Breast | breast invasive carcinoma | Female | <65 | I/II | Hormone Therapy | tamoxiphen | SD |
| GFRA3 | insertion | Frame_Shift_Ins | novel | c.99_100insAT | p.Leu34IlefsTer9 | p.L34Ifs*9 | O60609 | protein_coding | TCGA-B6-A0IE-01 | Breast | breast invasive carcinoma | Female | <65 | III/IV | Unknown | Unknown | PD | ||
| GFRA3 | insertion | In_Frame_Ins | novel | c.231_232insATCTTACAGGGAAGGCAAAGAATGATT | p.Ser77_Glu78insIleLeuGlnGlyArgGlnArgMetIle | p.S77_E78insILQGRQRMI | O60609 | protein_coding | TCGA-BH-A0AY-01 | Breast | breast invasive carcinoma | Female | <65 | I/II | Chemotherapy | SD | |||
| GFRA3 | SNV | Missense_Mutation | c.791G>A | p.Arg264His | p.R264H | O60609 | protein_coding | tolerated(0.06) | probably_damaging(0.998) | TCGA-C5-A2M2-01 | Cervix | cervical & endocervical cancer | Female | <65 | I/II | Unknown | Unknown | SD | |
| GFRA3 | SNV | Missense_Mutation | c.689N>A | p.Arg230His | p.R230H | O60609 | protein_coding | deleterious(0) | probably_damaging(0.999) | TCGA-DS-A7WF-01 | Cervix | cervical & endocervical cancer | Female | <65 | I/II | Chemotherapy | cisplatin | PD | |
| GFRA3 | SNV | Missense_Mutation | c.359T>C | p.Val120Ala | p.V120A | O60609 | protein_coding | deleterious(0) | benign(0.039) | TCGA-EK-A2R9-01 | Cervix | cervical & endocervical cancer | Female | <65 | I/II | Unknown | Unknown | SD | |
| GFRA3 | SNV | Missense_Mutation | novel | c.845N>T | p.Ala282Val | p.A282V | O60609 | protein_coding | tolerated(0.19) | benign(0.012) | TCGA-VS-A8Q8-01 | Cervix | cervical & endocervical cancer | Female | <65 | I/II | Unknown | Unknown | PD |
| GFRA3 | SNV | Missense_Mutation | novel | c.70T>A | p.Ser24Thr | p.S24T | O60609 | protein_coding | tolerated(1) | benign(0.003) | TCGA-CK-4951-01 | Colorectum | colon adenocarcinoma | Female | >=65 | I/II | Unknown | Unknown | PD |
| Page: 1 2 3 4 5 |
Top |
Related drugs of malignant transformation related genes |
| Identification of chemicals and drugs interact with genes involved in malignant transfromation |
| (DGIdb 4.0) |
| Entrez ID | Symbol | Category | Interaction Types | Drug Claim Name | Drug Name | PMIDs |
| 2676 | GFRA3 | EXTERNAL SIDE OF PLASMA MEMBRANE, KINASE, DRUGGABLE GENOME | Neublastin |
| Page: 1 |

Copyright 2023-Present -The University of Texas Health Science Center at Houston |