
|
|||||
|
 | |
| |
| |
| |
| |
| |
|
Gene: GFRA1 |
Gene summary for GFRA1 |
| Gene information | Species | Human | Gene symbol | GFRA1 | Gene ID | 2674 |
| Gene name | GDNF family receptor alpha 1 | |
| Gene Alias | GDNFR | |
| Cytomap | 10q25.3 | |
| Gene Type | protein-coding | GO ID | GO:0007154 | UniProtAcc | P56159 |
Top |
Malignant transformation analysis |
| Identification of the aberrant gene expression in precancerous and cancerous lesions by comparing the gene expression of stem-like cells in diseased tissues with normal stem cells |
| Entrez ID | Symbol | Replicates | Species | Organ | Tissue | Adj P-value | Log2FC | Malignancy |
| 2674 | GFRA1 | GSM4909293 | Human | Breast | IDC | 3.31e-57 | 7.53e-01 | 0.1581 |
| 2674 | GFRA1 | GSM4909299 | Human | Breast | IDC | 5.23e-06 | 1.88e-01 | 0.035 |
| 2674 | GFRA1 | GSM4909300 | Human | Breast | IDC | 1.98e-03 | 2.71e-01 | 0.0334 |
| 2674 | GFRA1 | GSM4909301 | Human | Breast | IDC | 5.11e-43 | 8.33e-01 | 0.1577 |
| 2674 | GFRA1 | GSM4909302 | Human | Breast | IDC | 4.79e-16 | 4.62e-01 | 0.1545 |
| 2674 | GFRA1 | GSM4909304 | Human | Breast | IDC | 9.24e-08 | 2.67e-01 | 0.1636 |
| 2674 | GFRA1 | GSM4909305 | Human | Breast | IDC | 1.39e-11 | 3.47e-01 | 0.0436 |
| 2674 | GFRA1 | GSM4909306 | Human | Breast | IDC | 8.00e-15 | 3.90e-01 | 0.1564 |
| 2674 | GFRA1 | GSM4909307 | Human | Breast | IDC | 3.50e-11 | 3.11e-01 | 0.1569 |
| 2674 | GFRA1 | GSM4909308 | Human | Breast | IDC | 2.06e-19 | 4.12e-01 | 0.158 |
| 2674 | GFRA1 | GSM4909311 | Human | Breast | IDC | 1.20e-15 | 6.05e-01 | 0.1534 |
| 2674 | GFRA1 | GSM4909312 | Human | Breast | IDC | 5.38e-56 | 1.11e+00 | 0.1552 |
| 2674 | GFRA1 | GSM4909313 | Human | Breast | IDC | 1.53e-02 | 1.89e-01 | 0.0391 |
| 2674 | GFRA1 | GSM4909321 | Human | Breast | IDC | 5.26e-21 | 6.58e-01 | 0.1559 |
| 2674 | GFRA1 | M1 | Human | Breast | IDC | 2.47e-38 | 8.45e-01 | 0.1577 |
| 2674 | GFRA1 | NCCBC2 | Human | Breast | DCIS | 9.92e-05 | 6.21e-01 | 0.1554 |
| 2674 | GFRA1 | P1 | Human | Breast | IDC | 5.45e-03 | 3.07e-01 | 0.1527 |
| 2674 | GFRA1 | P3 | Human | Breast | IDC | 3.08e-14 | 7.63e-01 | 0.1542 |
| 2674 | GFRA1 | DCIS2 | Human | Breast | DCIS | 6.73e-44 | 3.44e-01 | 0.0085 |
| 2674 | GFRA1 | P10T-E | Human | Esophagus | ESCC | 2.01e-04 | 1.34e-01 | 0.116 |
| Page: 1 2 |
| Tissue | Expression Dynamics | Abbreviation |
| Breast | 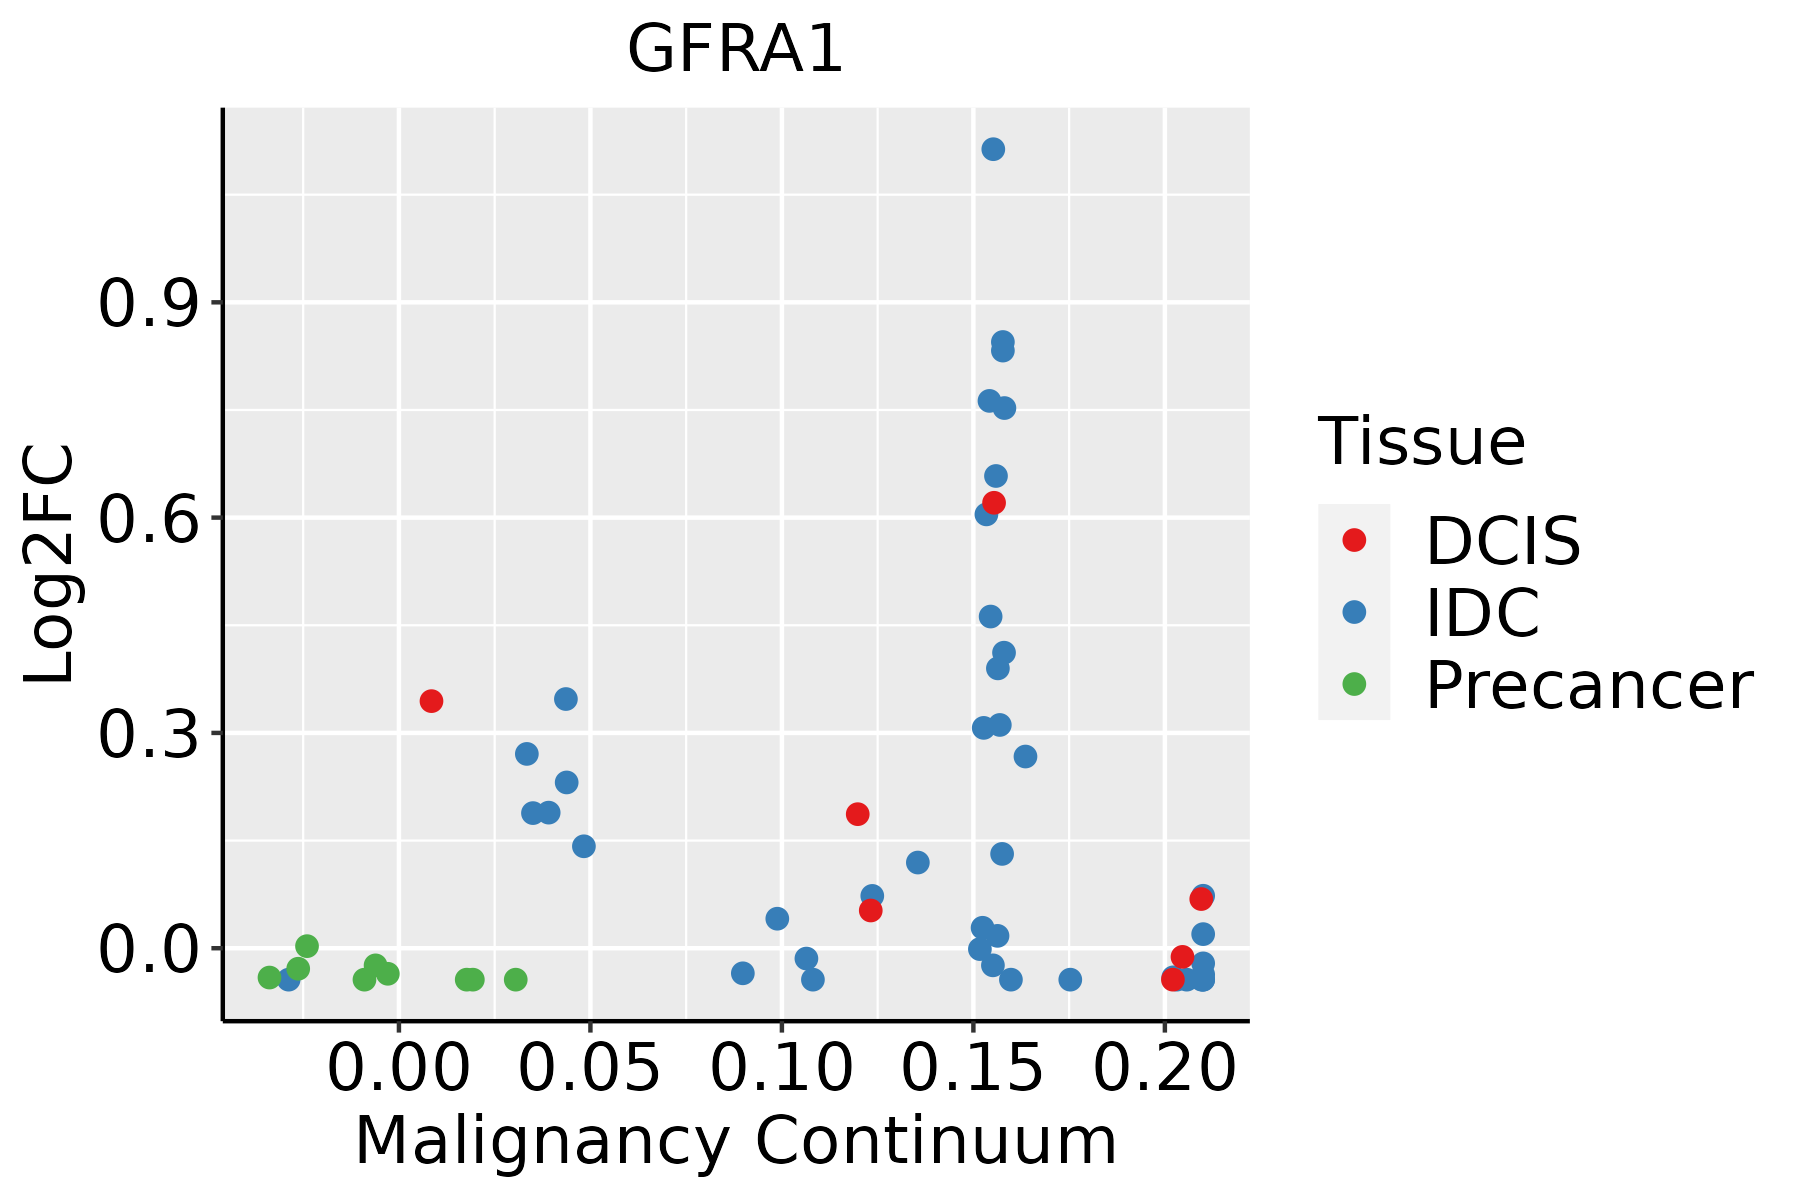 | IDC: Invasive ductal carcinoma |
| DCIS: Ductal carcinoma in situ | ||
| Precancer(BRCA1-mut): Precancerous lesion from BRCA1 mutation carriers | ||
| Esophagus | 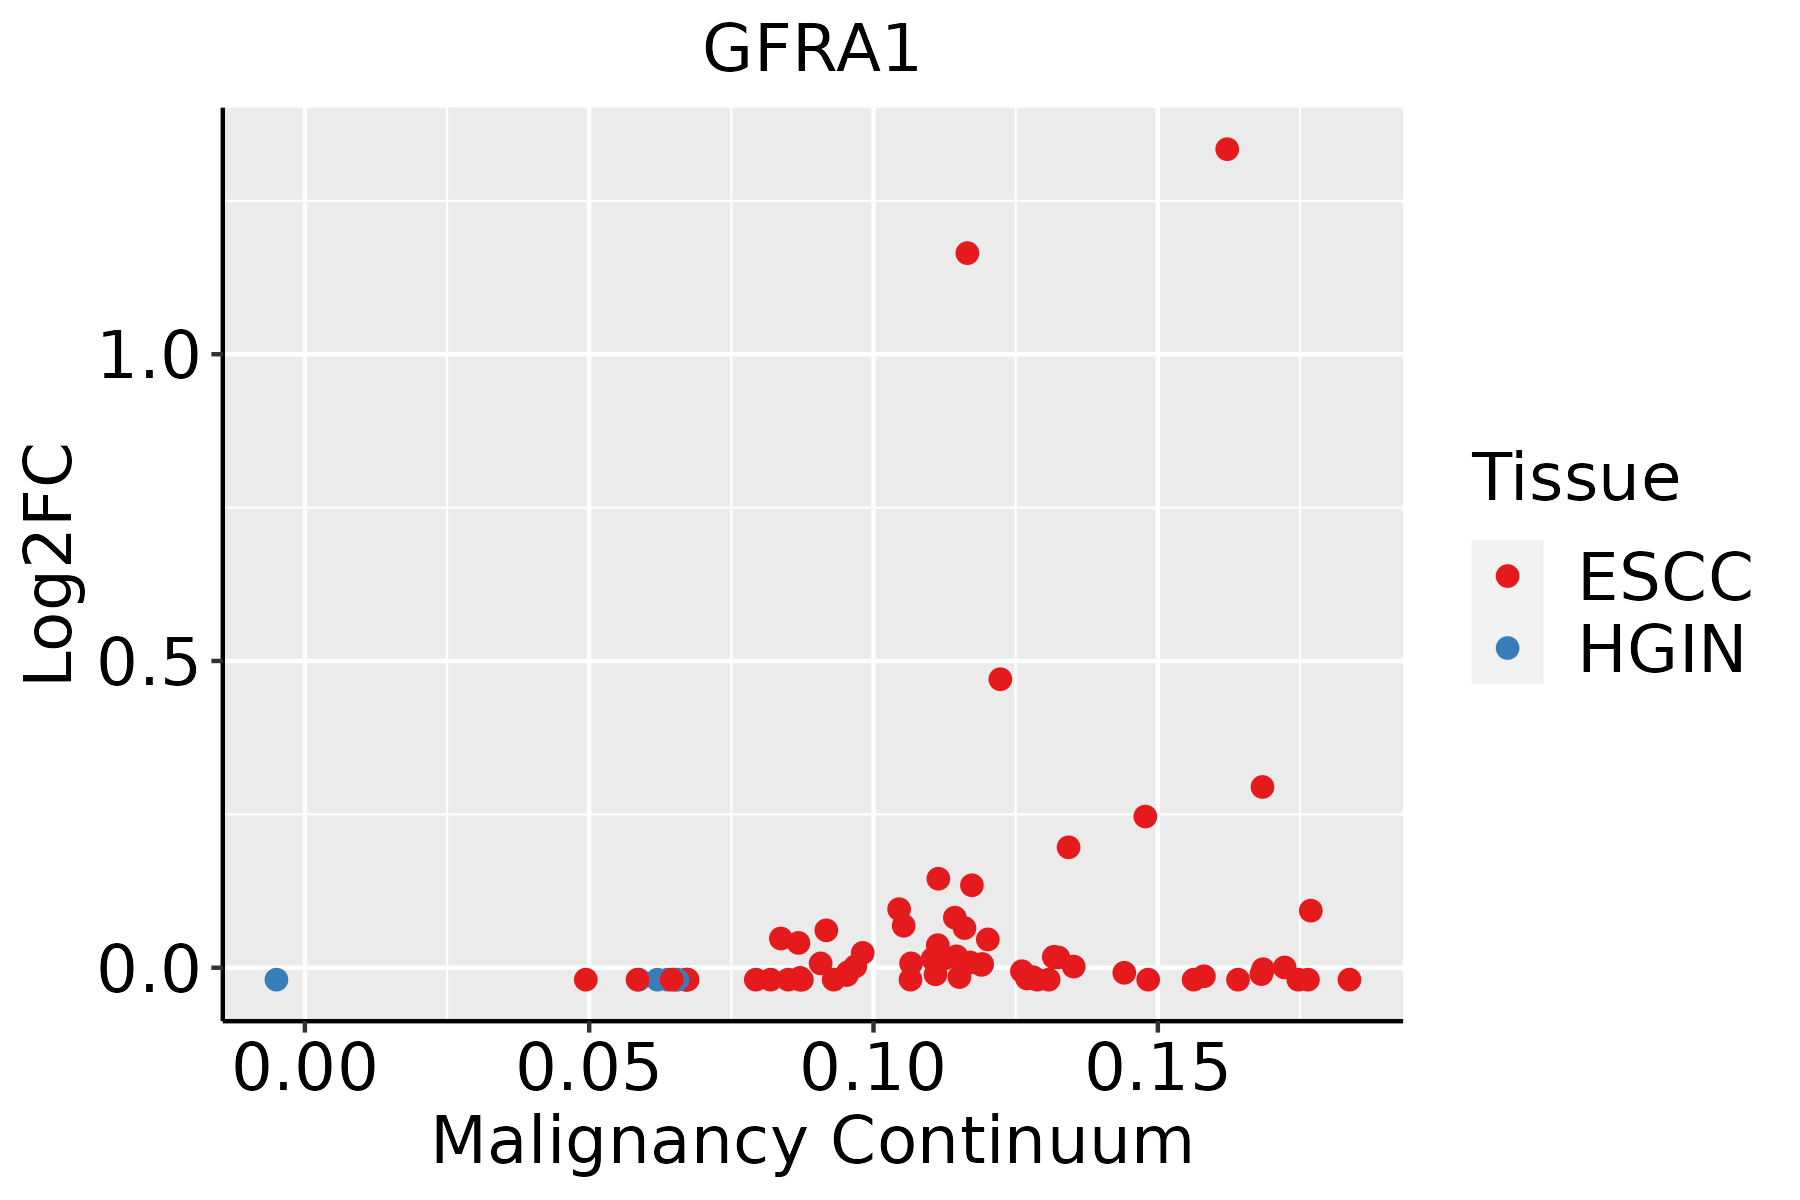 | ESCC: Esophageal squamous cell carcinoma |
| HGIN: High-grade intraepithelial neoplasias | ||
| LGIN: Low-grade intraepithelial neoplasias |
| ∗log2FC in expression of this searched gene in stem-like cells from each diseased tissue sample relative to stem-like cells in normal samples in each tissue plotted against the malignancy continuum. Samples are colored based on if they are from different disease stage. |
Top |
Malignant transformation related pathway analysis |
| Find out the enriched GO biological processes and KEGG pathways involved in transition from healthy to precancer to cancer |
| Tissue | Disease Stage | Enriched GO biological Processes |
| Colorectum | AD |  |
| Colorectum | SER |  |
| Colorectum | MSS |  |
| Colorectum | MSI-H |  |
| Colorectum | FAP |  |
| ∗Top 15 enriched GO BP terms are showed in the bar plot of each disease state in each tissue. Each row represents a significant GO biological process which is colored according to the -log10(p.adjust). |
| Page: 1 2 3 4 5 6 7 8 9 |
| GO ID | Tissue | Disease Stage | Description | Gene Ratio | Bg Ratio | pvalue | p.adjust | Count |
| Page: 1 |
| Pathway ID | Tissue | Disease Stage | Description | Gene Ratio | Bg Ratio | pvalue | p.adjust | qvalue | Count |
| Page: 1 |
Top |
Cell-cell communication analysis |
| Identification of potential cell-cell interactions between two cell types and their ligand-receptor pairs for different disease states |
| Ligand | Receptor | LRpair | Pathway | Tissue | Disease Stage |
| Page: 1 |
Top |
Single-cell gene regulatory network inference analysis |
| Find out the significant the regulons (TFs) and the target genes of each regulon across cell types for different disease states |
| TF | Cell Type | Tissue | Disease Stage | Target Gene | RSS | Regulon Activity |
| ∗The dot plots of a searched regulon are shown for all cell subpopulations in each disease state of each tissue based on the regulon specific score inferred using pySCENIC and by calculating the average expression. |
| Page: 1 |
Top |
Somatic mutation of malignant transformation related genes |
| Annotation of somatic variants for genes involved in malignant transformation |
| Hugo Symbol | Variant Class | Variant Classification | dbSNP RS | HGVSc | HGVSp | HGVSp Short | SWISSPROT | BIOTYPE | SIFT | PolyPhen | Tumor Sample Barcode | Tissue | Histology | Sex | Age | Stage | Therapy Types | Drugs | Outcome |
| GFRA1 | SNV | Missense_Mutation | novel | c.641N>T | p.Cys214Phe | p.C214F | P56159 | protein_coding | deleterious(0) | probably_damaging(0.996) | TCGA-A8-A094-01 | Breast | breast invasive carcinoma | Female | >=65 | I/II | Unknown | Unknown | SD |
| GFRA1 | SNV | Missense_Mutation | novel | c.257N>C | p.Asn86Thr | p.N86T | P56159 | protein_coding | deleterious(0.01) | possibly_damaging(0.491) | TCGA-AN-A0G0-01 | Breast | breast invasive carcinoma | Female | <65 | I/II | Unknown | Unknown | SD |
| GFRA1 | SNV | Missense_Mutation | novel | c.1090N>C | p.Thr364Pro | p.T364P | P56159 | protein_coding | tolerated(0.24) | benign(0.012) | TCGA-BH-A0DG-01 | Breast | breast invasive carcinoma | Female | <65 | I/II | Chemotherapy | taxotere | CR |
| GFRA1 | SNV | Missense_Mutation | c.1049N>G | p.Asp350Gly | p.D350G | P56159 | protein_coding | deleterious(0.01) | probably_damaging(0.951) | TCGA-D8-A147-01 | Breast | breast invasive carcinoma | Female | <65 | I/II | Chemotherapy | doxorubicine | SD | |
| GFRA1 | insertion | Frame_Shift_Ins | novel | c.607_608insCTGCTTCGGCTGCCAAGCTCCC | p.Val203AlafsTer41 | p.V203Afs*41 | P56159 | protein_coding | TCGA-AN-A0FS-01 | Breast | breast invasive carcinoma | Female | <65 | I/II | Unknown | Unknown | SD | ||
| GFRA1 | insertion | Nonsense_Mutation | novel | c.1126_1127insTGGTGACCACATGGTAGCTTG | p.Lys376delinsMetValThrThrTrpTerLeuGlu | p.K376delinsMVTTW*LE | P56159 | protein_coding | TCGA-BH-A0HF-01 | Breast | breast invasive carcinoma | Female | >=65 | I/II | Hormone Therapy | arimidex | SD | ||
| GFRA1 | SNV | Missense_Mutation | novel | c.1372C>A | p.Leu458Ile | p.L458I | P56159 | protein_coding | tolerated(0.3) | benign(0.027) | TCGA-2W-A8YY-01 | Cervix | cervical & endocervical cancer | Female | <65 | I/II | Chemotherapy | cisplatin | CR |
| GFRA1 | SNV | Missense_Mutation | rs775065355 | c.6N>G | p.Phe2Leu | p.F2L | P56159 | protein_coding | tolerated(0.89) | benign(0.01) | TCGA-C5-A7UC-01 | Cervix | cervical & endocervical cancer | Female | <65 | I/II | Unknown | Unknown | SD |
| GFRA1 | SNV | Missense_Mutation | c.715N>A | p.Glu239Lys | p.E239K | P56159 | protein_coding | tolerated(0.09) | benign(0.083) | TCGA-EX-A1H6-01 | Cervix | cervical & endocervical cancer | Female | <65 | I/II | Unknown | Unknown | SD | |
| GFRA1 | deletion | Frame_Shift_Del | novel | c.1261delN | p.Glu421LysfsTer11 | p.E421Kfs*11 | P56159 | protein_coding | TCGA-IR-A3LK-01 | Cervix | cervical & endocervical cancer | Female | >=65 | I/II | Chemotherapy | cisplatin | PD |
| Page: 1 2 3 4 5 6 7 8 9 10 |
Top |
Related drugs of malignant transformation related genes |
| Identification of chemicals and drugs interact with genes involved in malignant transfromation |
| (DGIdb 4.0) |
| Entrez ID | Symbol | Category | Interaction Types | Drug Claim Name | Drug Name | PMIDs |
| 2674 | GFRA1 | KINASE, EXTERNAL SIDE OF PLASMA MEMBRANE | 178101552 | |||
| 2674 | GFRA1 | KINASE, EXTERNAL SIDE OF PLASMA MEMBRANE | PYM50028 | |||
| 2674 | GFRA1 | KINASE, EXTERNAL SIDE OF PLASMA MEMBRANE | ANTISENSE OLIGONUCLEOTIDES | 11079571 |
| Page: 1 |

Copyright 2023-Present -The University of Texas Health Science Center at Houston |