
|
|||||
|
 | |
| |
| |
| |
| |
| |
|
Gene: GFPT1 |
Gene summary for GFPT1 |
| Gene information | Species | Human | Gene symbol | GFPT1 | Gene ID | 2673 |
| Gene name | glutamine--fructose-6-phosphate transaminase 1 | |
| Gene Alias | CMS12 | |
| Cytomap | 2p13.3 | |
| Gene Type | protein-coding | GO ID | GO:0006002 | UniProtAcc | Q06210 |
Top |
Malignant transformation analysis |
| Identification of the aberrant gene expression in precancerous and cancerous lesions by comparing the gene expression of stem-like cells in diseased tissues with normal stem cells |
| Entrez ID | Symbol | Replicates | Species | Organ | Tissue | Adj P-value | Log2FC | Malignancy |
| 2673 | GFPT1 | HTA11_3410_2000001011 | Human | Colorectum | AD | 1.09e-08 | -3.94e-01 | 0.0155 |
| 2673 | GFPT1 | HTA11_2951_2000001011 | Human | Colorectum | AD | 5.94e-07 | -7.00e-01 | 0.0216 |
| 2673 | GFPT1 | HTA11_78_2000001011 | Human | Colorectum | AD | 9.37e-05 | 6.08e-01 | -0.1088 |
| 2673 | GFPT1 | HTA11_347_2000001011 | Human | Colorectum | AD | 1.35e-19 | 9.68e-01 | -0.1954 |
| 2673 | GFPT1 | HTA11_411_2000001011 | Human | Colorectum | SER | 2.08e-02 | 6.13e-01 | -0.2602 |
| 2673 | GFPT1 | HTA11_2112_2000001011 | Human | Colorectum | SER | 4.69e-05 | 7.56e-01 | -0.2196 |
| 2673 | GFPT1 | HTA11_866_3004761011 | Human | Colorectum | AD | 1.50e-02 | -3.29e-01 | 0.096 |
| 2673 | GFPT1 | HTA11_6801_2000001011 | Human | Colorectum | SER | 3.00e-02 | 6.52e-01 | 0.0171 |
| 2673 | GFPT1 | HTA11_99999965062_69753 | Human | Colorectum | MSI-H | 6.84e-09 | 9.91e-01 | 0.3487 |
| 2673 | GFPT1 | HTA11_99999971662_82457 | Human | Colorectum | MSS | 7.16e-04 | 7.58e-01 | 0.3859 |
| 2673 | GFPT1 | HTA11_99999974143_84620 | Human | Colorectum | MSS | 9.55e-15 | -4.65e-01 | 0.3005 |
| 2673 | GFPT1 | F007 | Human | Colorectum | FAP | 2.42e-13 | -5.83e-01 | 0.1176 |
| 2673 | GFPT1 | A002-C-010 | Human | Colorectum | FAP | 2.54e-05 | -4.10e-01 | 0.242 |
| 2673 | GFPT1 | A001-C-207 | Human | Colorectum | FAP | 1.11e-12 | -4.37e-01 | 0.1278 |
| 2673 | GFPT1 | A015-C-203 | Human | Colorectum | FAP | 3.33e-48 | -7.62e-01 | -0.1294 |
| 2673 | GFPT1 | A015-C-204 | Human | Colorectum | FAP | 7.94e-09 | -3.20e-01 | -0.0228 |
| 2673 | GFPT1 | A014-C-040 | Human | Colorectum | FAP | 2.99e-12 | -7.01e-01 | -0.1184 |
| 2673 | GFPT1 | A002-C-201 | Human | Colorectum | FAP | 1.13e-27 | -5.24e-01 | 0.0324 |
| 2673 | GFPT1 | A002-C-203 | Human | Colorectum | FAP | 8.85e-12 | -4.20e-01 | 0.2786 |
| 2673 | GFPT1 | A001-C-119 | Human | Colorectum | FAP | 1.06e-21 | -7.27e-01 | -0.1557 |
| Page: 1 2 3 4 5 6 7 8 9 10 |
| Tissue | Expression Dynamics | Abbreviation |
| Colorectum (GSE201348) | 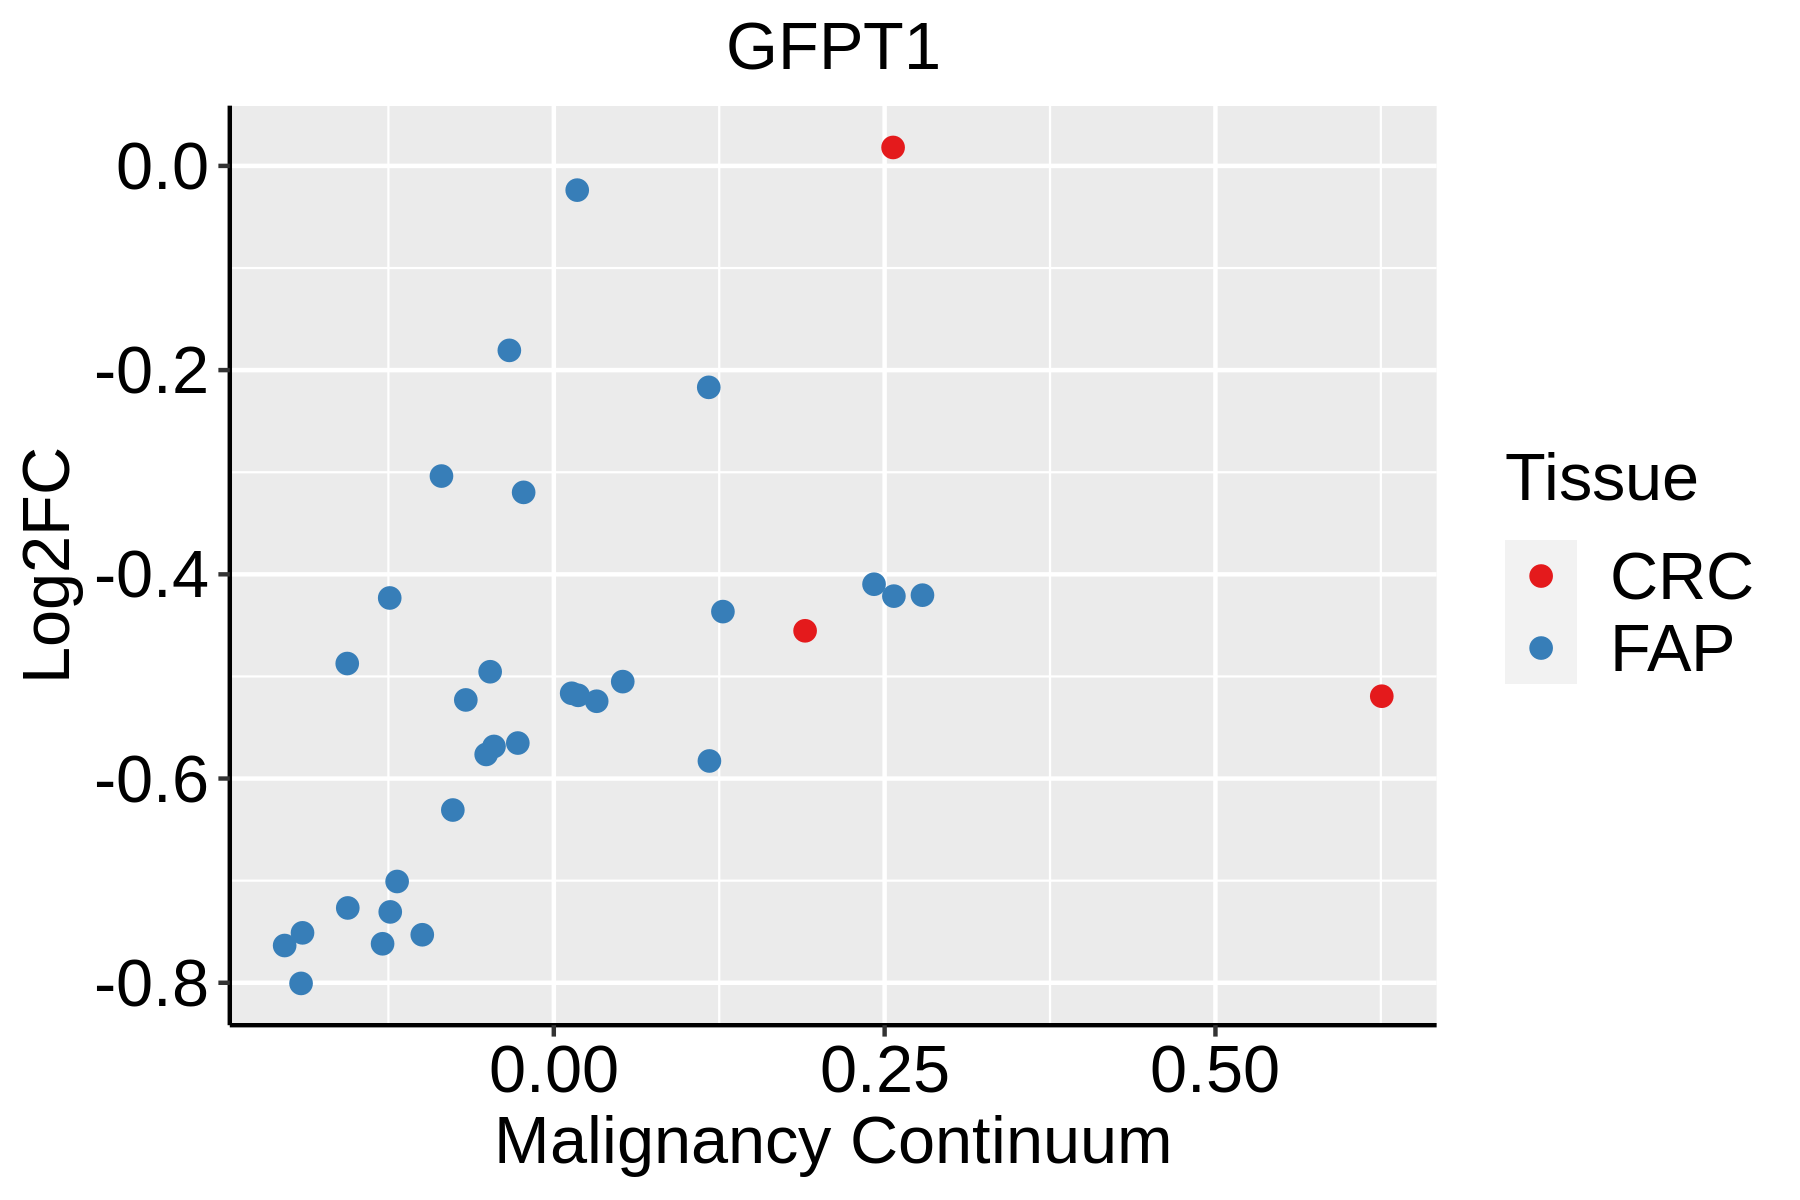 | FAP: Familial adenomatous polyposis |
| CRC: Colorectal cancer | ||
| Colorectum (HTA11) |  | AD: Adenomas |
| SER: Sessile serrated lesions | ||
| MSI-H: Microsatellite-high colorectal cancer | ||
| MSS: Microsatellite stable colorectal cancer | ||
| Esophagus | 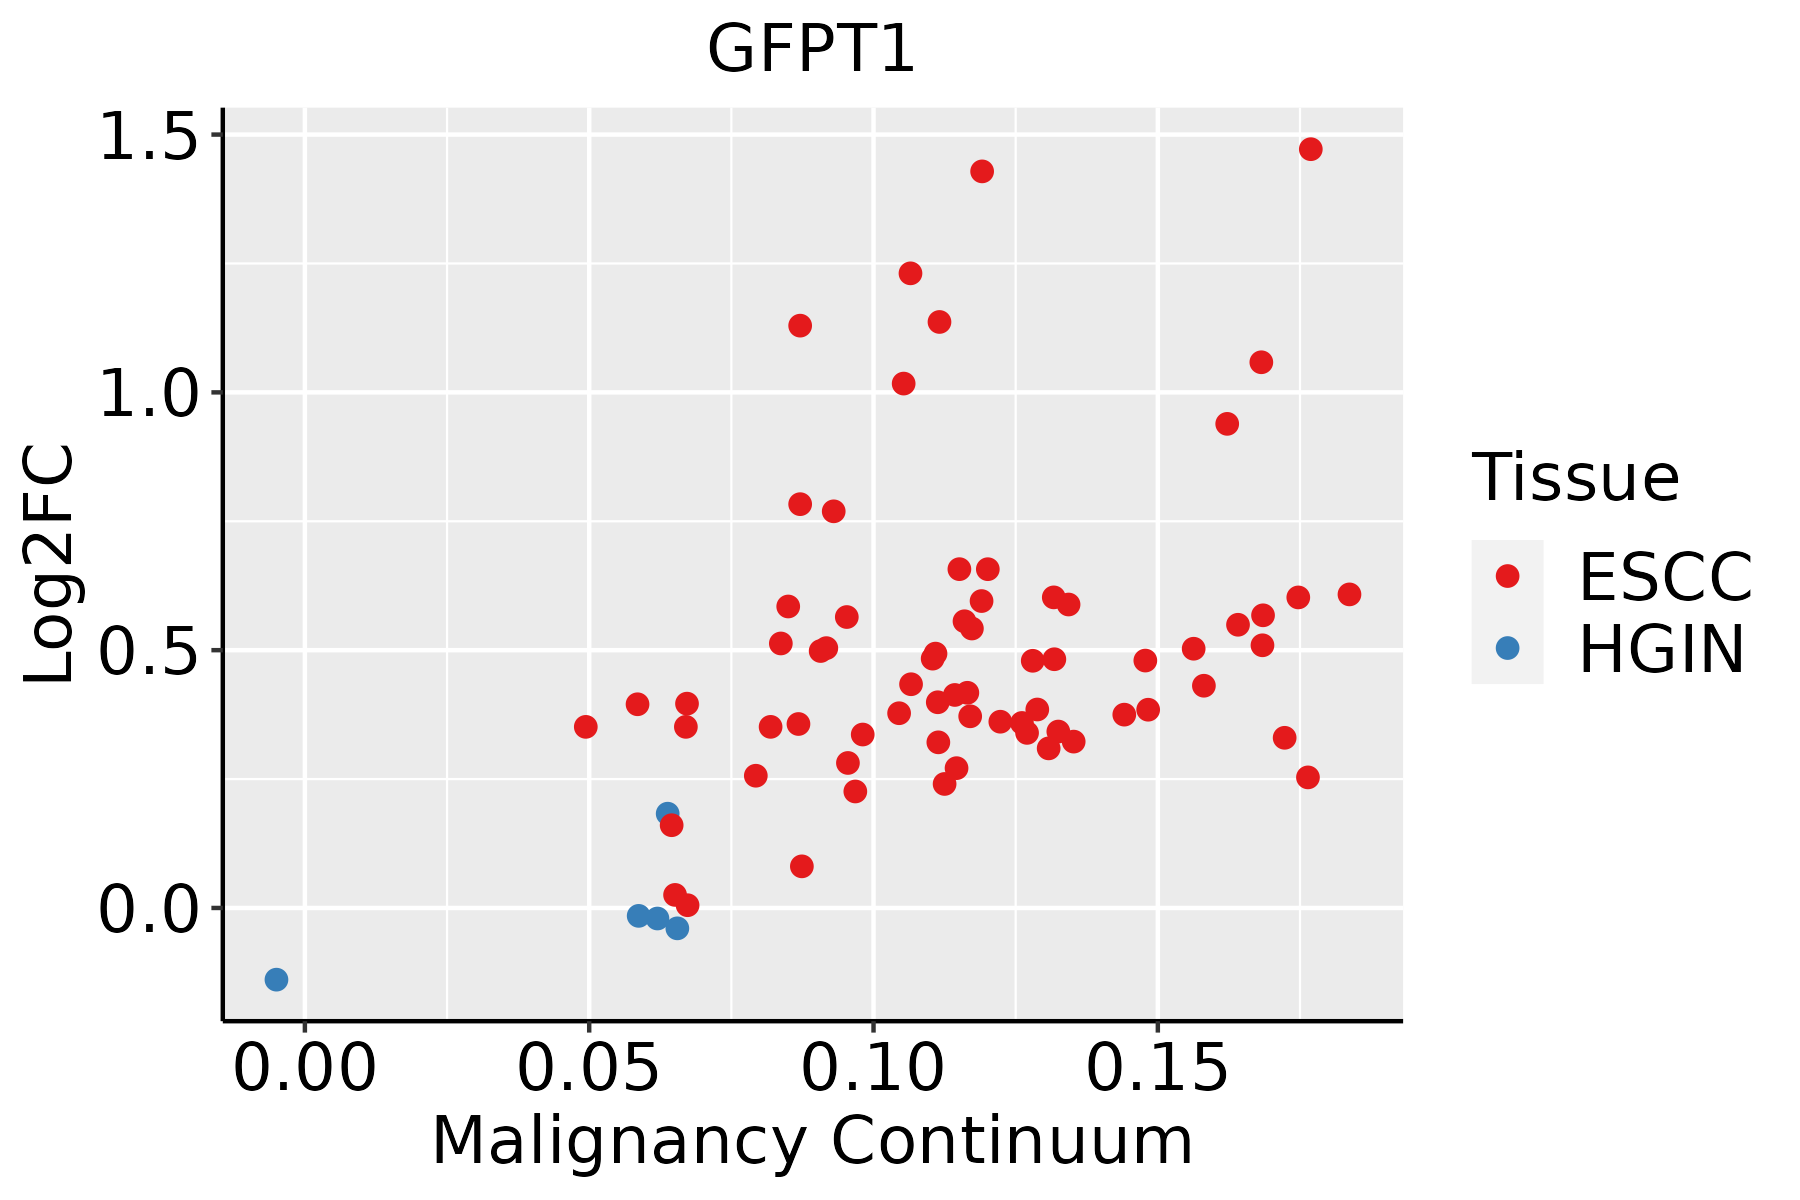 | ESCC: Esophageal squamous cell carcinoma |
| HGIN: High-grade intraepithelial neoplasias | ||
| LGIN: Low-grade intraepithelial neoplasias | ||
| Liver |  | HCC: Hepatocellular carcinoma |
| NAFLD: Non-alcoholic fatty liver disease | ||
| Lung | 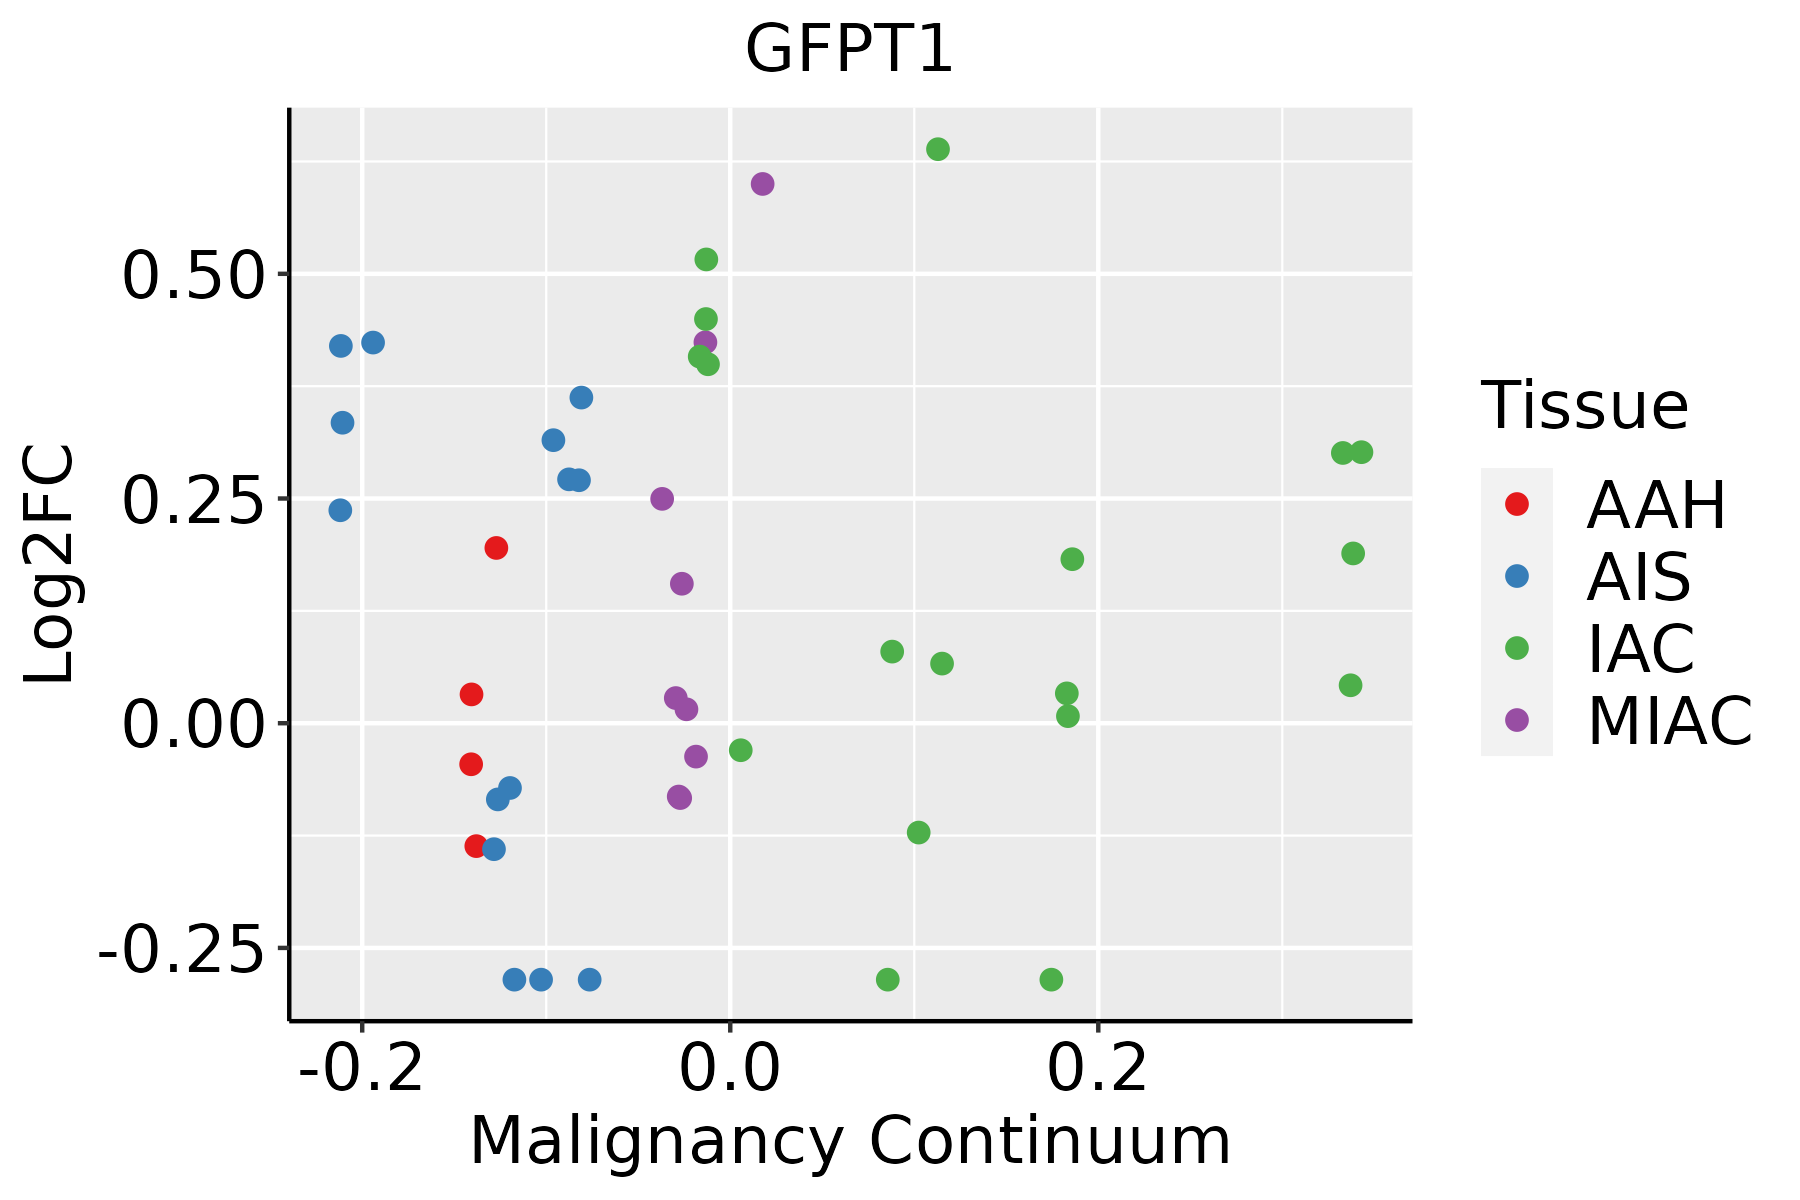 | AAH: Atypical adenomatous hyperplasia |
| AIS: Adenocarcinoma in situ | ||
| IAC: Invasive lung adenocarcinoma | ||
| MIA: Minimally invasive adenocarcinoma | ||
| Oral Cavity | 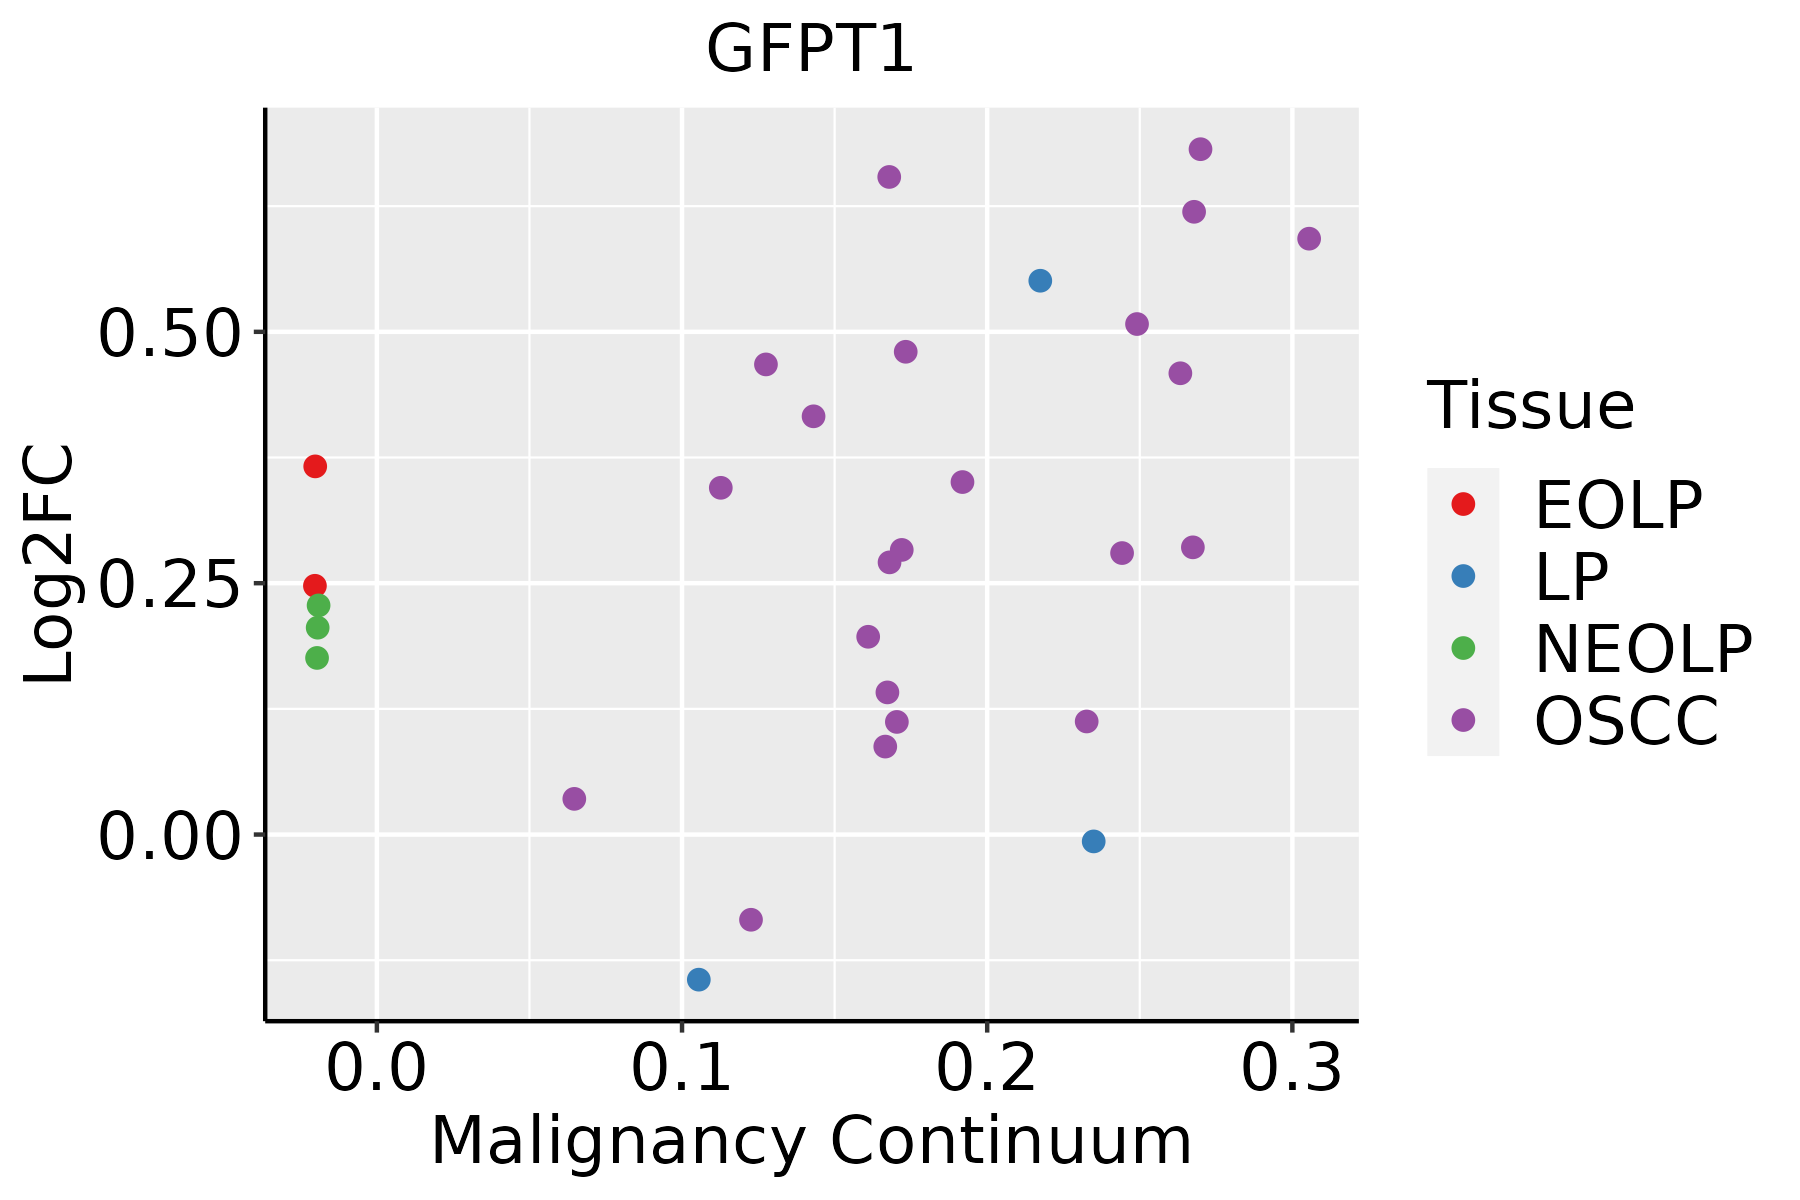 | EOLP: Erosive Oral lichen planus |
| LP: leukoplakia | ||
| NEOLP: Non-erosive oral lichen planus | ||
| OSCC: Oral squamous cell carcinoma | ||
| Prostate |  | BPH: Benign Prostatic Hyperplasia |
| Thyroid |  | ATC: Anaplastic thyroid cancer |
| HT: Hashimoto's thyroiditis | ||
| PTC: Papillary thyroid cancer |
| ∗log2FC in expression of this searched gene in stem-like cells from each diseased tissue sample relative to stem-like cells in normal samples in each tissue plotted against the malignancy continuum. Samples are colored based on if they are from different disease stage. |
Top |
Malignant transformation related pathway analysis |
| Find out the enriched GO biological processes and KEGG pathways involved in transition from healthy to precancer to cancer |
| Tissue | Disease Stage | Enriched GO biological Processes |
| Colorectum | AD |  |
| Colorectum | SER |  |
| Colorectum | MSS |  |
| Colorectum | MSI-H |  |
| Colorectum | FAP |  |
| ∗Top 15 enriched GO BP terms are showed in the bar plot of each disease state in each tissue. Each row represents a significant GO biological process which is colored according to the -log10(p.adjust). |
| Page: 1 2 3 4 5 6 7 8 9 |
| GO ID | Tissue | Disease Stage | Description | Gene Ratio | Bg Ratio | pvalue | p.adjust | Count |
| GO:0006091 | Colorectum | AD | generation of precursor metabolites and energy | 209/3918 | 490/18723 | 3.17e-28 | 6.61e-25 | 209 |
| GO:0015980 | Colorectum | AD | energy derivation by oxidation of organic compounds | 143/3918 | 318/18723 | 2.78e-22 | 2.49e-19 | 143 |
| GO:0007623 | Colorectum | AD | circadian rhythm | 72/3918 | 210/18723 | 4.50e-06 | 1.21e-04 | 72 |
| GO:0048511 | Colorectum | AD | rhythmic process | 94/3918 | 298/18723 | 1.00e-05 | 2.34e-04 | 94 |
| GO:0006487 | Colorectum | AD | protein N-linked glycosylation | 25/3918 | 65/18723 | 9.12e-04 | 8.71e-03 | 25 |
| GO:0009225 | Colorectum | AD | nucleotide-sugar metabolic process | 16/3918 | 36/18723 | 1.27e-03 | 1.12e-02 | 16 |
| GO:0006520 | Colorectum | AD | cellular amino acid metabolic process | 81/3918 | 284/18723 | 1.37e-03 | 1.19e-02 | 81 |
| GO:0006002 | Colorectum | AD | fructose 6-phosphate metabolic process | 7/3918 | 11/18723 | 2.59e-03 | 1.96e-02 | 7 |
| GO:0006486 | Colorectum | AD | protein glycosylation | 64/3918 | 226/18723 | 4.86e-03 | 3.27e-02 | 64 |
| GO:0043413 | Colorectum | AD | macromolecule glycosylation | 64/3918 | 226/18723 | 4.86e-03 | 3.27e-02 | 64 |
| GO:0070085 | Colorectum | AD | glycosylation | 67/3918 | 240/18723 | 5.78e-03 | 3.67e-02 | 67 |
| GO:00060911 | Colorectum | SER | generation of precursor metabolites and energy | 168/2897 | 490/18723 | 1.39e-25 | 1.70e-22 | 168 |
| GO:00159801 | Colorectum | SER | energy derivation by oxidation of organic compounds | 119/2897 | 318/18723 | 5.28e-22 | 4.62e-19 | 119 |
| GO:00076231 | Colorectum | SER | circadian rhythm | 54/2897 | 210/18723 | 7.98e-05 | 1.77e-03 | 54 |
| GO:00485111 | Colorectum | SER | rhythmic process | 65/2897 | 298/18723 | 2.18e-03 | 2.11e-02 | 65 |
| GO:00065201 | Colorectum | SER | cellular amino acid metabolic process | 61/2897 | 284/18723 | 4.20e-03 | 3.41e-02 | 61 |
| GO:00092251 | Colorectum | SER | nucleotide-sugar metabolic process | 12/2897 | 36/18723 | 6.11e-03 | 4.42e-02 | 12 |
| GO:00060912 | Colorectum | MSS | generation of precursor metabolites and energy | 186/3467 | 490/18723 | 1.14e-24 | 2.15e-21 | 186 |
| GO:00159802 | Colorectum | MSS | energy derivation by oxidation of organic compounds | 131/3467 | 318/18723 | 2.60e-21 | 2.70e-18 | 131 |
| GO:00076232 | Colorectum | MSS | circadian rhythm | 69/3467 | 210/18723 | 4.22e-07 | 1.67e-05 | 69 |
| Page: 1 2 3 4 5 6 7 8 |
| Pathway ID | Tissue | Disease Stage | Description | Gene Ratio | Bg Ratio | pvalue | p.adjust | qvalue | Count |
| hsa05415 | Colorectum | AD | Diabetic cardiomyopathy | 114/2092 | 203/8465 | 3.65e-22 | 3.06e-20 | 1.95e-20 | 114 |
| hsa054151 | Colorectum | AD | Diabetic cardiomyopathy | 114/2092 | 203/8465 | 3.65e-22 | 3.06e-20 | 1.95e-20 | 114 |
| hsa054152 | Colorectum | SER | Diabetic cardiomyopathy | 103/1580 | 203/8465 | 1.45e-25 | 1.61e-23 | 1.17e-23 | 103 |
| hsa054153 | Colorectum | SER | Diabetic cardiomyopathy | 103/1580 | 203/8465 | 1.45e-25 | 1.61e-23 | 1.17e-23 | 103 |
| hsa054154 | Colorectum | MSS | Diabetic cardiomyopathy | 106/1875 | 203/8465 | 2.47e-21 | 1.62e-19 | 9.92e-20 | 106 |
| hsa04931 | Colorectum | MSS | Insulin resistance | 36/1875 | 108/8465 | 4.74e-03 | 2.01e-02 | 1.23e-02 | 36 |
| hsa054155 | Colorectum | MSS | Diabetic cardiomyopathy | 106/1875 | 203/8465 | 2.47e-21 | 1.62e-19 | 9.92e-20 | 106 |
| hsa049311 | Colorectum | MSS | Insulin resistance | 36/1875 | 108/8465 | 4.74e-03 | 2.01e-02 | 1.23e-02 | 36 |
| hsa054156 | Colorectum | MSI-H | Diabetic cardiomyopathy | 57/797 | 203/8465 | 1.15e-14 | 3.11e-13 | 2.61e-13 | 57 |
| hsa054157 | Colorectum | MSI-H | Diabetic cardiomyopathy | 57/797 | 203/8465 | 1.15e-14 | 3.11e-13 | 2.61e-13 | 57 |
| hsa054158 | Colorectum | FAP | Diabetic cardiomyopathy | 70/1404 | 203/8465 | 2.62e-10 | 2.18e-08 | 1.33e-08 | 70 |
| hsa049312 | Colorectum | FAP | Insulin resistance | 32/1404 | 108/8465 | 4.90e-04 | 3.56e-03 | 2.16e-03 | 32 |
| hsa054159 | Colorectum | FAP | Diabetic cardiomyopathy | 70/1404 | 203/8465 | 2.62e-10 | 2.18e-08 | 1.33e-08 | 70 |
| hsa049313 | Colorectum | FAP | Insulin resistance | 32/1404 | 108/8465 | 4.90e-04 | 3.56e-03 | 2.16e-03 | 32 |
| hsa049314 | Colorectum | CRC | Insulin resistance | 28/1091 | 108/8465 | 1.78e-04 | 2.37e-03 | 1.61e-03 | 28 |
| hsa049315 | Colorectum | CRC | Insulin resistance | 28/1091 | 108/8465 | 1.78e-04 | 2.37e-03 | 1.61e-03 | 28 |
| hsa05415211 | Esophagus | ESCC | Diabetic cardiomyopathy | 146/4205 | 203/8465 | 5.81e-11 | 7.78e-10 | 3.99e-10 | 146 |
| hsa012505 | Esophagus | ESCC | Biosynthesis of nucleotide sugars | 28/4205 | 37/8465 | 1.10e-03 | 3.42e-03 | 1.75e-03 | 28 |
| hsa005202 | Esophagus | ESCC | Amino sugar and nucleotide sugar metabolism | 35/4205 | 49/8465 | 1.60e-03 | 4.88e-03 | 2.50e-03 | 35 |
| hsa049318 | Esophagus | ESCC | Insulin resistance | 69/4205 | 108/8465 | 1.92e-03 | 5.54e-03 | 2.84e-03 | 69 |
| Page: 1 2 3 |
Top |
Cell-cell communication analysis |
| Identification of potential cell-cell interactions between two cell types and their ligand-receptor pairs for different disease states |
| Ligand | Receptor | LRpair | Pathway | Tissue | Disease Stage |
| Page: 1 |
Top |
Single-cell gene regulatory network inference analysis |
| Find out the significant the regulons (TFs) and the target genes of each regulon across cell types for different disease states |
| TF | Cell Type | Tissue | Disease Stage | Target Gene | RSS | Regulon Activity |
| ∗The dot plots of a searched regulon are shown for all cell subpopulations in each disease state of each tissue based on the regulon specific score inferred using pySCENIC and by calculating the average expression. |
| Page: 1 |
Top |
Somatic mutation of malignant transformation related genes |
| Annotation of somatic variants for genes involved in malignant transformation |
| Hugo Symbol | Variant Class | Variant Classification | dbSNP RS | HGVSc | HGVSp | HGVSp Short | SWISSPROT | BIOTYPE | SIFT | PolyPhen | Tumor Sample Barcode | Tissue | Histology | Sex | Age | Stage | Therapy Types | Drugs | Outcome |
| GFPT1 | SNV | Missense_Mutation | novel | c.1903N>T | p.Val635Leu | p.V635L | Q06210 | protein_coding | tolerated(0.09) | benign(0.101) | TCGA-A2-A4S1-01 | Breast | breast invasive carcinoma | Female | >=65 | I/II | Unknown | Unknown | SD |
| GFPT1 | SNV | Missense_Mutation | rs770856462 | c.487C>T | p.Arg163Trp | p.R163W | Q06210 | protein_coding | deleterious(0.05) | possibly_damaging(0.832) | TCGA-A8-A06Q-01 | Breast | breast invasive carcinoma | Female | <65 | III/IV | Unknown | Unknown | SD |
| GFPT1 | SNV | Missense_Mutation | c.106N>T | p.Asp36Tyr | p.D36Y | Q06210 | protein_coding | deleterious(0) | probably_damaging(1) | TCGA-A8-A09G-01 | Breast | breast invasive carcinoma | Female | >=65 | III/IV | Unknown | Unknown | SD | |
| GFPT1 | SNV | Missense_Mutation | c.1161N>C | p.Leu387Phe | p.L387F | Q06210 | protein_coding | tolerated(0.08) | probably_damaging(0.98) | TCGA-D8-A1Y0-01 | Breast | breast invasive carcinoma | Female | >=65 | III/IV | Chemotherapy | cyclophosphamide+methotrexatum+fluorouracillum | SD | |
| GFPT1 | SNV | Missense_Mutation | c.757N>C | p.Ser253Arg | p.S253R | Q06210 | protein_coding | tolerated(0.52) | benign(0) | TCGA-E2-A1B5-01 | Breast | breast invasive carcinoma | Female | <65 | I/II | Hormone Therapy | tamoxiphen | SD | |
| GFPT1 | SNV | Missense_Mutation | c.1210N>G | p.Gln404Glu | p.Q404E | Q06210 | protein_coding | tolerated(0.41) | probably_damaging(0.997) | TCGA-C5-A1MK-01 | Cervix | cervical & endocervical cancer | Female | >=65 | III/IV | Chemotherapy | carboplatin | PD | |
| GFPT1 | SNV | Missense_Mutation | novel | c.1153C>T | p.Arg385Trp | p.R385W | Q06210 | protein_coding | deleterious(0) | probably_damaging(0.999) | TCGA-C5-A7CK-01 | Cervix | cervical & endocervical cancer | Female | <65 | I/II | Chemotherapy | cisplatin | SD |
| GFPT1 | SNV | Missense_Mutation | novel | c.661N>G | p.His221Asp | p.H221D | Q06210 | protein_coding | tolerated(0.17) | benign(0.101) | TCGA-C5-A8XJ-01 | Cervix | cervical & endocervical cancer | Female | >=65 | I/II | Chemotherapy | cisplatin | SD |
| GFPT1 | SNV | Missense_Mutation | c.1100A>C | p.Tyr367Ser | p.Y367S | Q06210 | protein_coding | tolerated(0.6) | benign(0) | TCGA-JW-A5VH-01 | Cervix | cervical & endocervical cancer | Female | <65 | I/II | Chemotherapy | carboplatin | PD | |
| GFPT1 | SNV | Missense_Mutation | novel | c.1930N>A | p.Glu644Lys | p.E644K | Q06210 | protein_coding | tolerated(0.13) | benign(0.144) | TCGA-VS-A8EL-01 | Cervix | cervical & endocervical cancer | Female | <65 | I/II | Chemotherapy | cisplatin | CR |
| Page: 1 2 3 4 5 6 7 8 |
Top |
Related drugs of malignant transformation related genes |
| Identification of chemicals and drugs interact with genes involved in malignant transfromation |
| (DGIdb 4.0) |
| Entrez ID | Symbol | Category | Interaction Types | Drug Claim Name | Drug Name | PMIDs |
| Page: 1 |

Copyright 2023-Present -The University of Texas Health Science Center at Houston |