
|
|||||
|
 | |
| |
| |
| |
| |
| |
|
Gene: GFOD1 |
Gene summary for GFOD1 |
| Gene information | Species | Human | Gene symbol | GFOD1 | Gene ID | 54438 |
| Gene name | glucose-fructose oxidoreductase domain containing 1 | |
| Gene Alias | ADG-90 | |
| Cytomap | 6p24.1-p23 | |
| Gene Type | protein-coding | GO ID | GO:0005575 | UniProtAcc | Q9NXC2 |
Top |
Malignant transformation analysis |
| Identification of the aberrant gene expression in precancerous and cancerous lesions by comparing the gene expression of stem-like cells in diseased tissues with normal stem cells |
| Entrez ID | Symbol | Replicates | Species | Organ | Tissue | Adj P-value | Log2FC | Malignancy |
| 54438 | GFOD1 | CCI_1 | Human | Cervix | CC | 1.30e-06 | 5.47e-01 | 0.528 |
| 54438 | GFOD1 | CCI_2 | Human | Cervix | CC | 3.04e-15 | 1.22e+00 | 0.5249 |
| 54438 | GFOD1 | CCI_3 | Human | Cervix | CC | 8.42e-11 | 7.26e-01 | 0.516 |
| 54438 | GFOD1 | sample3 | Human | Cervix | CC | 8.41e-06 | 1.35e-01 | 0.1387 |
| 54438 | GFOD1 | T3 | Human | Cervix | CC | 4.88e-06 | 1.54e-01 | 0.1389 |
| 54438 | GFOD1 | HTA11_99999974143_84620 | Human | Colorectum | MSS | 1.76e-04 | -2.18e-01 | 0.3005 |
| 54438 | GFOD1 | A002-C-201 | Human | Colorectum | FAP | 3.21e-03 | -1.87e-01 | 0.0324 |
| 54438 | GFOD1 | A002-C-205 | Human | Colorectum | FAP | 2.48e-05 | -2.13e-01 | -0.1236 |
| 54438 | GFOD1 | A015-C-005 | Human | Colorectum | FAP | 4.89e-03 | -2.13e-01 | -0.0336 |
| 54438 | GFOD1 | A002-C-114 | Human | Colorectum | FAP | 2.32e-05 | -2.36e-01 | -0.1561 |
| 54438 | GFOD1 | A002-C-016 | Human | Colorectum | FAP | 1.63e-05 | -1.68e-01 | 0.0521 |
| 54438 | GFOD1 | A002-C-116 | Human | Colorectum | FAP | 8.98e-05 | -1.90e-01 | -0.0452 |
| 54438 | GFOD1 | A014-C-008 | Human | Colorectum | FAP | 1.69e-02 | -2.03e-01 | -0.191 |
| 54438 | GFOD1 | A018-E-020 | Human | Colorectum | FAP | 5.36e-06 | -2.39e-01 | -0.2034 |
| 54438 | GFOD1 | F072B | Human | Colorectum | FAP | 3.23e-02 | -2.01e-01 | 0.257 |
| 54438 | GFOD1 | LZE7T | Human | Esophagus | ESCC | 1.04e-04 | 2.01e-01 | 0.0667 |
| 54438 | GFOD1 | LZE20T | Human | Esophagus | ESCC | 4.17e-04 | 1.27e-01 | 0.0662 |
| 54438 | GFOD1 | LZE24T | Human | Esophagus | ESCC | 3.28e-03 | 8.70e-02 | 0.0596 |
| 54438 | GFOD1 | P4T-E | Human | Esophagus | ESCC | 3.93e-07 | 1.87e-01 | 0.1323 |
| 54438 | GFOD1 | P5T-E | Human | Esophagus | ESCC | 3.31e-13 | 2.31e-01 | 0.1327 |
| Page: 1 2 3 4 5 |
| Tissue | Expression Dynamics | Abbreviation |
| Cervix | 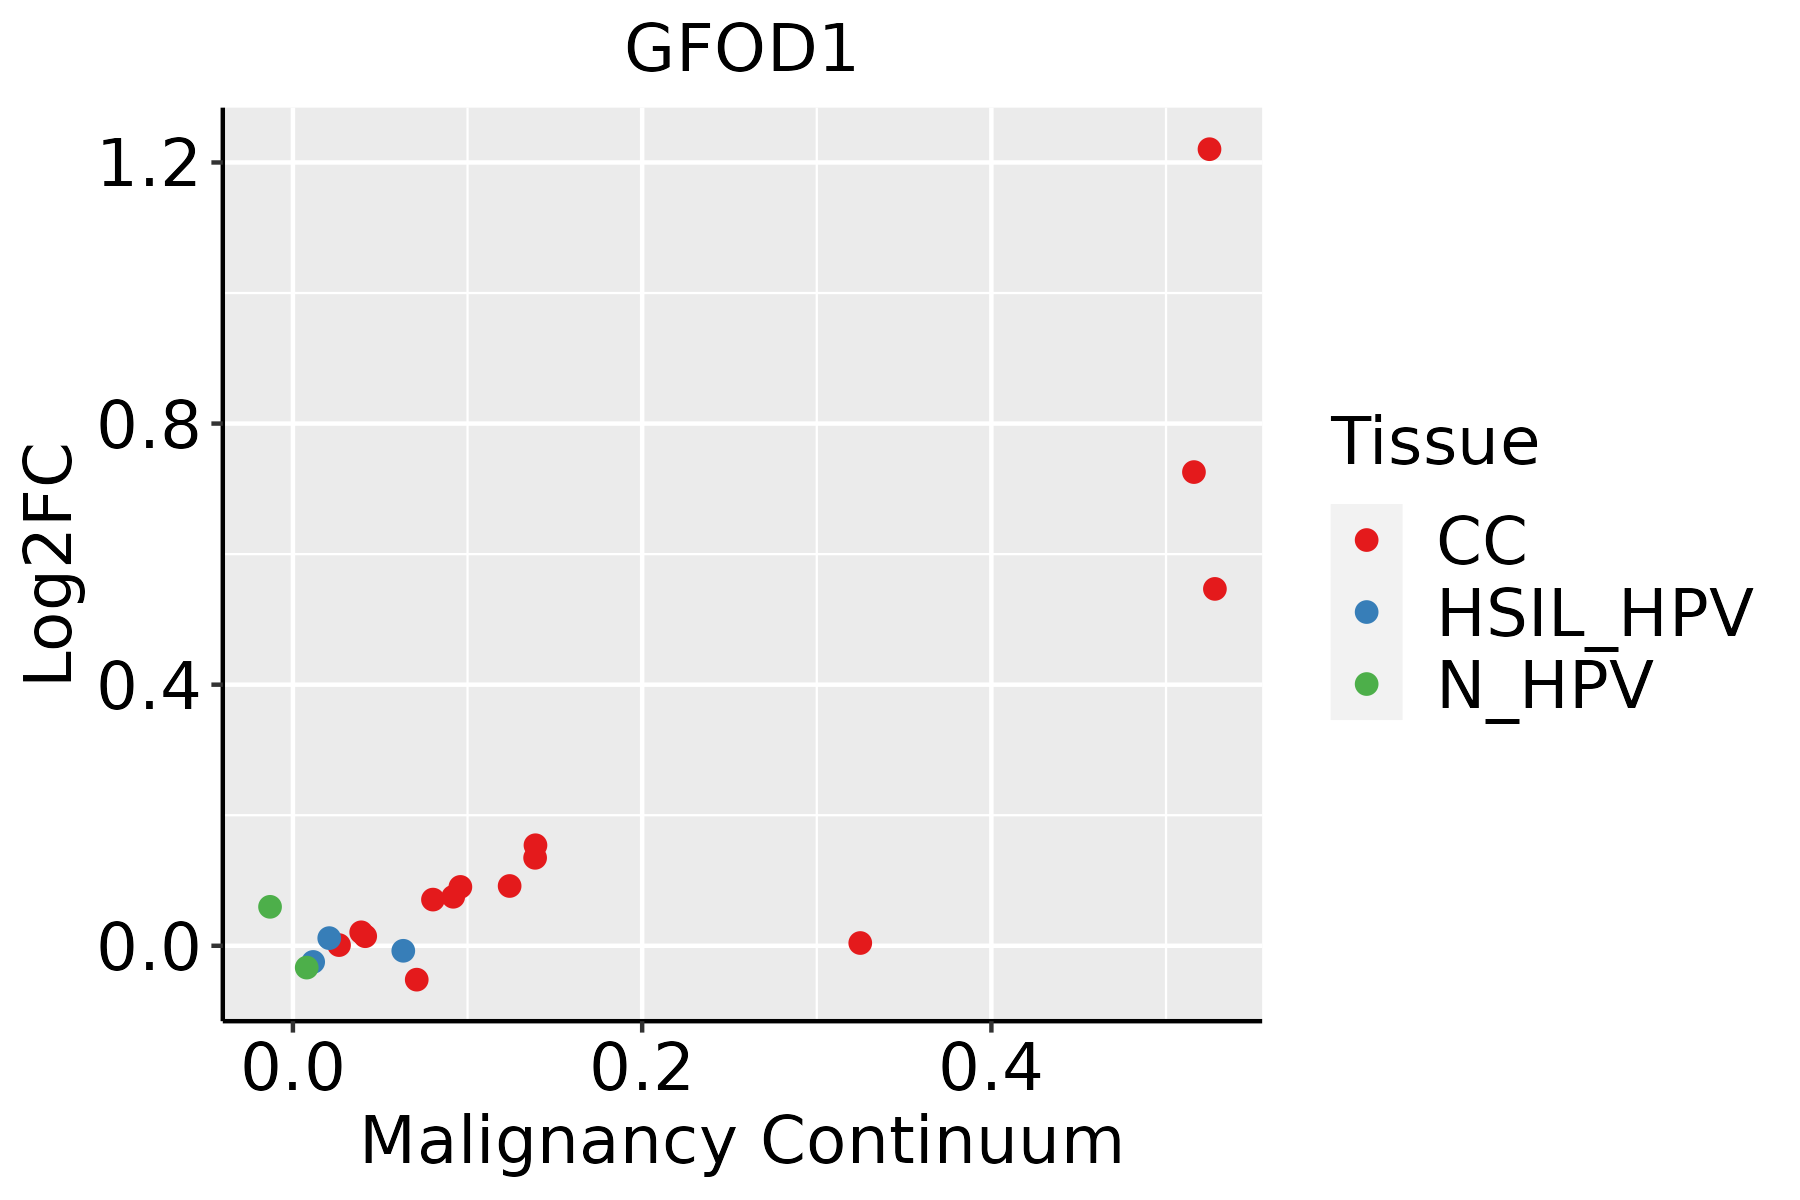 | CC: Cervix cancer |
| HSIL_HPV: HPV-infected high-grade squamous intraepithelial lesions | ||
| N_HPV: HPV-infected normal cervix | ||
| Colorectum (GSE201348) |  | FAP: Familial adenomatous polyposis |
| CRC: Colorectal cancer | ||
| Colorectum (HTA11) |  | AD: Adenomas |
| SER: Sessile serrated lesions | ||
| MSI-H: Microsatellite-high colorectal cancer | ||
| MSS: Microsatellite stable colorectal cancer | ||
| Esophagus | 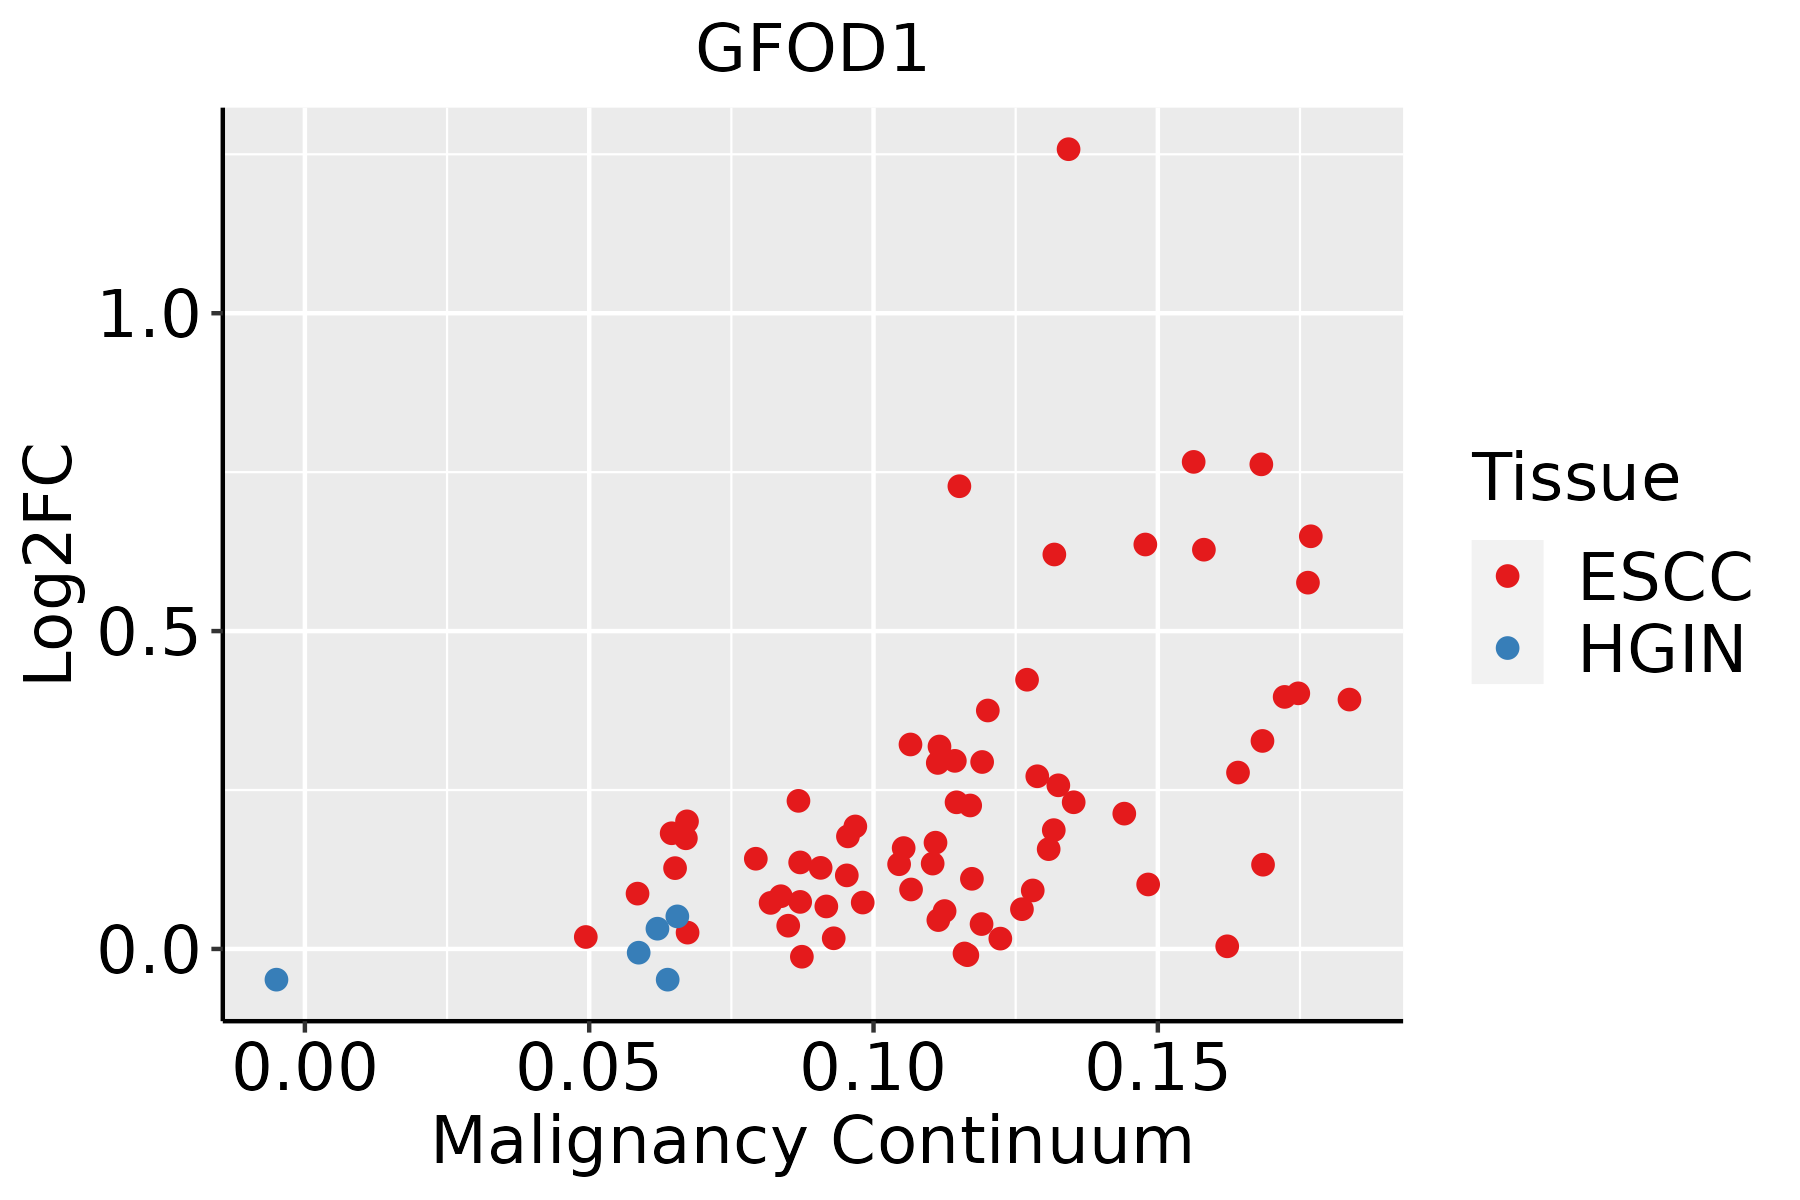 | ESCC: Esophageal squamous cell carcinoma |
| HGIN: High-grade intraepithelial neoplasias | ||
| LGIN: Low-grade intraepithelial neoplasias | ||
| Oral Cavity | 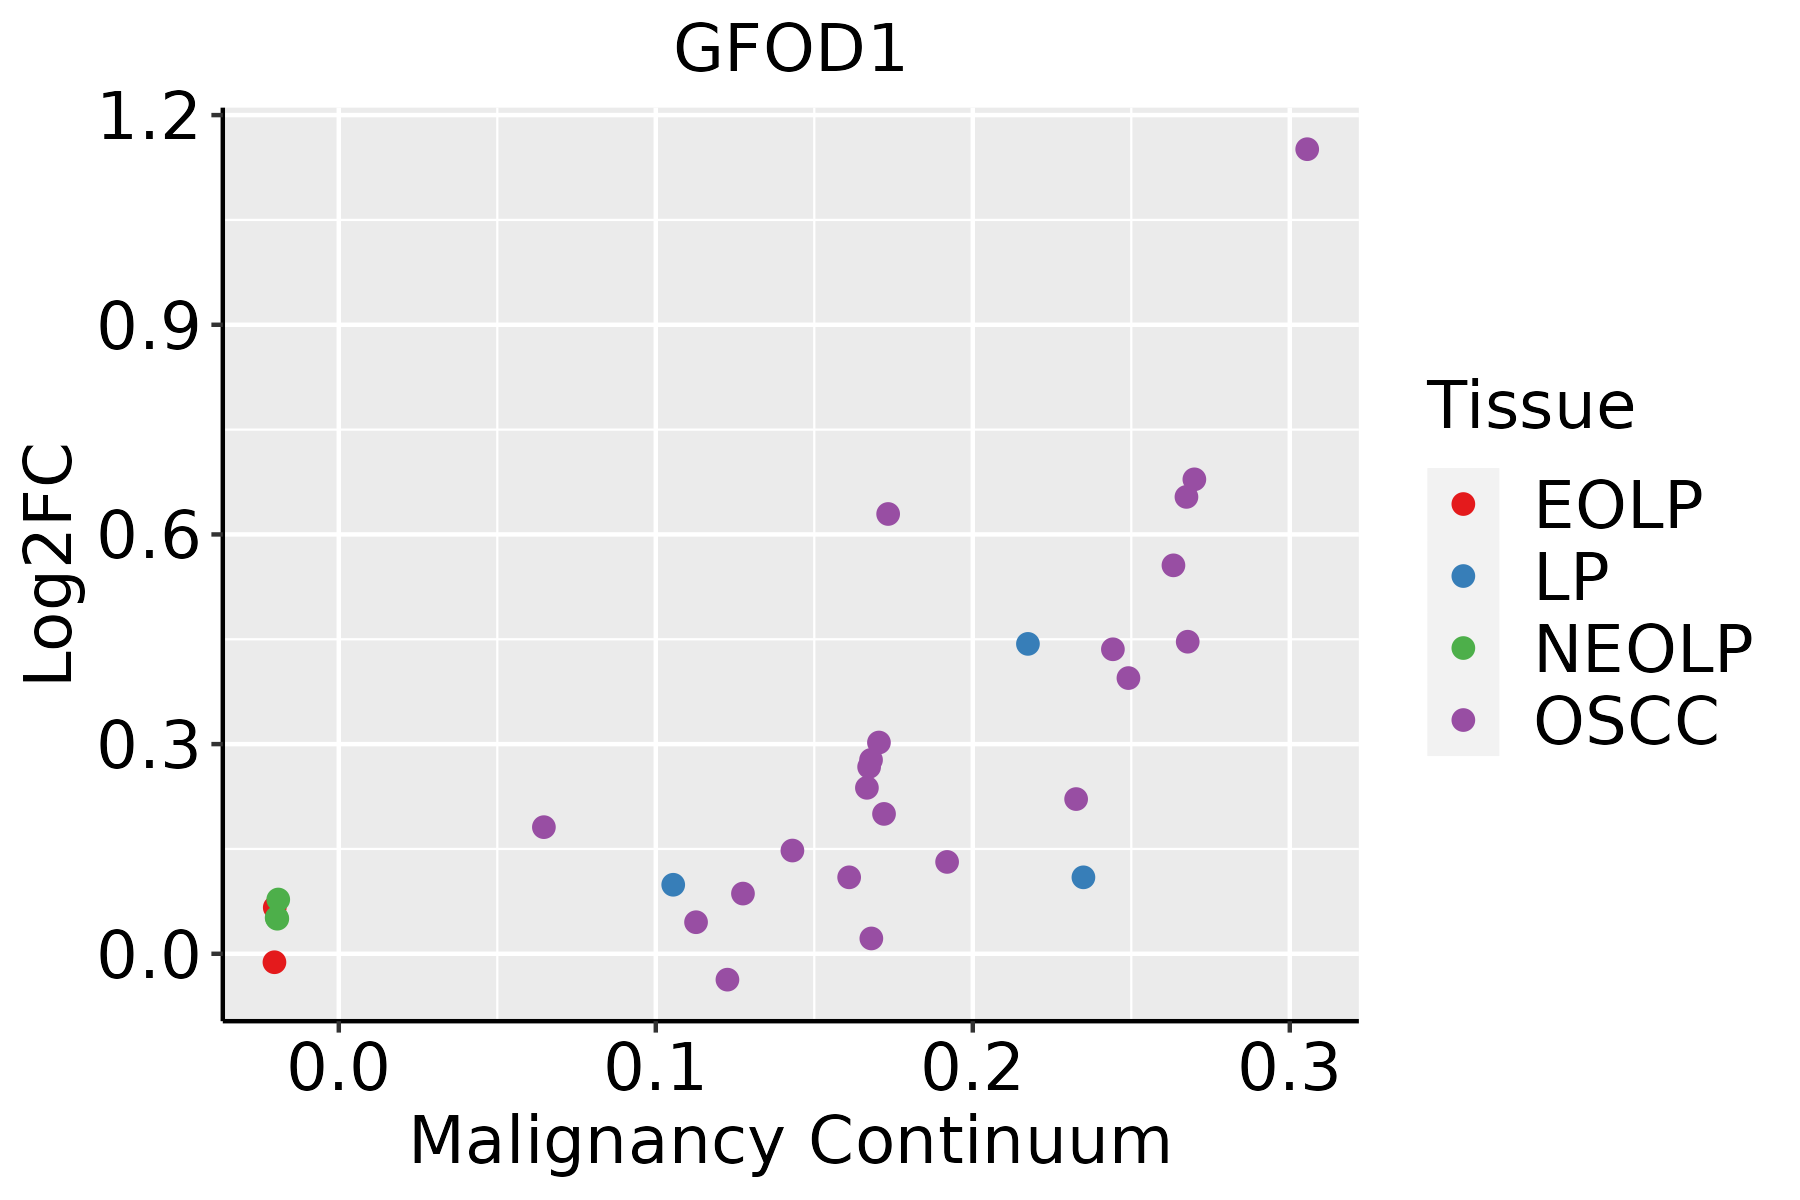 | EOLP: Erosive Oral lichen planus |
| LP: leukoplakia | ||
| NEOLP: Non-erosive oral lichen planus | ||
| OSCC: Oral squamous cell carcinoma |
| ∗log2FC in expression of this searched gene in stem-like cells from each diseased tissue sample relative to stem-like cells in normal samples in each tissue plotted against the malignancy continuum. Samples are colored based on if they are from different disease stage. |
Top |
Malignant transformation related pathway analysis |
| Find out the enriched GO biological processes and KEGG pathways involved in transition from healthy to precancer to cancer |
| Tissue | Disease Stage | Enriched GO biological Processes |
| Colorectum | AD |  |
| Colorectum | SER |  |
| Colorectum | MSS |  |
| Colorectum | MSI-H |  |
| Colorectum | FAP |  |
| ∗Top 15 enriched GO BP terms are showed in the bar plot of each disease state in each tissue. Each row represents a significant GO biological process which is colored according to the -log10(p.adjust). |
| Page: 1 2 3 4 5 6 7 8 9 |
| GO ID | Tissue | Disease Stage | Description | Gene Ratio | Bg Ratio | pvalue | p.adjust | Count |
| GO:0022411111 | Esophagus | ESCC | cellular component disassembly | 305/8552 | 443/18723 | 1.94e-23 | 4.57e-21 | 305 |
| GO:0006417111 | Esophagus | ESCC | regulation of translation | 304/8552 | 468/18723 | 1.53e-17 | 1.33e-15 | 304 |
| GO:003298416 | Esophagus | ESCC | protein-containing complex disassembly | 151/8552 | 224/18723 | 3.45e-11 | 1.15e-09 | 151 |
| GO:001820816 | Esophagus | ESCC | peptidyl-proline modification | 46/8552 | 58/18723 | 1.59e-07 | 2.51e-06 | 46 |
| GO:003406315 | Esophagus | ESCC | stress granule assembly | 23/8552 | 26/18723 | 6.82e-06 | 6.90e-05 | 23 |
| GO:00181263 | Esophagus | ESCC | protein hydroxylation | 23/8552 | 27/18723 | 2.60e-05 | 2.19e-04 | 23 |
| GO:00432446 | Esophagus | ESCC | regulation of protein-containing complex disassembly | 75/8552 | 121/18723 | 2.17e-04 | 1.36e-03 | 75 |
| GO:00195114 | Esophagus | ESCC | peptidyl-proline hydroxylation | 13/8552 | 15/18723 | 1.31e-03 | 6.26e-03 | 13 |
| GO:00436245 | Esophagus | ESCC | cellular protein complex disassembly | 78/8552 | 136/18723 | 4.00e-03 | 1.62e-02 | 78 |
| GO:002241112 | Liver | HCC | cellular component disassembly | 282/7958 | 443/18723 | 1.02e-19 | 1.38e-17 | 282 |
| GO:000641722 | Liver | HCC | regulation of translation | 287/7958 | 468/18723 | 8.79e-17 | 8.08e-15 | 287 |
| GO:003298411 | Liver | HCC | protein-containing complex disassembly | 138/7958 | 224/18723 | 5.59e-09 | 1.46e-07 | 138 |
| GO:00340632 | Liver | HCC | stress granule assembly | 24/7958 | 26/18723 | 1.35e-07 | 2.57e-06 | 24 |
| GO:001820811 | Liver | HCC | peptidyl-proline modification | 42/7958 | 58/18723 | 3.73e-06 | 4.85e-05 | 42 |
| GO:00432444 | Liver | HCC | regulation of protein-containing complex disassembly | 66/7958 | 121/18723 | 4.94e-03 | 2.07e-02 | 66 |
| GO:0018126 | Liver | HCC | protein hydroxylation | 18/7958 | 27/18723 | 9.75e-03 | 3.66e-02 | 18 |
| GO:00436242 | Liver | HCC | cellular protein complex disassembly | 71/7958 | 136/18723 | 1.39e-02 | 4.95e-02 | 71 |
| GO:002241119 | Oral cavity | OSCC | cellular component disassembly | 283/7305 | 443/18723 | 9.57e-27 | 3.37e-24 | 283 |
| GO:000641720 | Oral cavity | OSCC | regulation of translation | 274/7305 | 468/18723 | 4.39e-18 | 4.63e-16 | 274 |
| GO:003298410 | Oral cavity | OSCC | protein-containing complex disassembly | 136/7305 | 224/18723 | 3.42e-11 | 1.13e-09 | 136 |
| Page: 1 2 3 |
| Pathway ID | Tissue | Disease Stage | Description | Gene Ratio | Bg Ratio | pvalue | p.adjust | qvalue | Count |
| Page: 1 |
Top |
Cell-cell communication analysis |
| Identification of potential cell-cell interactions between two cell types and their ligand-receptor pairs for different disease states |
| Ligand | Receptor | LRpair | Pathway | Tissue | Disease Stage |
| Page: 1 |
Top |
Single-cell gene regulatory network inference analysis |
| Find out the significant the regulons (TFs) and the target genes of each regulon across cell types for different disease states |
| TF | Cell Type | Tissue | Disease Stage | Target Gene | RSS | Regulon Activity |
| ∗The dot plots of a searched regulon are shown for all cell subpopulations in each disease state of each tissue based on the regulon specific score inferred using pySCENIC and by calculating the average expression. |
| Page: 1 |
Top |
Somatic mutation of malignant transformation related genes |
| Annotation of somatic variants for genes involved in malignant transformation |
| Hugo Symbol | Variant Class | Variant Classification | dbSNP RS | HGVSc | HGVSp | HGVSp Short | SWISSPROT | BIOTYPE | SIFT | PolyPhen | Tumor Sample Barcode | Tissue | Histology | Sex | Age | Stage | Therapy Types | Drugs | Outcome |
| GFOD1 | SNV | Missense_Mutation | c.904N>C | p.Tyr302His | p.Y302H | Q9NXC2 | protein_coding | tolerated(0.21) | benign(0.067) | TCGA-A8-A09Z-01 | Breast | breast invasive carcinoma | Female | >=65 | I/II | Unknown | Unknown | SD | |
| GFOD1 | SNV | Missense_Mutation | c.889N>A | p.Asp297Asn | p.D297N | Q9NXC2 | protein_coding | tolerated(0.13) | benign(0.031) | TCGA-AQ-A7U7-01 | Breast | breast invasive carcinoma | Female | <65 | III/IV | Targeted Molecular therapy | rituximab | CR | |
| GFOD1 | SNV | Missense_Mutation | novel | c.121N>A | p.Glu41Lys | p.E41K | Q9NXC2 | protein_coding | tolerated(0.29) | benign(0.145) | TCGA-BH-A0B6-01 | Breast | breast invasive carcinoma | Female | <65 | I/II | Unknown | Unknown | SD |
| GFOD1 | SNV | Missense_Mutation | novel | c.14T>C | p.Val5Ala | p.V5A | Q9NXC2 | protein_coding | deleterious(0) | probably_damaging(0.986) | TCGA-2W-A8YY-01 | Cervix | cervical & endocervical cancer | Female | <65 | I/II | Chemotherapy | cisplatin | CR |
| GFOD1 | SNV | Missense_Mutation | novel | c.112N>A | p.Glu38Lys | p.E38K | Q9NXC2 | protein_coding | tolerated(0.16) | benign(0.395) | TCGA-VS-A952-01 | Cervix | cervical & endocervical cancer | Female | >=65 | I/II | Unknown | Unknown | SD |
| GFOD1 | SNV | Missense_Mutation | c.817N>G | p.Pro273Ala | p.P273A | Q9NXC2 | protein_coding | tolerated(0.76) | benign(0) | TCGA-AA-3680-01 | Colorectum | colon adenocarcinoma | Female | >=65 | III/IV | Chemotherapy | folinic | PD | |
| GFOD1 | SNV | Missense_Mutation | c.814N>C | p.Ala272Pro | p.A272P | Q9NXC2 | protein_coding | tolerated(0.06) | benign(0.259) | TCGA-AA-3715-01 | Colorectum | colon adenocarcinoma | Male | >=65 | I/II | Unknown | Unknown | PD | |
| GFOD1 | SNV | Missense_Mutation | c.34N>T | p.Leu12Phe | p.L12F | Q9NXC2 | protein_coding | tolerated(0.05) | possibly_damaging(0.588) | TCGA-QG-A5YX-01 | Colorectum | colon adenocarcinoma | Female | <65 | I/II | Chemotherapy | xeloda | CR | |
| GFOD1 | SNV | Missense_Mutation | novel | c.1120N>A | p.Ala374Thr | p.A374T | Q9NXC2 | protein_coding | tolerated(0.28) | benign(0.123) | TCGA-QG-A5Z2-01 | Colorectum | colon adenocarcinoma | Male | <65 | I/II | Unknown | Unknown | SD |
| GFOD1 | SNV | Missense_Mutation | c.376N>T | p.Pro126Ser | p.P126S | Q9NXC2 | protein_coding | deleterious(0) | probably_damaging(0.993) | TCGA-EI-6882-01 | Colorectum | rectum adenocarcinoma | Male | <65 | I/II | Unknown | Unknown | SD |
| Page: 1 2 3 4 5 6 |
Top |
Related drugs of malignant transformation related genes |
| Identification of chemicals and drugs interact with genes involved in malignant transfromation |
| (DGIdb 4.0) |
| Entrez ID | Symbol | Category | Interaction Types | Drug Claim Name | Drug Name | PMIDs |
| Page: 1 |

Copyright 2023-Present -The University of Texas Health Science Center at Houston |